
Abstract
The objective of this research was to determine if and to what extent students’ learning of geographic concepts can be improved through incorporation of hands-on play with Play-Doh® and LEGO® and geospatial technologies, specifically drones. The project team conducted six months of biweekly, collaborative instruction at Comstock Middle School in Michigan incorporating in-class activities such as drawing mental maps, creating contour lines of model landscapes in water boxes, constructing 3D landscapes from 2D topographic maps, building and operating small drones, and more. Compared pre- and post-tests reveal a 14% increase in overall scores, a statistically significant improvement in student performance.
Introduction
Background
Research in geography education has long examined how different pedagogical approaches impact student learning from primary school through higher education. While incredibly challenging given the range of instructional methods and diversity of learners, recent findings indicate the importance of active learning approaches to engage students in learning by asking students to think, reflect, discuss, present, role play, hands-on play, etc. Not surprisingly, these student-centered and inquiry-based active learning approaches enhance learning (Spronken-Smith et al. Citation2008; Schlemper et al. Citation2019). Using such activities, hands-on play in particular, are especially important at the K-12 levels to engage young learners regardless of class content (Harnapp and King Citation1991; Yilmaz et al. Citation2010; Kennedy and Archambault Citation2012; Afari et al. 2017; Anewalt and Polack Citation2018; Degner Citation2022). For example, hands-on approaches including use of Play-Doh®, sand, and/or other household items can help to support learning about landforms (Rule et al. Citation2006) and concepts in physical geography more broadly (Elkins Citation2012; Carnahan, Pankratz, and Alberts Citation2014). Similarly, creative hands-on activities incorporating baking to build “landscakes” (i.e., landscape cakes) provide powerful and memorable experiences for students that help to reinforce learned concepts (Boland Citation2011). Others incorporate LEGO®, using brick stacking and color schemes to visualize multiple variables, to support geoscience instruction (Jet Propulsion Laboratory Citation2023). Petty and Rule (Citation2008) utilize LEGO® DUPLO® blocks to effectively support spatial thinking in young children with the goal of transferring learned skills to topographic maps. Regardless of the hands-on activity selected, the aim is to improve engagement and create a fun classroom. In working with undergraduates conducting research, Jarrett and Burnley (Citation2010) ascribe student success to a playful and fun learning atmosphere. Such an environment encourages students to relax and be creative, inquisitive, and motivated by their interests (Jarrett and Burnley Citation2010).
Regarding the content covered during hands-on activities, Liben and Titus (Citation2012) emphasize the importance of visualizing topography in successful teaching and learning about the topic. Atit et al. (Citation2016) illustrate the use of hands-on activities to aid topographic map instruction, specifically use of Play-Doh® for a layering-based approach to modeling three-dimensional (3D) terrain. Similarly, Rodyenko (Citation1958) used balsa wood stacking to create 3D topographic models. More recently, adoption of augmented reality systems supported 3D terrain visualization (Carrera and Asensio Citation2017; Carrera et al. Citation2018; Petrasova et al. Citation2018). In addition, augmented reality sandboxes are increasingly implemented in geography and geology (primarily undergraduate) classrooms (Woods et al. Citation2016; McNeal et al. Citation2020; Soltis et al. Citation2020; Johnson and McNeal Citation2022), but introduction of such technologies does not always result in improved learning outcomes (Giorgis, Mahlen, and Anne Citation2017).
Fieldwork presents another avenue to engage students in hands-on learning (Huntoon, Bluth, and Kennedy Citation2001; Coughlin Citation2010; Yilmaz et al. Citation2010). The importance of fieldwork to support geography instruction has been frequently documented (Fuller, Rawlinson, and Bevan Citation2000; Raath and Golightly Citation2017; Cliffe Citation2019), although field experiences are less common in K-12 compared to higher education (Bednarz Citation1999). Service-learning, in particular, provides a community-oriented active learning approach to engage students (and the broader community) through field experiences (Parece and Aspaas Citation2007; Jurmu Citation2015). Instruction in geography and related courses (i.e., social studies, global studies) can also be supported through the use of geospatial technologies and methodologies provided by geographic information systems (GIS), global navigation satellite systems (GNSS), and remote sensing (Milson et al. Citation2005; Milson and Alibrandi Citation2008; Milson, Alibrandi, and Kerksi Citation2011; Henry and Semple Citation2012; Jadallah et al. Citation2017; Hsu, Tsai, and Chen Citation2018). Incorporation of GIS content into the curriculum led to improved standardized test scores in middle schools in Florida (Goldstein and Alibrandi Citation2013). Further, as early as the elementary school level, active learning through GIS-based problem solving (i.e., practically using geography skills instead of memorizing content) supports learning and helps to engage students (Keiper Citation1999). More broadly, GIS is highly supportive of problem-based learning approaches (Baker and White Citation2003). Geography lessons supported by geospatial technologies lead to improved relational thinking as compared to conventional lessons in high school (Favier and van der Schee Citation2014).
Inexpensive, off-the-shelf drones (also referred to as unoccupied aircraft systems or UAS) are a more recent addition to the suite of geospatial technologies available to geographers for data collection and analysis. In the realm of education, drones too can provide young students with hands-on learning opportunities (Joyce, Meiklejohn, and Mead Citation2020). Several studies report the utility of drones in supporting active learning in higher education geography courses (Williams, Tooth, and Gibson Citation2017; Cliffe Citation2019; Yang et al. Citation2020; Hodgson and Piovan Citation2022) and drones have been adopted in high school settings as an exciting new technology to invigorate interest in geospatial science (McKee and Hashemi-Beni Citation2020). Joyce, Meiklejohn, and Mead (Citation2020), note the challenges associated with adoption of drones in schools due to classroom teachers’ lack of expertise and technical skill among other difficulties (e.g., legal aircraft operation, risk management, time constraints, lack of funding, lack of support for professional development). Expertise offered by universities, though, can help to alleviate these issues (Joyce, Meiklejohn, and Mead Citation2020) and this sentiment has long been echoed in the GIS community (Kerski Citation2003). Similar to studies reporting GIS as a tool to improve learning outcomes, drones have proven to be a helpful technology to support math, physics, and geography education in primary school (Fokides, Papadakis, and Kourtis-Kazoullis Citation2017). Fombuena (Citation2017) stresses that drones support spatial education and improve spatial thinking stating that “UAVs [drones] have the potential to take a significant role in the development of innovative learning environments and the approximation of geosciences and geotechnologies across the curriculum” (13).
Previous studies confirm students from a variety of academic levels and backgrounds struggle to identify and visualize landscape features on topographic maps (Carswell Citation1970; Carswell Citation1971; Ishikawa and Kastens Citation2005; Rapp et al. Citation2007). As evidenced above, hands-on play and geospatial technologies are useful aids for teaching and learning within geography although they have primarily been examined separately. Few studies have integrated hands-on play with geospatial technologies to support active student learning. Further, most geography education studies lack long term engagement with student participants (see Bednarz, Heffron, and Huynh Citation2013). Consequently, there remains a need for research focused on K-12 students’ learning about geography and topographic maps using a variety of hands-on activities and cutting-edge geospatial technologies, such as drones, over a long period.
Research objective and project outcomes
Our research objective was to determine if and to what extent the learning of basic geographic concepts can be enhanced through hands-on play and geospatial technologies, specifically drones. To address this objective, we engaged middle school students biweekly for over six months. From the school teacher’s perspective, the desired outcomes of the project were for students to: (1) understand how to interpret a topographic map, (2) understand how a drone works and how they can be used to study the Earth, (3) create a landscape representation based on drone data, (4) understand how drones can be utilized for examining landscape changes, and (5) apply the knowledge and technology to help solve a real-world problem.
Materials and methods
Study group
This study was conducted at Comstock Public Schools, a public school meeting Title I criteria (i.e., high percentage of children from low-income families), in Comstock, Michigan. Two faculty members from Western Michigan University engaged directly with a classroom teacher to institute this project in a middle school Social Studies classroom throughout the 2019–2020 academic year. The project was impacted by the COVID-19 pandemic and subsequent shutdowns in spring 2020. Instruction, conducted collaboratively among the three authors, took place biweekly for one-day meetings with four class periods with a total of 92 students. The Comstock Public Schools administration fully supported this collaboration. The human subjects research protocol was approved by the Western Michigan University Institutional Review Board on 15 October 2019 (Project Number: 19-09-43), which included a research study consent and video/photo permission forms that were required to be signed by parents/guardians to be included in our results.
Activities and lesson plans
Prior to working with students, researchers acquired materials (e.g., Play-Doh®, LEGO®, Flybrix kits) and drone-collected aerial data, planned the academic year schedule, and prepared individual/daily lesson plans. To start, data were needed to show students how topographic information is generated. For this reason, drone-based aerial data collection was conducted on 27 June 2019 and 19 August 2019 at Robert Morris Park in Comstock, Michigan, using a DJI Mavic Pro 2 drone with integrated Hasselblad RGB digital camera. This park was selected due to its proximity to Comstock Middle School (familiarity to students) as well as its landscape (e.g., multiple land cover types and substantial relief variation). Comstock Township, who owns and manages the park, granted permission to collect data and focus our project there. Drone flights adhered to Federal Aviation Administration Part 107 regulations and were also approved by the Western Michigan University UAS Review Board prior to each flight. Aerial images were collected for Structure from Motion (SfM) photogrammetric processing to generate elevation data that students could use in the classroom. Pix4Dcapture was used to create a double-grid image collection mission plan that was repeated on both dates. Images were processed using Pix4Dcloud and georeferenced using geotags within images as well as Ground Control Points (GCPs) placed in the field before data collection, specifically ten Propeller AeroPoints. If unfamiliar with drone-based data collection and SfM image processing, we direct readers to Mathews and Frazier (Citation2017) and Mathews (Citation2021). Data were processed to create georeferenced point clouds, orthophotos, and digital elevation models (that were converted to contour lines for the Play-Doh® and LEGO® activities) that were shared with students beginning in October. Students were not directly involved with data processing but were able to learn about the procedure and view results.
In September, biweekly classroom meetings with students began and continued until the COVID-19 pandemic shutdown concluded the project in March 2020 (see ). Student participants took a pretest prior to instruction (see ‘Assessment’ section). Visits in September set the stage for the project as a whole, so students knew what to expect, what we were doing and why, etc. Further, September meetings emphasized geography basics. Activities included a mental mapping exercise where students sketched a map of Comstock and discussed the importance of mapping (and mapping as a selective process), and a water box activity to begin instruction on topographic mapping and contour lines (see Carter et al. Citation2008 for an example).
Table 1. Schedule of activities for 2019–2020 academic year.
In October, we shifted our focus to discussing drones and showcasing data collected at the local park (including describing the data collection process and showing a video from one of the data collection dates). During these meetings, students constructed and operated Flybrix drones (flybrix.com) outdoors at the school. These kits use LEGO® bricks and add-on parts such as motors, propellers, and a battery along with building instructions and a remote controller. During the later October meeting, students observed a high-end mapping drone demonstration to reiterate the work completed before school began.
During November and December, students and researchers continued working with contour lines and topographic maps to interpret landscape features. Hands-on activities were very important during this month and into December. Activities included using a basic topographic map to construct the 3D landscape using Play-Doh®. Students were able to practice this multiple times with different contour maps. Instruction supported these activities by providing background on reading topographic maps and how to interpret landscape features. Construction of landscapes from contour maps continued into December although we switched from Play-Doh® to LEGO® to expand students’ 3D thinking with varied materials. Created landscapes were visually assessed by the researchers to offer guidance to students struggling to understand the concepts and/or activity. At this stage we introduced the research project planned for the latter part of the academic year—this focused on the park and how the community could more sustainably manage it.
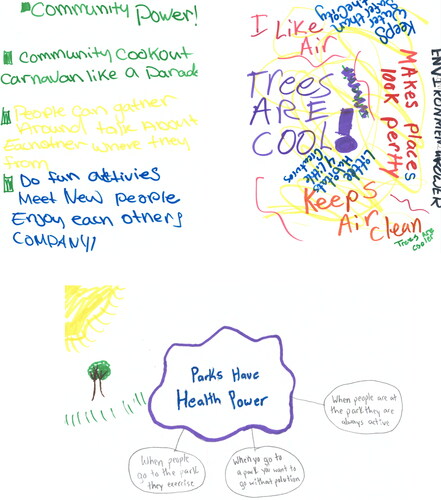
During January and February, students brainstormed about the usefulness of parks to the community, learned about sustainable practices generally, and considered sustainable practices in application to their local park. This work was coupled with continued hands-on activities using Play-Doh® to model the terrain of the local park (i.e., a known landscape as compared to prior hypothetical examples). Activities were suspended in March due to the COVID-19 pandemic. We intended for students to propose (in group presentations) to the Comstock Township Board how the park could be improved with regard to environmental sustainability. The project would have concluded in April with a day of fun activities at the park to celebrate Earth Day.
Assessment
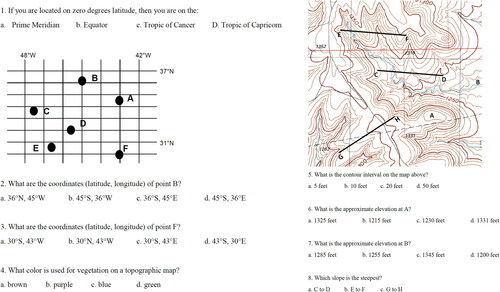
To assess the degree to which hands-on play and geospatial technologies can improve learning about basic geographic concepts (including topographic mapping), we conducted a pretest prior to instruction and a post-test after instruction concluded. The eight-question assessment () included questions on the basics of the global grid (questions 1–4) as well as topographic maps (questions 5–8). Tests were conducted by the teacher on non-project days.
Figure 1. The test used for pre- and post-instruction assessment.
Analyses
Due to the variety of data collected throughout the study, we conducted quantitative and qualitative analyses. The quantitative data were pre- and post-test results. We examine these data in two ways: (1) by student with overall test scores taken as a percentage (comparing pre- to post-test scores), and (2) by question with all student results aggregated. To analyze test scores, we planned to utilize a paired samples t-test to compare pre- and post-tests, but the assumption of normally distributed differences between the two samples was not met as confirmed with a Shapiro-Wilk test. Therefore, we used the nonparametric alternative, the Wilcoxon signed-rank test, to complete the statistical comparison of test scores. We further examine by question results using descriptive statistics. Statistical analyses were conducted using open-source JASP software (Version 0.16.4; jasp-stats.org).
Qualitative data were collected in the form of written reflections by students that took place after each school visit as well as written comments from the teacher (third author) and anecdotal observations from the other authors. We reviewed student reflections, and present selected quotations representative of the group in aggregate. We also provide the overarching reflection from the end of the project from the teacher (third author) and supply recommendations on our instructional approach.
Results
Following the schedule presented in , we describe and provide a series of figures to illustrate our hands-on activities. In order for students to visualize contour lines, one September activity utilized water boxes containing model landscapes to create/draw the water line on transparency sheets after continually adding water (see ). By October, we shifted to learning about drones by building and flying Flybrix kits (). Following initial instruction on drones and the building activity, students were shown a larger drone used for data collection, learned briefly about the data processing, and viewed data generated from the local park (). Returning our focus back to topographic maps, we used Play-Doh® to manually form landscapes () and later shifted to LEGO® (). In both cases, students were provided 2D topographic maps from which they had to create a 3D landscape. Students quickly became adept landscape modelers through rounds of practice over several meeting days. Importantly, these two very different materials challenged students (i.e., Play-Doh® as flexible and moldable; LEGO® as rigid, fixed, and “blocky”), where some thrived with one material but not with the other. Regardless, it became clear that these tactile experiences solidified their understanding of topographic maps and how to visualize terrain. By February we shifted focus toward the project at a local park. Students formed teams to consider why parks are special and what they offer the community. Students created graphics with text to explain their ideas to the class ().
Figure 2. Students working with water boxes to create contour lines.
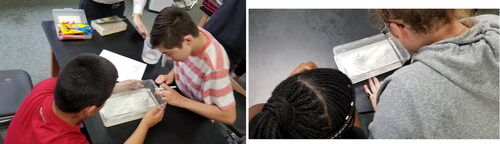
Figure 3. Students building and flying Flybrix drones.
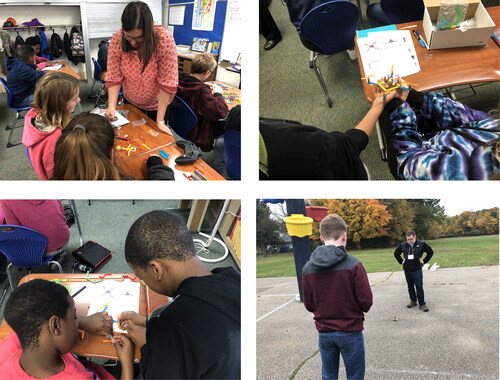
Figure 4. Drone-collected data products of a local park: (a) SfM-generated point cloud, (b) orthophoto, (c) digital elevation model, and (d) topographic map.
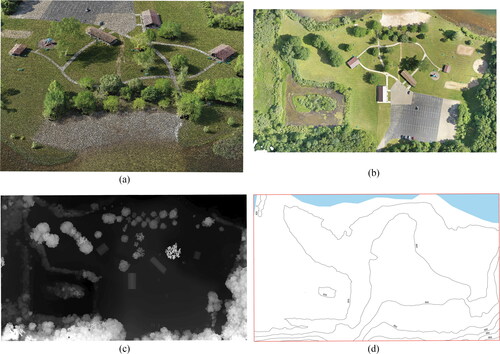
Figure 5. Students creating terrain models from topographic maps with Play-Doh®.
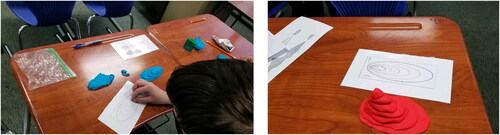
Figure 6. Students creating terrain models from topographic maps with LEGO®.
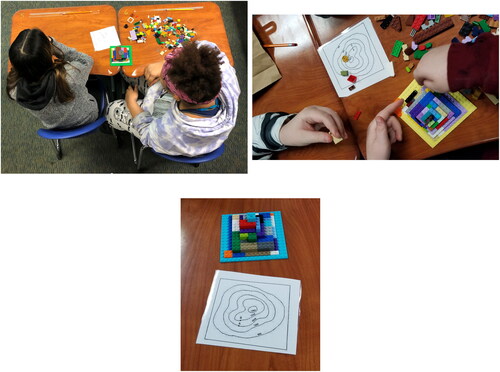
Figure 7. Example student team notes from sustainable local park discussion activity.
Quantitative findings: Pre- and post-tests
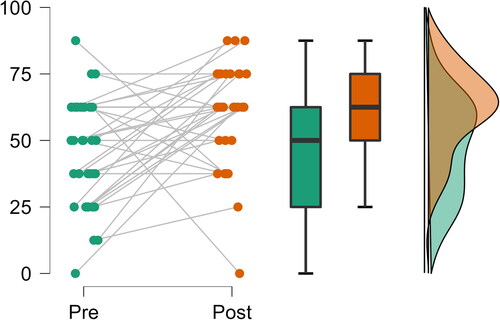
In total, 36 of the 92 students (39%) completed both pre- and post-test assessments and were approved by parents/guardians to have their data included in this study. Differences between the pre- and post-tests by student were found to be statistically significant using Wilcoxon signed rank test for paired samples (W = 79.5, p = 0.005). The pretest had a mean score of around 46% (standard deviation of 20.3) while the post-test had a mean score of slightly above 60% (standard deviation of 18.4). confirms the lower test scores in the pretest compared to the post-test.
Figure 8. Raincloud plot comparing student performance between pre- and post-tests.
When considering student performance by question, results indicate improvements in all but one question (see with results reported as percent correct for individual questions). Questions 1–4 address content covered toward the beginning of the academic year while questions 5–8 focused on the topographic map concepts emphasized throughout the entirety of the project period. Questions 1–3 assessed students’ knowledge of the global grid and showed improvement for each from 22% for questions 1–2 and 13% for question 3. These improvements are impressive given that we did not dedicate as much time to these concepts as others throughout the project. Question 4 emphasized cartographic symbolization on topographic maps with students increasing percent correct from 61% in the pretest to 78% in the post-test. Consistent exposure to these maps throughout the project (regardless of the activity on a given day) likely helped improve students’ comfort level in using maps as well as their knowledge of symbols used on said maps. Question 5 asked about contour intervals, which students noticeably struggled with when it was introduced. Students’ performance improved in this case but only by 6%. Question 6, that asked for approximate elevations at specific locations on a topographic map, showed a slight decrease in student performance from 32% correct in the pretest to 31% correct in the post-test. Question 7 is the same type of query but at a different location, which in this case students improved from 31% correct to 38% correct. Given their performance on question 7, the results from question 6 are perplexing. However, we did notice students struggling to differentiate peaks and valleys on the maps we worked with during regular meetings, which likely led to confusion on one of these questions. Question 8, though, showed the largest positive difference (24%), and it focused on determining the steepest slope. We expect that question 8 showed the greatest improvement because it assessed students’ ability to perceive 3D landscapes from 2D topographic maps, which was honed through weeks of hands-on activity with Play-Doh® and LEGO®.
Table 2. Pre- and post-test results by question (n = 36).
Qualitative findings: Reflections from participants
In aggregate, students enjoyed the learning experience offered in this project. Students were consistently prompted to write about their experiences (e.g., what did you learn? what did you enjoy about this week activity?). One student stated: “I learned about making contour maps, and enjoyed the play-dough activities about making them.” Another noted: “What I learned about contour maps is that they are easy to use when learning how steep a mountain or hill is. One thing I learned about drones is that their [sic] not so easy to use and they are hard to build.” In this way, several students reflected a more nuanced understanding of topographic maps than they would have prior to the project. For instance, “I learned that with the contour maps they may look easy to do but you have to take time and do it right and check over it multiple times to see if you have that area mapped out right.” Another reflected: “One thing I learned about creating maps is that it takes a lot of details and hard work to do.”
Upon completion of the project, the classroom teacher (third author) summarized the experience:
“This project allowed students to engage in a variety of hands-on activities that deepened their knowledge of spatial thinking. The contour mapping instruction helped to illustrate concepts that often were too abstract for students to understand when taught in a conventional method. I watched students move from a very novice understanding, to being able to create a 3D landform out of Play-Doh® or LEGO®s based on a 2D contour map. Not only were students fully engaged, but they were conversing in a manner that showed deeper understanding of the process. Due to the current pandemic, students did not have a chance to complete our project. We had just laid the classroom groundwork to begin the actual project with our local park. However, even without the capstone part of the project, students gained valuable knowledge.”
Discussion
Students reacted positively to the activities introduced in the classroom throughout the duration of the project. We found a variety of activities was vital for consistent engagement over time. Further, the more hands-on the activity, the better the engagement within class periods. In particular, the Play-Doh® and LEGO® activities were especially appealing for students over multiple meetings. Recognizing the limitation of our small respondent group due to not being able to obtain parental/guardian consent or students not completing both the pretest and post-test, overall, we observed improved understanding of the topics covered during the project that were then later confirmed with the pre- and post-test comparison. Compared with other studies in geography education, the improvements in test scores we observed are similar (e.g., Petty and Rule Citation2008; Goldstein and Alibrandi Citation2013). We do also recognize that we need to improve our activities and teaching in some areas where scores either decreased from pretest to post-test or did not change significantly. Specifically, we expected some pre-/post-test score improvements to be higher (questions 6 and 7 especially) given the extensive amount of time we spent working with topographic maps.
Importantly, we explicitly point out that our approach to this project incorporated a slew of active learning methods over the course of nearly an entire academic year to cover content. In this way, and in regard to geography education research, this project encompassed all four active learning areas proposed by Bednarz, Heffron, and Huynh (Citation2013): problem-based learning, collaborative learning, geospatial technologies, and active engagement with data. Following this conceptualization, we suggest strategically interweaving and integrating active teaching and learning approaches from all four areas to create an open and encouraging learning environment for students that brings a fun factor to every meeting. In our case, we instituted activities ranging from problem-based and collaborative learning focused on discussion of sustainability issues at a local park, to use of drones as a geospatial technology to engage students with data to model a 3D landscape with hands-on materials.
Hands-on activities enable classroom ‘fun’ that we learned was increasingly important as the school year progressed. Students struggled at times with more traditional approaches to learning (i.e., lecture, discussion). In our case, the students were aware when project days were scheduled (and viewed it as special compared to regular school days), which led to excited expectation of active learning and therefore made it difficult to integrate more traditional approaches (i.e., lecture). In this way, we responded by emphasizing these approaches through hands-on activities (more so than was originally planned). Managing this excitement was challenging at times, which attested to the importance of having a highly experienced classroom teacher on the project. We encountered additional obstacles in using the FlyBrix drone kits. Building the kits, for most students, was not difficult and we could easily help student who did struggle, but flying the drones was not as straightforward. The FlyBrix drones are difficult to fly even for an experienced remote pilot (which one of the authors is). Incorporation of other more easy-to-fly drones (i.e., DJI Tello) is one way around this. Further, managing the class as multiple students are attempting to fly the drones (as well as providing adequate space between units so remote controls do not interfere with each other) required help from interested graduate and undergraduate students.
Bednarz and van der Schee (Citation2006) stress that teachers have interest in geospatial technologies, specifically GIS, to support their instruction (also, see Curtis Citation2020). Through working with one teacher directly (and other teachers and administrators indirectly), our study confirms this excitement about geospatial technology and how it can help to engage students, although we focused specifically on drones. There are many challenges (e.g., time, educational background, ongoing training/professional development, access to technology and related resources, curricular constraints, etc.) associated with adoption of geospatial technology by K-12 educators (Kerski Citation2003; Bednarz and Bednarz Citation2004; Doering and Veletsianos Citation2008; Osborne et al. Citation2020). Support from colleagues in higher education can alleviate such issues but efforts must be consistent, mutually beneficial, and long-term to have meaningful impact (Moreno Citation2005; Knowlton et al. Citation2015; Collins and Mitchell Citation2019). Time constraints in both K-12 and higher education certainly do not encourage such collaboration (see Hall-Wallace and Regens Citation2003). However, assembling a team of highly interested partners from higher education and K-12 isn’t impossible. In our case, we (two university faculty members and a K-12 teacher) collaboratively met outside of school hours to create lesson plans throughout the duration of the project. So, we cannot understate the importance of equal partnership to successfully execute projects like these (see Hammond et al. Citation2019). From the perspective of higher education though, projects such as these provide ample opportunities for graduate students or education-interested undergraduate students to engage with young learners, which can be highly beneficial to both. From K-12, we were fortunate to have full support of this project from school administration, which is vital to the success of such efforts. Unfortunately, in not being able to complete the academic year, we did not engage with the broader community in this project but would highly suggest for others to do so. Community-based or community-focused projects such as these provide ideal opportunities to capture the interest of and to better engage with students (see Schlemper et al. Citation2019).
Future work should focus on developing modules (including downloadable lesson plans, activity sheets, etc.) for adoption elsewhere. We also think more pre-/post-tests in additional classrooms to test the approach more broadly as well as incorporating control groups for comparison. That said, this project required significant time investment and commitment from all parties involved (e.g., the school, teacher, students, faculty), which makes continued efforts challenging. In future iterations, we plan to incorporate several formative assessments throughout the project period (instead of a predominantly summative approach). Additionally, collecting and analyzing more qualitative data (e.g., comments/open-ended responses, surveys, interviews) might provide a more comprehensive view of what students learned, what methods were considered most effective, and how they perceived the overall experience. Further, expanding this project to several teachers/classrooms (either within one school or across several) with and without direct involvement from university faculty would provide opportunities to examine the teacher perspective (i.e., how do these activities support classroom learning as opposed to more traditional methods, how might activities be altered to different grade levels, how does use of geospatial technology impact teachers’ future instruction, etc.). Importantly, educator exposure to geospatial technology is associated with its adoption and continued use (Osborne et al. Citation2020), which could be examined in a more long-term study.
Conclusion
This study aimed to improve middle school social studies students’ understanding of basic geographic concepts including topographic maps by implementing a variety of hands-on activities along with drones in the classroom in biweekly meetings from September 2019 through the end of February 2020. Student performance from a pretest to a post-test showed statistically significant improvement. Findings reinforce the results of previous research that report that hands-on, student-centered activities along with geospatial technologies enhance student learning.
Acknowledgments
We thank the students at Comstock Public Schools that worked with us throughout this project. We learned a great deal from you and appreciate your interest in geography. We further appreciate the support for the project provided by the Comstock Public Schools administration and staff as well as the Comstock Township. We thank the following individuals for helping the efforts at the school: Claire Gilbert, Kevin Haynes, Timothy Hawthorne, Jeff Sloan, and Emily Stewart.
Disclosure statement
No potential conflict of interest was reported by the authors.
Additional information
Funding
References
- Afari, E., and M. S. Khine, the Petroleum Institute, Abu Dhabi, UAE. 2017. Robotics as an educational tool: Impact of Lego mindstorms. International Journal of Information and Education Technology 7 (6):437–42. doi: 10.18178/ijiet.2017.7.6.908.
- Anewalt, K., and J. Polack. 2018. Playing to learn: Using hands-on activities to boost learning in computer science. Proceedings of the 49th ACM Technical Symposium on Computer Science Education (SIGCSE ‘18), 1052. doi: 10.1145/3159450.3162373.
- Atit, K., S. M. Weisberg, N. S. Newcombe, and T. F. Shipley. 2016. Learning to interpret topographic maps: Understanding layered spatial information. Cognitive Research: Principles and Implications 1 (1):2. doi: 10.1186/s41235-016-0002-y.
- Baker, T. R., and S. H. White. 2003. The effects of G.I.S. on Students’ attitudes, self-efficacy, and achievement in middle school science classroom. Journal of Geography 102 (6):243–54. doi: 10.1080/00221340308978556.
- Bednarz, R. S., and S. W. Bednarz. 2004. Geography education: The glass is half full and it’s getting fuller. The Professional Geographer 56 (1):22–7. doi: 10.1111/j.0033-0124.2004.05601004.x.
- Bednarz, S. W. 1999. Fieldwork in K-12 geography in the United States. International Research in Geographical and Environmental Education 8 (2):164–70. doi: 10.1080/10382049908667604.
- Bednarz, S.W., S. Heffron, and N.T. Huynh. (Eds.). 2013. A road map for 21st century geography education: Geography education research (A report from the Geography Education Research Committee of the Road Map for 21st Century Geography Education Project). Washington, DC: Association of American Geographers.
- Bednarz, S. W., and J. van der Schee. 2006. Europe and the United States: The implementation of geographic information systems in secondary education in two contexts. Technology, Pedagogy and Education 15 (2):191–205. doi: 10.1080/14759390600769573.
- Boland, J. 2011. Incr-EDIBLE! Making—And Baking—“Landscakes”. The Geography Teacher 8 (1):33–6. doi: 10.1080/19338341.2011.546723.
- Carnahan, L., M. J. Pankratz, and H. Alberts. 2014. Teaching physical geography with toys, household items, and food. The Geography Teacher 11 (3):93–107. doi: 10.1080/19338341.2014.945608.
- Carrera, C. C., and L. A. B. Asensio. 2017. Augmented reality as a digital teaching environment to develop spatial thinking. Cartography and Geographic Information Science 44 (3):259–70. doi: 10.1080/15230406.2016.1145556.
- Carrera, C. C., J. L. S. Perez, J. de la, and T. Cantero. 2018. Teaching with AR as a tool for relief visualization: Usability and motivation study. International Research in Geographical and Environmental Education 27 (1):69–84. doi: 10.1080/10382046.2017.1285135.
- Carswell, J. B. 1970. Children’s abilities in topographic map reading. Paper presented at ‘A Symposium on the Influence of the Map User on Map Design’, Queen’s University, Kingston, Ontario, Canada. https://files.eric.ed.gov/fulltext/ED043557.pdf.
- Carswell, J. B. 1971. The role of the user in the map communication process: Children’s abilities in topographic map reading. Cartographica: The International Journal for Geographic Information and Geovisualization 8 (2):40–5. doi: 10.3138/UV32-7523-G562-JKJ4.
- Carter, G., M. Cook, J. C. Park, E. N. Wiebe, and S. M. Butler. 2008. Middle grade students’ interpretations of contour maps. School Science and Mathematics 108 (2):71–9. doi: 10.1111/j.1949-8594.2008.tb17806.x.
- Cliffe, A. D. 2019. Evaluating the introduction of unmanned aerial vehicles for teaching and learning in geoscience fieldwork education. Journal of Geography in Higher Education 43 (4):582–98. doi: 10.1080/03098265.2019.1655718.
- Collins, L., and J. T. Mitchell. 2019. Teacher training in GIS: What is needed for long-term success? International Research in Geographical and Environmental Education 28 (2):118–35. doi: 10.1080/10382046.2018.1497119.
- Coughlin, P. K. 2010. Making field trips count: Collaborating for meaningful experiences. The Social Studies 101 (5):200–10. doi: 10.1080/00377990903498431.
- Curtis, M. 2020. Toward understanding secondary teachers’ decisions to adopt geospatial technologies: An examination of Everett Rogers’ diffusion of innovation framework. Journal of Geography 119 (5):147–58. doi: 10.1080/00221341.2020.1784252.
- Degner, K. 2022. The importance of play in middle school mathematics. Mathematics Teacher: Learning and Teaching PK-12 115 (2):131–8. doi: 10.5951/MTLT.2021.0215.
- Doering, A., and G. Veletsianos. 2008. An investigation of the use of real-time, authentic geospatial data in the K–12 classroom. Journal of Geography 106 (6):217–25. doi: 10.1080/00221340701845219.
- Elkins, L. 2012. Contour mapping with playdough. Accessed January 20, 2023. https://serc.carleton.edu/NAGTWorkshops/intro/activities/67200.html.
- Favier, T. T., and J. A. van der Schee. 2014. The effects of geography lessons with geospatial technologies on the development of high school students’ relational thinking. Computers & Education 76:225–36. doi: 10.1016/j.compedu.2014.04.004.
- Fokides, E., D. Papadakis, and V. Kourtis-Kazoullis. 2017. To drone or not to drone? Results of a pilot study in primary school settings. Journal of Computers in Education 4 (3):339–53. doi: 10.1007/s40692-017-0087-4.
- Fombuena, A. 2017. Unmanned aerial vehicles and spatial thinking: Boarding education with geotechnology and drones. IEEE Geoscience and Remote Sensing Magazine 5 (3):8–18. doi: 10.1109/MGRS.2017.2710054.
- Fuller, I., S. Rawlinson, and R. Bevan. 2000. Evaluation of student learning experiences in physical geography fieldwork: Paddling or pedagogy? Journal of Geography in Higher Education 24 (2):199–215. doi: 10.1080/713677388.
- Giorgis, S., N. Mahlen, and K. Anne. 2017. Instructor-led approach to integrating an augmented reality sandbox into a large-enrollment introductory geoscience course for nonmajors produces no gains. Journal of Geoscience Education 65 (3):283–91. doi: 10.5408/17-255.1.
- Goldstein, D., and M. Alibrandi. 2013. Integrating GIS in the middle school curriculum: Impacts on diverse students’ standardized test scores. Journal of Geography 112 (2):68–74. doi: 10.1080/00221341.2012.692703.
- Hall-Wallace, M., and N. L. Regens. 2003. Building university-school partnerships: An exercise in communication and understanding. Journal of Geoscience Education 51 (1):96–103. doi: 10.5408/1089-9995-51.1.96.
- Hammond, T., A. Bodzin, K. Popejoy, D. Anastasio, B. Holland, and D. Sahagian. 2019. Shoulder to shoulder: Teacher professional development and curriculum design and development for geospatial technology integration with science and social studies teachers. Contemporary Issues in Technology and Teacher Education 19 (2):279–301.
- Harnapp, V., and D. King. 1991. A new look at making raised-relief maps in the classroom. Journal of Geography 90 (5):241–4. doi: 10.1080/00221349108979309.
- Henry, P., and H. Semple. 2012. Integrating online GIS into the K–12 curricula: Lessons from the development of a collaborative GIS in Michigan. Journal of Geography 111 (1):3–14. doi: 10.1080/00221341.2011.549237.
- Hodgson, M. E., and S. E. Piovan. 2022. An indoor landscape for instruction of 3-D aerial drone imagery. Journal of Geography in Higher Education 46 (1):145–59. doi: 10.1080/03098265.2021.1900084.
- Hsu, H.-P., B.-W. Tsai, and C.-M. Chen. 2018. Teaching topographic map skills and geomorphology concepts with Google Earth in a one-computer classroom. Journal of Geography 117 (1):29–39. doi: 10.1080/00221341.2017.1346138.
- Huntoon, J. E., G. J. S. Bluth, and W. A. Kennedy. 2001. Measuring the effects of a research-based field experience on undergraduates and K-12 teachers. Journal of Geoscience Education 49 (3):235–48. doi: 10.5408/1089-9995-49.3.235.
- Ishikawa, T., and K. A. Kastens. 2005. Why some students have trouble with maps and other spatial representations. Journal of Geoscience Education 53 (2):184–97. doi: 10.5408/1089-9995-53.2.184.
- Jadallah, M., A. M. Hund, J. Thayn, J. G. Studebaker, Z. J. Roman, and E. Kirby. 2017. Integrating geospatial technologies in fifth-grade curriculum: Impact on spatial ability and map-analysis skills. Journal of Geography 116 (4):139–51. doi: 10.1080/00221341.2017.1285339.
- Jarrett, O. S., and P. Burnley. 2010. Lessons on the role of fun/playfulness from a geology undergraduate summer research program. Journal of Geoscience Education 58 (2):110–20. doi: 10.5408/1.3534844.
- Johnson, E. T., and K. S. McNeal. 2022. Student perspectives of the spatial thinking components embedded in a topographic map activity using an augmented-reality sandbox. Journal of Geoscience Education 70 (1):13–24. doi: 10.1080/10899995.2021.1969862.
- Joyce, K. E., N. Meiklejohn, and P. C. H. Mead. 2020. Using minidrones to teach geospatial technology fundamentals. Drones 4 (3):57. doi: 10.3390/drones4030057.
- Jet Propulsion Laboratory. 2023. Classroom activity: Mapping alien worlds. Accessed January 20, 2023. https://www.jpl.nasa.gov/edu/teach/activity/mapping-alien-worlds/.
- Jurmu, M. 2015. Incorporating an introductory service-learning experience in a physical geography course. Journal of Geography 114 (2):49–57. doi: 10.1080/00221341.2014.918638.
- Keiper, T. A. 1999. GIS for elementary students: An inquiry into a new approach to learning geography. Journal of Geography 98 (2):47–59. doi: 10.1080/00221349908978860.
- Kennedy, K., and L. Archambault. 2012. Design and development of field experiences in K-12 online learning environments. The Journal of Applied Instructional Design 2 (1):35–49.
- Kerski, J. J. 2003. The implementation and effectiveness of geographic information systems technology and methods in secondary education. Journal of Geography 102 (3):128–37. doi: 10.1080/00221340308978534.
- Knowlton, S., J. Fogleman, F. Reichsman, and G. de Oliveira. 2015. Higher education faculty collaboration with K-12 teachers as a professional development experience for faculty. Journal of College Science Teaching 044 (04):46–53. doi: 10.2505/4/jcst15_044_04_46.
- Liben, L. S., and S. J. Titus. 2012. The importance of spatial thinking for geoscience education: Insights from the crossroads of geoscience and cognitive science. In Earth and Mind II: A Synthesis of Research on Thinking and Learning in the Geosciences, ed. K.A. Kastens and C.A. Manduca. Boulder, CO: Geological Society of America. ISBN: 9780813724867
- Mathews, A. J., and A. E. Frazier. 2017. Unmanned Aerial Systems (UAS). In The Geographic Information Science & Technology Body of Knowledge, ed. J.P. Wilson. 2nd Quarter, 2017 ed. Ithaca, NY: University Consortium for Geographic Information Science. doi: 10.22224/gistbok/2017.2.4.
- Mathews, A. J. 2021. Structure from motion (SfM) workflow for processing drone Imagery. In Fundamentals of Capturing Processing Drone Imagery and Data, ed. A.E. Frazier and K.K. Singh, 91–102. Boca Raton, FL: CRC Press/Taylor & Francis Group.
- McKee, T., and L. Hashemi-Beni. 2020. Developing geospatial scientists – Using students as partners in drone research. The International Archives of the Photogrammetry, Remote Sensing and Spatial Information Sciences XLIV-M-2-2020:69–72. doi: 10.5194/isprs-archives-XLIV-M-2-2020-69-2020.
- McNeal, K. S., K. Ryker, S. Whitmeyer, S. Giorgis, R. Atkins, N. LaDue, C. Clark, N. Soltis, and T. Pingel. 2020. A multi-institutional study of inquiry-based lab activities using the Augmented reality sandbox: Impacts on undergraduate student learning. Journal of Geography in Higher Education 44 (1):85–107. doi: 10.1080/03098265.2019.1694875.
- Milson, A. J., L. M. DeChano, R. L. Bunch, J. Caito, and X. Qiu. 2005. GIS in K-12 education: Pedagogical tool or weapon of mass distraction. Research in Geographic Education 7:62–73.
- Milson, A.J., and M. Alibrandi. (Eds). 2008. Digital geography: Geospatial technologies in the social studies classroom. Charlotte, NC: Information Age Publishing. ISBN: 9781593116736
- Milson, A.J., M. Alibrandi, and J.J. Kerksi. (Eds). 2011. International perspectives on teaching and learning with GIS in secondary schools. New York, NY: Springer. ISBN: 9789400721197
- Moreno, N. 2005. Points of view: Effective partnerships between K-12 and higher education. Cell Biology Education 4 (1):30–2. doi: 10.1187/cbe.04-11-0050.
- Osborne, Z. M., S. L. van de Gevel, M. A. Eck, and M. Sugg. 2020. An assessment of geospatial technology integration in K-12 education. Journal of Geography 119 (1):12–21. doi: 10.1080/00221341.2019.1640271.
- Parece, T. A., and H. R. Aspaas. 2007. Reedy creek cleanup: The evolution of a university geography service-learning project. Journal of Geography 106 (4):153–61. doi: 10.1080/00221340701658794.
- Petrasova, A., B. Harmon, V. Petras, P. Tabrizian, and H. Mitasova. 2018. Tangible modeling with open source GIS. 2nd ed. New York, NY: Springer. ISBN: 9783319893020
- Petty, M. R., and A. C. Rule. 2008. Effective materials for increasing young children’s spatial and mapping skills. Journal of Geoscience Education 56 (1):5–14. doi: 10.5408/1089-9995-56.1.5.
- Raath, S., and A. Golightly. 2017. Geography education students’ experiences with a problem-based learning fieldwork activity. Journal of Geography 116 (5):217–25. doi: 10.1080/00221341.2016.1264059.
- Rapp, D. N., S. A. Culpepper, K. Kirkby, and P. Morin. 2007. Fostering students’ comprehension of topographic maps. Journal of Geoscience Education 55 (1):5–16. doi: 10.5408/1089-9995-55.1.5.
- Rodyenko, P. 1958. A three-dimensional model illustrates reading relief by contour lines. Journal of Geography 57 (2):78–83. doi: 10.1080/00221345808983299.
- Rule, A. C., L. E. Graham, S. Kowalski, and M. Harris. 2006. Learning Landform vocabulary through different methods: Object boxes, sand and dough creations, or puppet plays. Journal of Geoscience Education 54 (4):515–25. doi: 10.5408/1089-9995-54.4.515.
- Schlemper, M. B., B. Athreya, K. Czajkowski, V. C. Stewart, and S. Shetty. 2019. Teaching spatial thinking and geospatial technologies through citizen mapping and problem-based inquiry in grades 7–12. Journal of Geography 118 (1):21–34. doi: 10.1080/00221341.2018.1501083.
- Soltis, N. A., K. S. McNeal, R. M. Atkins, and L. C. Maudlin. 2020. A novel approach to measuring student engagement while using an augmented reality sandbox. Journal of Geography in Higher Education 44 (4):512–31. doi: 10.1080/03098265.2020.1771547.
- Spronken-Smith, R., J. O. Bullard, W. Ray, C. Roberts, and A. Keiffer. 2008. Where might sand dunes be on Mars? Engaging students through inquiry-based learning in geography. Journal of Geography in Higher Education 32 (1):71–86. doi: 10.1080/03098260701731520.
- Williams, R. D., S. Tooth, and M. Gibson. 2017. The sky is the limit: Reconstructing physical geography from an aerial perspective. Journal of Geography in Higher Education 41 (1):134–46. doi: 10.1080/03098265.2016.1241986.
- Woods, T. L., S. Reed, S. Hsi, J. A. Woods, and M. R. Woods. 2016. Pilot study using the augmented reality sandbox to teach topographic maps and surficial processes in introductory geology labs. Journal of Geoscience Education 64 (3):199–214. doi: 10.5408/15-135.1.
- Yang, B., T. L. Hawthorne, M. Hessing-Lewis, E. J. Duffy, L. Y. Reshitnyk, M. Feinman, and H. Searson. 2020. Developing an introductory UAV/drone mapping training program for seagrass monitoring and research. Drones 4 (4):70. doi: 10.3390/drones4040070.
- Yilmaz, M., J. Ren, S. Custer, and J. Coleman. 2010. Hands-on summer camp to attract K–12 students to engineering fields. IEEE Transactions on Education 53 (1):144–51. doi: 10.1109/TE.2009.2026366.