
 ?Mathematical formulae have been encoded as MathML and are displayed in this HTML version using MathJax in order to improve their display. Uncheck the box to turn MathJax off. This feature requires Javascript. Click on a formula to zoom.
ABSTRACT
This meta-analysis assesses the predictive validity of the Graduate Record Examination (GRE) across outcome variables, including grade point average, for graduate students. In addition to aggregate effects, this paper also assessed changes in observed effects over time as related to increasing diversity in the graduate student population and as a function of gender and racial/ethnic composition of study samples. Framed using a lens of critical whiteness, this analysis examined n = 1,659 individual effects across k = 201 studies. Overall, 62.3% of reported effects were nonsignificant (i.e. no predictive value of GRE scores on student outcomes). Further, the magnitude of observed predictive relationships decreased significantly over time. The aggregate mean effect across all studies and outcomes was small, significant, and positive: GRE score predicted 3.24% of variance across measured outcomes, 4% of variance in overall GPA, and 2.56% of variance in first-year graduate GPA. Sample composition effects by race/ethnicity were notable under some conditions, but nonsignificant, with increasing proportions of people of Color within a study sample associated with poorer predictive validity for GPA. Likewise, the magnitude of negative effects where lower GRE scores predicted stronger student outcomes showed increasing trends from 0.16% of variance for all-white samples to 7.3% for samples comprised entirely of people of Color.
The Graduate Record Examination (GRE) has a long history of use as a selection tool in admissions decisions for graduate programs. Introduced in 1949 and substantially revised in 2002, several meta-analyses of its predictive validity have found small to moderate, positive correlations between scores and graduate first-year and cumulative grade point average (GPA) (0.20 ≤ r ≤ 0.36) (e.g., Goldberg & Alliger, Citation1992; Kuncel et al., Citation2001, Citation2010; Morrison & Morrison, Citation1995). Kuncel and colleagues also found GRE predictive validity evidence for comprehensive examination scores, time to degree, degree attainment, publication citation counts, and faculty ratings of student performance (0.08 ≤ r ≤ 0.41). However, a more recent study (C. W. Miller et al., Citation2019) found in a large-scale study of Ph.D. matriculants in physics across 24 programs that the predictive power of GRE scores for successful degree completion was zero or near-zero. Similarly, Goldberg and Alliger’s meta-analysis suggested that, after accounting for undergraduate GPA, GRE accounted for no unique variance in student outcomes.
These conflicting findings regarding the predictive validity of the GRE hold substantial implications that extend beyond the basic question of whether or not GRE scores provide a meaningful basis to inform graduate admissions decisions. In addition to data indicating that the GRE does not yield equitable scores for women, people of Color, and people from low-income backgrounds (Educational Testing Service [ETS], Citation2019; C. Miller & Stassun, Citation2014), simply requiring GRE scores for application can suppress the number of people of Color who apply to graduate school. Wolf (Citation2014) reported a 50% reduction in graduate program applications from Black applicants in the two years following the introduction of required GRE scores, despite the demographic distribution and qualifications of prospective applicants in the multi-institution admissions pool remaining unchanged from previous years.
Another concerning finding in the literature is the significant negative correlation that GRE scores can have with desired outcomes. For instance, Petersen et al. (Citation2018) found that students with higher GRE scores were significantly more likely to depart graduate study before completing a degree. Likewise, Kuncel et al. (Citation2001) reported that higher quantitative GRE subscores were associated with longer times to degree. Accordingly, consideration of GRE use in admissions is more complicated than many anticipate, because modest predictive validity must be balanced against both 1) application deterrence effects experienced by qualified minoritized individuals and 2) potential negative relationships that run counter to the anticipated predictive value of the GRE.
The role of the GRE in the diversification of the professoriate
These findings are particularly salient in light of efforts to diversify the professoriate (Griffin, Citation2020). Currently, only 11% of university faculty in the United States identify as Black, Latinx, or Indigenous (National Center for Education Statistics, Citation2019), and fewer than 25% of students enrolled in doctoral education identify as members of racially minoritized groups (Okahana & Zhou, Citation2018). However, the 2019 Survey of Earned Doctorates reports very similar rates of postgraduation commitments of employment within the academy across those groups (43.4% − 47.1%; 46.5% of white graduates) (National Center for Science and Engineering Statistics, Citation2020). Thus, a clear path toward developing a professoriate more reflective of the population of students it serves is to increase the number of individuals from historically marginalized communities matriculating into doctoral study. Yet, doctoral admissions processes often entail perspectives on merit that are exclusionary of people of Color — especially with regard to the relevance of GRE scores (J. R. Posselt, Citation2014, Citation2015). Further, ETS (Citation2021, p. 14) itself suggests that “performance differences can be the result of a number of factors, such as … economic and social systems in which everyone does not receive equal opportunity.”
In 1980, 72.4% of all respondents to the Survey of Earned Doctorates were white and 69.7% were male. In contrast, 2020 data indicate that only 44.7% are white and 54.7% are male. Because the validity of any measure is contingent on the composition of the sample with which it is used, static assumptions about the ability of a test to yield information of equivalent quality as populations change are untenable (Messick, Citation1995). Thus, a salient but underexplored factor in the interpretation of GRE predictive validity studies is that the diversity of the applicant pool and matriculants continues to change over time. Despite ongoing underrepresentation and lack of equity in the graduate education pipeline (DeAngelo et al., Citation2021; Griffin, 2019), it is clear that the population of graduate students has become substantially more diverse over time. However, the most recent meta-analytic data set in the published literature does not include studies published after 2006 (Kuncel et al., Citation2014), and no meta-analysis to date has considered changes in effects over time, by race/ethnicity, or by gender. This raises the following question: Does the predictive validity of the GRE vary in response to increasing diversity over time in the graduate student body?
To address this question, we conducted a meta-analysis that expands the relevant knowledge base by 1) including the past 15 years of studies, which have not been included in any meta-analyses to date and 2) directly testing the hypothesis that the shifting demographics of the graduate student population may account for diminishing predictive validity of the GRE for desirable graduate outcomes, including first-year graduate GPA, cumulative graduate GPA, course grades, time to degree, degree attainment, performance on professional certification exams taken after completion of the graduate degree, and scholarly publication rates both during and after attainment of a graduate degree.
Theoretical framework
We approached this work using the lens of critical whiteness to extend the basic concept of measurement validity. Central to this perspective is a need to critically evaluate the assumptions underlying the development, history, and use of standardized testing as normative practices purported to be “objective” or “colorblind.” Test validity traditionally refers to the extent to which a test measures the underlying construct it is supposed to measure based on evidence for five interrelated components: test content, response processes, internal structure, relations to other variables, and consequences of testing (American Educational Research Association, American Psychological Association, and National Council of Measurement in Education, Citation2014). However, it fails to take into account, on its own, the ways in which systemic racism and the imposition of a deficit mind-set disenfranchise communities of Color through the use of measurement instruments that are built on histories of racism and interpreted within an artificial norm of white privilege (Au, Citation2013; J. Helms, Citation2002).
Whiteness
Critical whiteness recognizes that racism is both a historic and a current reality, permeating every aspect of society and experience. The structures of social networks, services, and systems, and the ways in which they are experienced, are defined by race. These structures function by design to benefit white people and support whiteness. Hawkman (Citation2020) describes whiteness as:
An ever-shifting, hierarchical, hegemonic power structure and identity construct that informs the ways individuals view themselves and society and is predicated on dehumanizing the racial other … . Whiteness has also been described as the water in which white people swim … . It is all around them, keeping them afloat. (p. 404)
Part of the insidious nature of whiteness is its invisibility to its beneficiaries, wherein the white privilege exercised permits the assumed right to define normalcy and expectations. By imposing an assumption of direct comparability that is neither legitimated nor empirically supported, whiteness permits the setting of standards predicated on conformity to a set of norms that society’s structure inherently prevents. Part of this dehumanization is the definition of whiteness as synonymous with artificial normalcy (Mohajeri, Citation2021). The assumptions that underlie whiteness span many forms of oppression, including gender, sexuality, social class, and disability, yielding a power structure that positions individuals from nonwhite, non-male, and intersectional identity groups as outside a meritorious norm (Stewart & Nicolazzo, Citation2018). Societal services, including education, were designed and structured to reinforce systems of power that overtly and covertly benefit white communities at the expense and exploitation of communities of Color (Patton, Citation2016). Racism and systemic uplifting of whiteness is so pervasive within educational structures that many often fail to see its ubiquitous shaping of everyday understandings of normalized standards and merit.
Early education and sociological theorists argued for theories of “cultures of poverty,” in which communities of Color were seen to be lacking normative practices, culture, and morals that supported educational success. In short, their central claims invoke “a pathological set of behaviors exists for Black people/people of Color that sets us apart from ‘the American mainstream’” (Akom, Citation2008, p. 206). In K-12 education, for example, decades of research and policymaking efforts targeting the “achievement gap” attempted to close a perceived ability and success gap between students of Color and their white counterparts. However, white students were not the highest performers; the highest achieving group was students of Asian descent. Yet, these efforts never focused on helping white students perform as well as their Asian counterparts, but instead on helping Black students achieve comparably with white students (Sperling et al., Citation2017). In this way, white students were understood as the de facto reference group, independent of the realities of achievement differences across racial groups. Likewise, this deficit perspective manifests at the postsecondary level (Bensimon, Citation2005). Today, many scholars have reframed their understanding of student achievement to focus on the opportunity gap rather than an achievement gap, because the latter tacitly places responsibility on students of Color as individuals independent of context and systemic impacts rather than bringing to light the structural inequities, which limit the opportunities and resources allocated to the education of communities of Color.
Similarly, the construction of meritocracy as a concept in the process of college admissions presents itself as an arbitrary construction whose definition shifts over time to preserve white students as benchmarks of intellectual merit (Feagin, Citation2010; Karabel, Citation2005). As summarized by Cabrera et al. (Citation2017, pp. 62–63; see also Samson, Citation2013), “when Whites are pitted against Blacks only, they tend to prefer placing a premium on [test] scores and grades. When the competition includes Asians, they tend to downplay the relevance of test scores and grades in defining merit.” Indeed, the original construction of standardized tests as a genre was the product of eugenicist efforts to create allegedly objective measures of nonspecific psychological traits that could predict academic performance within schools both attended and taught by affluent whites (Patton, Citation2016). This pattern often persists with graduate admissions, where admissions committees can rely on the GRE as a metric through which to screen out applicants whose hypothetical underperformance would reflect negatively on (mostly white) faculty without consideration of differential access to prior learning opportunities or alternative strengths not captured by the test (J. R. Posselt, Citation2014; Posselt, Citation2016).
Validity and fairness
In the present study, we emphasize and comment on two validity evidence components: 1) relationships with other variables (i.e., test-criterion relationships) and 2) consequences of testing (i.e., interpretation and use of test scores intended by the developer versus claims about test use that are not directly based on test score interpretations). For any test, Messick (Citation1980) argues that a key question is whether or not is should be used for the selected purpose, both as a matter of its technical properties and the decisions that will be based on its outcomes, because “there is no guarantee that at any point in time we will identify all of the critical possibilities, especially those unintended side effects that are distal to the manifest testing aims” (p. 1020). This description relates, in many ways, to the intersection between test validity and test fairness. Although test validity is the assessment that a test measures what it is supposed to measure, test fairness (J. E. Helms, Citation2006) is both the direct and indirect assessment of ruling out “construct-irrelevant cultural influences (e.g., cultural beliefs, customs) on test scores” (p. 856), emphasizing the interpretation of such differences as influenced by environmental inequities rather than biological or personal attributes. This definition of test fairness explicitly highlights the opportunity gap rather than the achievement gap as the modality for interpretation of racial and cultural differences on psychological and educational assessments. As noted by Helms:
[U]nless research proves otherwise, racial between-groups differences are likely attributable to racial or cultural constructs for which racial categories serve as proxies or dummy variables. Racial or ethnic cultural factors should not interact with test performance or the test taker’s reactions to the testing situation in such a manner as to advantage members of one group (e.g., Whites) relative to another group (e.g., Blacks) if the test is being used for assessment purposes involving the affected groups. (p. 847)
The intended use of the GRE is to predict first-year graduate GPA (Schneider & Briel, Citation1990; Wilson, Citation1979), yet it is used as a selection criterion for graduate programs that continue for many years beyond first-year coursework. Thus, it is a selection tool — that may or may not show generalizable evidence of validity and/or fairness — used to limit opportunities to enter graduate education. Further, the GRE is assumed to measure the same underlying knowledge constructs for all participants, yet as the academy has diversified, it is unclear whether the GRE is actually a valid and fair test. Presently, ETS (Citation2019) acknowledges that GRE scores are systematically lower for people of Color than they are for white people, yet scores remain a component of graduate admissions (e.g., Tang et al., Citation2022; Verostek et al., Citation2021). The purpose of the present study is to assess the extent to which GRE scores accurately predict student outcomes within graduate education. We assess the extent to which GRE scores predict graduate GPA as well as a robust set of other positive and negative outcomes considered to be indicators of success in graduate study.
The inclusion of non-GPA outcomes offers several advantages. First, GPA is not typically a metric of primary concern in evaluating graduate students either during a program of study or after degree completion, provided that the student is not in danger of failing out of the program (Ellin, Citation2012). Consequently, it is a continuous value representing only a binary construct of importance to most stakeholders (i.e., passing or failing). Conversely, more highly valued outcomes include degree completion, performance on professional licensure examinations, and the acquisitions of field-relevant skills. Second, we can assess the extent to which the relationship between GRE and GPA might be more broadly generalized to infer potential predictive value of the GRE for more valued outcomes that represent success beyond the first year of study. Further, we specifically examine differential test validity, determining whether relationships among GRE scores and outcomes differ across time, gender, and race.
Methods
We began by searching the term “graduate record examination” in six databases: PsycINFO, PubMed, ERIC, JSTOR, WorldCat, and ProQuest Dissertations and Theses. We included articles published in English ranging from the year 1943 to 2022. This search produced 3,036 articles, which was reduced to 2,439 after removing duplicates. The titles and links to papers found in the search were saved to determine whether they met our inclusion criteria. Both peer-reviewed empirical articles and dissertations were included in the study while meta-analyses, commentaries, and literature reviews were excluded. Next, based on abstracts, additional studies were excluded if they were described as intervention studies or studies that did not report a relationship between GRE scores and relevant student outcomes. This set of exclusion criteria yielded 1,298 studies that were selected for full text review. Third, based on the review of the full-text, studies were excluded if they were found to lack GRE scores as an independent variable, failed to report the relationship between GRE scores and a relevant outcome, or did not provide complete information necessary for conversion of the relevant statistic to an r-value, reducing the corpus of considered studies to 221 for further consideration. All articles that met the inclusion criteria were evaluated by a group of 10 raters. As raters read full texts, they checked for inclusion of potentially qualifying studies from manuscript references. If these were not included in the original corpus (n = 2,439), they were added as “snowball” sampling, which yielded 46 additional studies. Due to overlap in testing requirements within and across programs between MCAT and GRE for medical and veterinary programs, as well as their unique status as professional doctorates, studies using exclusively medical or veterinary samples were excluded, reducing the studies for analysis by 59. In a secondary review of studies, when coders were recoding by reliability, it was determined that 7 studies were included that should have been excluded. Removing these 7 studies resulted in the final study sample size of 201. This process is summarized in . Studies examining either master’s or doctoral students were included in the same analysis set, as previous research has found only negligible differences in GRE predictive validity across degree type (Kuncel et al., Citation2010). References for included studies are available online at https://osf.io/awu7c/.
Table 1. Exclusion and Inclusion Criteria Traced from Initial to Final Sample.
Interrater reliability was assessed using a random subset of k = 30 coded articles. Assuming ratio measurement properties for the average effect size per article, Krippendorff’s alpha =.994 across raters for the 30 studies examined. Assuming interval properties instead of ratio properties also yielded a strong Krippendorff’s alpha value of .963.
Articles that met the inclusion criteria were coded according to the coding scheme in . For each effect between the GRE and a student outcome in each article, coders reported the year of publication, names of the independent and dependent variables, percentage of men, percentage of white participants, sample discipline, sample size, the type of estimate evaluated, the specific statistic that was reported, the standardized (or all relevant pieces to calculate a standardized) estimate, directionality of the estimate, and significance of the estimate. Estimates were standardized post hoc for comparability. Total GRE scores as well as analytical, verbal, and quantitative subtests of the GRE were recorded as predictors. Academic success was measured by assorted variables such as graduate grade point average, time to degree completion (reverse-coded), degree completion, course grades, attrition (reverse-coded), faculty ratings, and licensing exams.
Table 2. Coding Sheet for Each Effect per Article.
The 201 studies in the final sample reported 1,659 effects that are included in the present analyses, though sample sizes differ across analyses due to missing effect size or article-level data. Figures were created using the R package ggplot2 (Wickham, Citation2016). Predictive analyses were conducted using the package lme4 (Bates et al., Citation2015), nesting effect sizes appropriately within studies, and using maximum likelihood estimation. We first evaluated intercept-only models to determine the average effect size, adjusting for multiple estimates per article. We then included predictors “year,” “percent of racially minoritized persons,” and “percent of women” to examine effects across time, racial diversity, and gender diversity. Next, we evaluated subgroup analyses across discipline, GRE subsections, and student outcomes. Finally, we evaluated all prior analyses using only studies that reported GPA as the student outcome.
Assessment of outcome independence and publication bias
Independence
The data in this meta-analysis are extensively nested. Individual studies contributed multiple outcomes (m = 14.1), with one study reporting 126 different outcomes. Several approaches in these cases are possible, including aggregating data at the study level or choosing the most relevant outcomes, which retreat from available information. Instead, we chose to empirically test the independence assumption of the data through robust variance estimation (RVE; Hedges et al., Citation2010). Using RVE, we modeled the estimated effect size (r) and tests of heterogeneity (Tau2) under a full range of assumptions in rho increments of 0.2—from all of the variability in effect sizes coming from the study of origin (assumed rho = 0.99), to none coming from the study of origin (assumed rho = 0.00). In all cases there was no change in either estimated effect size (r = 0.152) or tests of heterogeneity (Tau2 = 0.000). As a result, all subsequent analyses use the full set of observed outcomes.
Publication bias
As recommended by Borenstein et al. (Citation2009), we used a combination of approaches to assess publication bias, including visual inspection of a funnel plot and an Egger’s regression test (see Egger et al., Citation1997). The outcomes (see ) were mixed. Visual inspection suggested a slight positive publication bias (with several high standard error and higher than the aggregate r point estimates). Egger’s regression test suggested no significant publication bias (t[1685] = −0.92, p = .36). The volume is substantial enough that looking for a systematic pattern of positive outcomes associated with fundamentally different study designs or contexts is not possible, nor is the removal of outliers.
Figure 1. Funnel plot with Egger’s regression line.
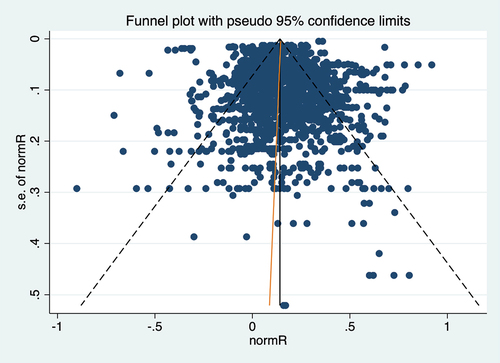
An attempt was made to quantify potential publication bias using a trim and fill analysis. The approach (see Duval & Tweedie, Citation2000) theorizes a population of unobserved outcomes, imputes them, and then runs comparative analyses. In this case, we tested the assumption of missing negative outcomes and then positive outcomes. In both cases, no studies were imputed, suggesting the same lack of publication bias as the Egger’s test. On the basis of these analyses collectively, we infer that the current study approximates the full population of GRE studies.
Results
Descriptive statistics showed that the included studies were conducted between 1957 and 2022. Sample sizes ranged from 6 to 42,193, with a median sample size of 105 and an average sample size of 362 (SD = 1,633). Most studies did not report gender (n = 108) or race/ethnicity (n = 156). Of those that did, the mean percentage of men per study was 40% (median = 38%), and the mean percentage of white participants per study was 62% (median = 74%).
All effects were separated by their positive and negative impact on students, rather than the reported positive or negative values within studies. Overall, 1,376 effects across studies demonstrated positive predictive relationships, while 278 effects had negative relationships, and the remaining effects 5 effects were reported as 0. Approximately 43% of the positive effects (n = 585) and 15% of the negative effect (n = 41) were reported or calculated by the research team given other known information as being statistically significant.
To aid readers familiar with this literature, we will keep subsequent analyses and reporting on the original scales and reported effect sizes. Descriptively, and without adjusting the effect sizes for multiple effects shown within articles, the average correlation between GRE and student outcomes was r = 0.16. Among positive student outcomes, the average unadjusted correlation between GRE and student outcomes was r = 0.21, and among negative student outcomes, the average unadjusted correlation was r = −0.12.
Results of overall effects
Multilevel mixed-effects analyses were used to evaluate fixed effects nested within studies, as shown in equation 1,
Where is the observed effect size variable (a correlation coefficient),
is the intercept,
is the fixed slope of each predictor,
is an observed predictor,
is the level-2 (article-specific) error term, and
is the level-1 (effect size within article) error term. First, a fixed and random intercept-only model was evaluated:
Results from this model showed that the average correlation between GRE scores and student outcomes — when controlling for the nested structure of data where effects were nested within articles — was = .18 (t = 15.79, p < .001). The intraclass correlation was ICC =0.45, suggesting that a moderate amount of variance was shared among multiple effects reported within articles.
A second model incorporated the fixed effect of year, percent racially minoritized, and percent women coded from each effect, nested within studies,
Results showed that effect sizes changed significantly as a function of both year ( = −.0080, t = −4.49, n = 249, p < .001) and percentage of women (
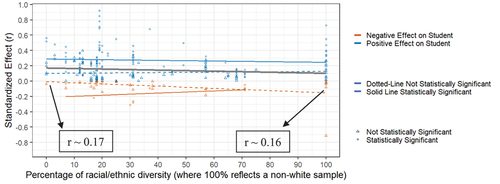
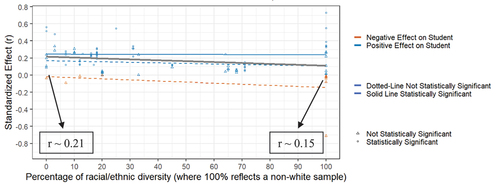
= .0026, t = 3.00, n = 249, p = .003) in the sample, but not percentage of racially minoritized persons (
= .0002, t = 0.32, n = 249, p = .75).Footnote1 Put into context, over time and holding all other variables constant, the adjusted effect among GRE and student outcomes decreased from
= .22 in 1957 to
= .15 in 2022 (p < .001; see for an unadjusted representation). Further, as the percentage of women increased, holding all other variables constant, the effect of GRE on student outcomes increased from
= .11 at 0% women to
= .21 at 100% women (p = .003; see for an unadjusted representation). However, as the percentage of racially minoritized persons within samples increased, the effect of GRE on student outcomes remained constant at and
= .16 (p = .75; see for an unadjusted representation).
Figure 2. Predictive Value of the GRE Over Time, Effects Across Studies.
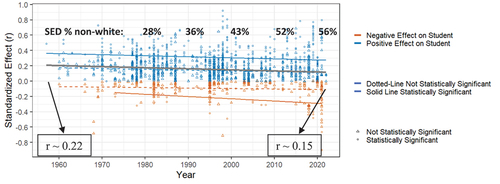
Figure 3. Predictive Value of the GRE Across Gender, Effects Across Studies.
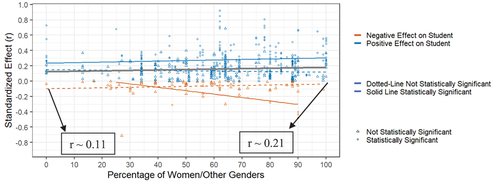
Figure 4. Predictive Value of the GRE Across racially minoritized, Effects Across Studies.
Results of effects by discipline
Overall, n = 653 effects were across psychology, mental health, or counseling samples, n = 142 effects were across non-psychology social science samples (e.g., sociology, criminal justice, political science, library science), n = 174 effects were across education samples, n = 189 effects were across science and engineering samples (e.g., biomedical science, geoscience, engineering, computer or mathematical sciences), n = 90 effects were across applied science samples (e.g., kinesiology, audiology, nursing, agriculture, community health, etc.), n = 48 effects were across humanities and liberal arts samples (e.g., humanities, music, history, English), n = 228 effects were across samples containing students from multiple disciplines, n = 63 effects were across other disciplinary samples (i.e., business, home economics, architecture), and n = 72 effects were from samples that did not report discipline.
When examining discipline as the only fixed predictor of effect sizes, disciplinary differences did not emerge (F[8, 1132] = 0.87, p = .54). When examining discipline as a moderator of the relationship between year and effect size, percent racially minoritized and effect size, and percent women and effect size, respectively, no effects were notable (year: F[5, 36] = 0.61, p = .69; percent racially minoritized: F[4, 46] = 0.48, p = .75; percent women: F[4, 55] = 1.57, p = .19). Thus, the relationships between year and sample demographic characteristics on effect size were not substantially different across disciplines, nor were average effect sizes substantially different across disciplines. Average effect sizes per discipline ranged from = .11 to .22 (.001 < p < .03; see ).
Table 3. Disciplinary Impact on the Predictive Validity of the GRE.
Results of effects by GRE subsections
Overall, n = 226 effects used the GRE total score, n = 562 effects used the GRE verbal score, n = 561 effects used the GRE quantitative score, and n = 310 effects used the writing/analytical score to assess student outcomes. When examining GRE subsection as the only predictor of effect sizes, differences emerged (F[3, 1563] 5.38, p = .001). However, the relationship between GRE subsection and student outcomes were not moderated by year (F[3, 190] = 0.79, p = .50), percent racially minoritized (F[3, 217] = 0.55, p = .65), or percent women (F[3, 226] = 0.77, p = .51). Average effect sizes per GRE subsection ranged from .16 to .20 (p-values < .001; see ).
Table 4. Differences in the Predictive Validity across GRE Subsections.
Results of effects by student outcome
Most coded effects reflected the relationship between GRE on GPA (n = 655), though other outcomes such as degree progress and completion (n = 314), course grades (n = 214), and some form of skill assessment (n = 229) were frequently evaluated. When examining the type of student outcome as a predictor of effect sizes, differences were found (F[8, 1077] = 13.38, p < .001), with the largest predictive relationship between GRE and subjective assessments (e.g., self-evaluation; r = .29, p < .001) and the weakest relationship (r = .04, p = .59) between GRE and attrition (see ). Further, the relationship between GRE and student outcomes were moderated by year (F[5, 39] = 5.07, p < .001), but not by percent racially minoritized (F[4, 38] = 0.51, p = .73) nor percent women (F[5, 39] = 1.49, p = .21). Across time, the predictive value decreased when evaluating GRE on degree progress (B = −0.0032, t = −2.06, p = .04), yet year did not significantly impact any other relationships among GRE and non-GPA student outcomes (see ).
Table 5. Differences in the Predictive Validity across Different Student Outcomes.
Results of effects using GPA as the outcome
The same multilevel mixed-effects analytic approach that was used when evaluating all outcomes was also used to evaluate models that considered only GPA as the outcome. When controlling for the nested structure of the data, where effects were nested within articles, the average correlation between GRE scores and GPA was = .20 (t = 14.68, p < .001). The intraclass correlation was ICC =.46, suggesting that a substantial amount of variance was shared among effects within articles.
A second model then incorporated the fixed effect of year, percent racially minoritized, and percent women. Results showed that effect sizes changed significantly as a function of both year ( = −.0098, t = −4.91, n = 94, p < .001) and percentage of women (
= .0031, t = 3.36, n = 94, p = .001) in the sample, but not percentage of racially minoritized persons (
= −.0003, t = −0.40, n = 94, p = .69).Footnote2 Over time, holding all other variables constant, the adjusted effect of GRE on GPA decreased from
= .25 in 1957 to
= .16 in 2022 (p < .001; see for an unadjusted representation). As the percentage of women increased, holding all other variables constant, the effect of GRE on student outcomes increased from
= .16 at 0% women to
= .26 at 100% women (p = .001; see for an unadjusted representation). However, as the percentage of racially minoritized persons within samples increased, the effect of GRE on GPA decreased nonsignificantly from
= .21 at 0% racially minoritized to
= .15 at 100% racially minoritized (p = .69; see for an unadjusted representation). These results are similar, though slightly larger in magnitude, to those found when evaluating all student outcomes. It is possible that the lack of statistical significance from racially minoritized results is due to the small number of studies (21.6%) providing sample demographic composition data.
Figure 5. Predictive Value of the GRE on GPA Over Time, Effects Across Studies.
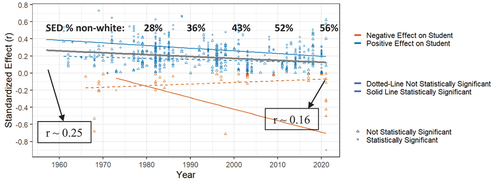
Figure 6. Predictive Value of the GRE on GPA Across Gender, Effects Across Studies.
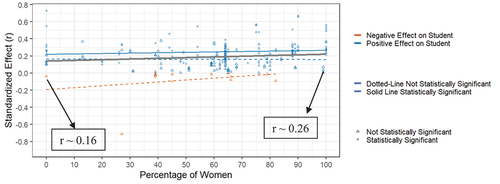
Figure 7. Predictive Value of the GRE on GPA Across Race, Effects Across Studies.
Results of effects using first-year GPA
Only 12.5% of GPA outcomes reported exclusively on first-year GPA (i.e., 79 effects across 14 studies). When constraining the study sample to these 79 effects, and controlling for the nested structure of the data where effects were nested within articles, results showed the average correlation between GRE scores and first-year GPA was = .16 (t = 6.07, p < .001). Across time, the predictive relationship among GRE scores and first-year GPA decreased from
= .31 in 1957 to
= .09 in 2022 (
= −.0031, t = −2.27, n = 79, p = .04). Across the 79 effects, only 23 reported information about gender and 15 reported information about race, so these effects should be interpreted with substantial caution. Across gender, the relationship among GRE scores and first-year GPA changed non-significantly from
=.42 at 0% women to
=.03 at 100% women (
= −.0039, t = −1.04, n = 23, p = .32). Across race, the relationship among GRE scores and first-year GPA changed non-significantly from
= −.0005 at 0% racially minoritized persons to
= .18 at 100% racially minoritized persons (
= .0019, t = 2.12, n = 15, p = .052).
Results of effects using GPA as the outcome by discipline
When examining discipline as the only fixed predictor of GRE to GPA effect sizes, significant differences did not emerge (F[8, 525] = 1.77, p = .08). When examining discipline as a moderator of the relationship between year and effect size, percent racially minoritized and effect size, and percent women and effect size, no effects were notable (year: F[3, 13] = 0.22, p = .88; percent racially minoritized: F[2, 19] = 0.36, p = .70; percent women: F[3, 22] = 2.77, p = .06). Thus, the relationships between year and sample demographic characteristics on effect size between GRE scores and GPA were not substantially different across disciplines, nor were average effect sizes substantially different across disciplines. Average adjusted effect sizes per discipline ranged from = .14 to .30 (.001 < p < .07; see ).
Table 6. Differences in the Predictive Validity of the GRE on GPA across Disciplines.
Results of effects using GPA as the outcome by GRE subsections
When evaluating GPA as the primary outcome, n = 90 effects used the GRE total score, n = 214 effects used the GRE verbal score, n = 217 effects used the GRE quantitative score, and n = 111 effects used the writing/analytical score to assess student outcomes. Notably, GRE subsections were differentially predictive of GPA as outcome (F[3, 569] = 6.01, p < .001), though the relationship between GRE subsection and GPA was not moderated by year (F[3, 66] = 0.51, p = .68), percent racially minoritized (F[3, 65] = 0.40, p = .75), or percent women (F[3, 62] = 0.66, p = .58). Average effect sizes with GPA as outcome across GRE subsections ranged from .17 to .24 (p-values < .001; see ).
Table 7. Differences in the Predictive Validity of the GRE on GPA across GRE Subsections.
Results of negative effects
A total of 278 effects (17% of all effects) reported negative relationships among GRE and student outcomes. When constraining the study sample to effects reporting negative outcomes, results showed average correlation between GRE scores and negative student outcomes, controlling for the nested structure of data where effects were nested within articles, was = −.11 (t = −8.34, p < .001). When including year and study demographic characteristics in the model,Footnote3 results showed that effect sizes did not change significantly as a function of year (
= −.0002, t = −0.29, n = 278, p < .77), percentage of women (
= −.0002, t = −0.30, n = 83, p = .77), or percentage of racially minoritized persons (
= −.002, t = −1.91, n = 42, p = .07).Footnote4 Put into context, over time, holding all other variables constant, the adjusted effect among GRE and student negative outcomes non-significantly changed from
= −.10 in 1957 to
= −.11 in 2022 (p = .77; refer to for an unadjusted representation). Further, as the percentage of women increased, holding all other variables constant, the effect of GRE on student outcomes changed non-significantly from
= −.09 at 0% women to
= −.11 at 100% women (p = .77; refer to for an unadjusted representation). As the percentage of racially minoritized persons within samples increased, the negative effect of GRE on student outcomes changed nonsignificantly from
= −.04 at 0% racially minoritized to
= −.22 at 100% racially minoritized (p = .07; refer to for an unadjusted representation).
Discussion
The purpose of this study was to examine the predictive capacity of the GRE in relation to outcomes relevant to success in graduate school as a function of time and demographic shift in graduate school population and sample composition. Specifically, we tested the hypothesis that as access to graduate education has increased for women and people of Color, resulting in a more diverse graduate student population, the predictive value of the GRE would decrease.
Overall, a substantial majority of effects reported in the studies analyzed were nonsignificant (62.3%; 1,033 of 1,659), indicating that they did not find any predictive value of the GRE for the outcomes assessed. However, the aggregate mean effect across all studies was small, significant, and positive, accounting for 3.24% of variance across measured outcomes, 4% of variance in overall GPA, and 2.56% of variance in first-year graduate GPA. Thus, in the majority of comparisons the GRE held no predictive value and, on average, predictive value when observed was minimal (e.g., 96% of variance in overall GPA not predicted by GRE scores).
These findings are equivalent to Goldberg and Alliger’s (Citation1992) smaller meta-analysis of studies in psychology and substantially lower than that of Kuncel et al. (Citation2001). Kuncel and colleagues’ meta-analysis — similar to the current study in range of disciplines and number of studies — found aggregate effects indicating that GRE scores accounted for an estimated 8.4% of variance across outcomes, 11.6% of variance for overall GPA, and nearly 13% of variance for first-year graduate GPAFootnote5. These differences in findings are in line with the primary hypothesis of the paper that the predictive validity of the GRE is diminishing over time as the graduate population diversifies.
Predictive validity and fairness of the GRE for people of color
When effect sizes were assessed over time between 1957 and 2020, there was a significant decrease in overall magnitude across all assessed outcomes collectively (from 4.84% of variance to 2.25% of variance) and GPA specifically (from 6.25% of variance to 2.56% of variance). Because the graduate student population became substantially more diverse over this period of time, these findings provide one facet of support for our initial hypothesis that the predictive value of the GRE diminishes as the graduate student population becomes less white and male over time.
When looking at the effects by study sample composition, results by race/ethnicity are less robust from the standpoint of statistical significance — possibly due to the very small proportion of studies that provided race/ethnicity data about their samples. Across all studies that did report demographic data, overall estimated mean effects did not meaningfully change when the sample was comprised entirely of people of Color. However, when specifically looking at the relationship between GRE score and GPA, which is the criterion for which ETS claims specific predictive validity (Bridgeman & Kell, Citation2022), the estimated mean predictive ability of the GRE decreased substantially but nonsignificantly from 4.41% of variance to 2.25% of variance as sample composition increased from 0% people of Color to 100% people of Color. Further, it is noteworthy that the average magnitude of negative predictive effects (i.e., stronger GRE scores predicting poorer outcomes and weaker GRA scores predicting more positive outcomes) likewise increased nonsignificantly (p = .07) as the percentage of people of Color in the sample increased. For samples including no people of Color, the estimated negative prediction was near zero (0.16% of variance). However, for samples that were comprised entirely of people of Color, the estimated variance accounted for in negative outcomes was 5.29%. Although occurrences where GRE predicts negative student outcomes represent a smaller number of studies than those showing a positive or null effect, they provide relevant information about the GRE’s impacts, especially on minoritized groups. In short, when the GRE is used to predict outcomes for people of Color as part of an admissions process, it can provide misleading predictions (e.g., lower GRE scores predict higher levels of performance, higher GRE scores predict lower levels of performance), which would bias admissions decisions in a manner likely to disadvantage people of Color who would perform at high levels if admitted.
It should be noted that nearly 4 out of 5 studies omitted descriptive race/ethnicity data about their samples. Beyond substantially reducing statistical power for the purposes of attaining statistical significance at p < .05 in the current study, it should be noted that failure to provide these data fundamentally erases the presence of people of Color from the literature. Doing so further reflects the pervading assumptions of whiteness and its presumed normalcy within graduate education and graduate education research.
Another piece of convergent evidence emerges from the GRE’s relationships with the various types of outcomes assessed. Overall, the predictive ability of the GRE was greatest for student self-reflective assessments (8.41% of variance), which are generally susceptible to influence by self-beliefs that may be disconnected from actual performance (Elliott, Citation2022; Feldon et al., Citation2015), including impostor phenomenon (Chakraverty, Citation2020a; Cohen & McConnell, Citation2019; J. R. Posselt, Citation2018). Research on impostor phenomenon finds that effects tend to be more robust for students of Color, especially when they report directly experiencing racism in their graduate learning environments (Bernard et al., Citation2018; Chakraverty, Citation2019, Chakraverty, Citation2020b). Accordingly, these data may likewise reflect a lack of fairness in the GRE for people of Color.
In contrast, GRE’s weakest predictive relationships were with degree completion (i.e., the reverse of attrition; 0.16% of variance) and progress toward degree (0.64% of variance). These measures are robust, objective, and arguably tautological measures of success in graduate education. Given that the overall stated purpose and applied use of the GRE is to provide information capable of helping admissions committees in their decision making about which applicants are likely to succeed, these near-zero relationships highlight the test’s lack of suitability to the task. Further, the relationship between GRE and progress toward degree was shown to decrease over time.
In the context of these findings, it is possible that programs requiring GRE scores for admissions do admit diverse students with high GRE scores yet fail to create accepting environments and supportive structures for those students to thrive (Brockman, Citation2021; McGee et al., Citation2022). In so doing, they may amplify the frequency and magnitude of negative predictive effects of the GRE. If programs admit students of Color but fail to provide appropriate supports and investment in creating a safe, welcoming environment, they are likely to create an environment of presumed whiteness that amplifies the impacts of the hidden curriculum (Calarco, Citation2020). As a result, underperformance and program attrition may be disproportionately high, even for top-scoring students from marginalized backgrounds.
Predictive validity and fairness of the GRE by gender
It should be noted that our findings regarding gender follow a different pattern. Overall, the predictive validity of the GRE increased as the proportion of men in the study sample decreased. With wholly male samples, the GRE accounted for an estimated 1.2% of variance. With wholly non-male samples, the estimated predictive variance increased to 4.41%. When looking specifically at the relationship between GRE and GPA, estimated predictive variance increased from 2.56% to 6.76%. These findings may reflect less marginalization of women within the academy compared to that facing people of Color. However, it also highlights the inability of the extant research to support meta-analytic investigations of the predictive validity of the GRE in relation to intersectional identities, as less than half of studies reported sample gender (more accurately, sex, as no studies reported inclusion of non-binary identities) and only around 20% provided racial/ethnic data. These limitations of the data prevented us from assessing the extent to which the increases in predictive validity as a function of sample composition was limited to white women.
Summary and implications
Overall, these findings reinforce existing concerns about the utility of the GRE in graduate admissions (e.g., C. Miller & Stassun, Citation2014; J. R. Posselt, Citation2016), showing problematic test validity and test fairness when considering studies conducted to date. With a very low percentage of variance predicted by GRE overall and a lower aggregate percentage in recent years, the majority of comparisons failing to find significant effects in either direction, and evidence that higher proportions of people of Color in the sample lead to higher magnitudes of negative outcomes, the predictive benefit is minimal and the risk of incorrect prediction is problematic as both a matter of validity and fairness — especially as we continue to diversify the population of graduate students. When coupled with the reported lack of incremental validity for GRE scores after accounting for undergraduate GPA (Goldberg & Alliger, Citation1992) and indications that merely requiring GRE scores is a deterrent to qualified applicants of Color (Wolf, Citation2014), it seems clear that the tradeoffs entailed in reliance on the GRE are not beneficial for applicants or institutions. Further, if trends over time continue, the predictive value of the GRE will continue to diminish from their current negligible level as efforts to diversify the graduate student population meet with further success.
Based on these findings and the characteristics of the studies found in the literature, we offer several suggestions for future research examining the predictive validity of the GRE. First, detailed demographic information of study samples must be reported to gauge differential predictive validity by group more precisely. The number of studies in this corpus that did so was notably small and limited the statistical power of several analyses. Further, current reporting norms prevented analysis of differences based on intersectional identities, which could further illuminate biases in admissions processes that include GRE scores. Second, additional studies are needed that investigate the deterrent effects of requiring GRE scores for graduate admission (e.g., Wolf, Citation2014). When prospective applicants of Color are deterred from completing an application process by a GRE requirement, there are harms to both their educational opportunities and the ability of subsequent studies of the GRE’s predictive validity to examine an unbiased sample. The absence of minoritized individuals skews estimates of the population as data missing not at random (MNAR; Gomer & Yuan, Citation2021), perpetuating the faulty narrative of white normativity that neglects the very real systemic barriers of cost and access to testing that are disproportionately likely to affect people of Color in the United States.
Limitations
The findings reported here entail several limitations. First, we do not differentiate amongst every possible discrete outcome associated with the GRE. ETS does not claim predictive validity beyond the GPA of the first year of graduate school (Bridgeman & Kell, Citation2022) despite broader assumptions of predictivity evident in admissions practices (Klieger et al., Citation2017; Kuncel et al., Citation2001; J. R. Posselt, Citation2016). Thus, considering the specificity of predictive relationships is important for full consideration of validity.
Another limitation that has received substantial attention in the broader literature is the restricted range of GRE data when analyzing its predictive validity. Because it is highly unusual for applicants with very low scores to be admitted into graduate programs, it is not possible to directly test the full predictive power of the GRE in relation to graduate program outcomes, potentially suppressing correlation coefficients (Small, Citation2017). However, some studies have leveraged special admissions programs that disregard GRE scores to test their predictive relationships using an unrestricted range (e.g., Sealy et al., Citation2019). In those few cases, the GRE has not demonstrated significant predictive validity. Accordingly, it is also possible that restricted range has led to an overestimation of GRE effects, rather than the reverse.
Conclusions
Although ETS (Citation2021) acknowledges that GRE scores are systematically lower for people of Color than they are for white people and acknowledges the need for holistic admissions processes, it continues to characterize the test as “add[ing] value to the admissions decision-making process” (p. 4). Given that their acknowledgment directly implicates the GRE as unfair and invalid (per J. E. Helms, Citation2006 definition of test fairness), the use of such a test for admissions is problematic. Further, admissions committees frequently rely on GRE scores to justify their decisions, even when those decisions yield inequitable access to graduate education for students of Color (J. R. Posselt, Citation2016). These positions sustain and cultivate values of whiteness within universities that preserve privileged access for white applicants. Consequently, there is strong evidence that the GRE serves as an arbitrary gatekeeping mechanism more than a valid predictor of prospective student success. In many cases, one of the challenges of addressing systemic racism is that we must conceptualize and implement alternative systems. However, in the case of use of the GRE to inform admissions decisions, this barrier to change is negligible. Admissions committees already engage a host of other sources of information, and the results of this study confirm that the GRE has been providing little, if any, predictive value. Accordingly, the simple act of removing GRE requirements for applications eliminates a source of inequity without sacrificing information that holds actual utility.
As the academy endeavors to diversify both its student populations and its faculty, alternative bases for admissions are needed to yield more equitable and fair outcomes. Examining the effectiveness and equity of such approaches to admissions criteria are a growing area of research. However, such efforts are nascent and have a very limited foundation of evidence available (Francis et al., Citation2022). Current trends emphasize holistic admissions reviews that prioritize evaluation of personal experiences and attributes (Felix et al., Citation2012), such as relying heavily on letters of recommendation and statements of purpose (Kuncel et al., Citation2014; Murphy et al., Citation2009). However, such open-ended sources of information about applicants raise legitimate concerns about potential biases playing an unintended role in their evaluation (J. Posselt et al., Citation2020), especially when whiteness shapes many aspects of academic culture and institutions. Ceasing use of the GRE as a factor in graduate admissions will not change inherently change these structures, but it may be a productive first step.
Disclosure statement
No potential conflict of interest was reported by the author(s).
Notes
1. Note that due to many articles not reporting gender or race (54.3% did not include gender composition; 78.4% did not include race/ethnicity data), the sample size in this analysis was much smaller than the total sample size, affecting statistical power; point estimates are calculated based on all available data.
2. Note that due to many articles not reporting gender or race (54.3% did not include gender composition; 78.4% did not include race/ethnicity data), the sample size in this analysis was much smaller than the total sample size; point estimates are calculated based on all available data.
3. Due to very small sample sizes, each predictor was evaluated separately.
4. Note that due to many articles not reporting gender or race (54.3% did not include gender composition; 78.4% did not include race/ethnicity data), the sample size in this analysis was much smaller than the total sample size, affecting statistical power; point estimates are calculated based on all available data.
5. Percentages of variance computed by taking the mean rho value across GRE subtests (i.e., verbal, quantitative, analytical) for designated outcomes reported in in Kuncel et al. (2001, p. 169) and squaring those values. It is possible that computing these relationships from their raw data for relationships with total GRE score would yield trivial differences in value. Research productivity and publication citation count outcomes from that study were omitted when computing Kuncel and colleagues’ overall effects to maximize comparability with the outcomes included in the current study.
References
- Akom, A. A. (2008). A meritocracy and infra-racial racism: Racializing social and cultural reproduction theory in the twenty-first century. Race Ethnicity and Education, 11(3), 205–230. https://doi.org/10.1080/13613320802291116
- American Educational Research Association, American Psychological Association, & National Council on Measurement in Education. (Eds.). (2014). Standards for educational and psychological testing. American Educational Research Association.
- Au, W. (2013). Hiding behind high-stakes testing: Meritocracy, objectivity and inequality in U.S. education. The International Education Journal: Comparative Perspectives, 12(2), 7–19.
- Bates, D., Maechler, M., Bolker, B., & Walker, S. (2015). Fitting linear mixed-effects models using lme4. Journal of Statistical Software, 67, 1–48.
- Bensimon, E. M. (2005). Closing the achievement gap in higher education: An organizational learning perspective. New Directions for Higher Education, 2005(131), 99–111. https://doi.org/10.1002/he.190
- Bernard, D., Hoggard, L., & Neblett, E., Jr. (2018). Racial discrimination, racial identity, and impostor phenomenon: A profile approach. Cultural Diversity & Ethnic Minority Psychology, 24, 51–61. https://doi.org/10.1037/cdp0000161
- Borenstein, M., Hedges, L. V., Higgins, J. P. T., & Rothstein, H. R. (2009). Publication bias. In M. Borenstein, L. V. Hedges, J. P. T. Higgins, & H. R. Rothstein (Eds.), Introduction to meta-analysis (pp. 277–292). Wiley.
- Bridgeman, B., & Kell, H. (2022). GRE test validity: Putting it in perspective. https://www.ets.org/content/dam/ets-org/pdfs/gre/test-validity-putting-it-in-perspective.pdf
- Brockman, A. J. (2021). “La Crème de la Crème”: How racial, gendered, and intersectional social comparisons reveal inequities that affect sense of belonging in STEM. Sociological Inquiry, 91(4), 751–777. https://doi.org/10.1111/soin.12401
- Cabrera, N. L., Franklin, J. D., & Watson, J. S. (2017). Whiteness in higher education: The invisible missing link in diversity and racial analyses (vol. 42, No. 6). Association for the Study of Higher Education.
- Calarco, J. M. (2020). A field guide to grad school: Uncovering the hidden curriculum. Princeton University Press.
- Chakraverty, D. (2019). Impostor phenomenon in STEM: Occurrence, attribution, and identity. Studies in Graduate and Postdoctoral Education, 10(1), 2–20. https://doi.org/10.1108/SGPE-D-18-00014
- Chakraverty, D. (2020a). PhD student experiences with the impostor phenomenon in STEM. International Journal of Doctoral Studies, 15, 159–179. https://doi.org/10.28945/4513
- Chakraverty, D. (2020b). The impostor phenomenon among Black doctoral and postdoctoral scholars in STEM. International Journal of Doctoral Studies, 15, 433–460. https://doi.org/10.28945/4613
- Cohen, E. D., & McConnell, W. (2019). Fear of fraudulence: Graduate school program environments and the impostor phenomenon. The Sociological Quarterly, 60(3), 457–478. https://doi.org/10.1080/00380253.2019.1580552
- DeAngelo, L., Schuster, M. T., & Lachaud, Q. A. (2021). The faculty role in grooming and gatekeeping students of color: Potential along the professoriate pipeline. The Review of Higher Education, 44(4), 493–521. https://doi.org/10.1353/rhe.2021.0010
- Duval, S., & Tweedie, R. (2000). Trim and fill: A simple funnel-plot–based method of testing and adjusting for publication bias in meta-analysis. Biometrics, 56(2), 455–463. https://doi.org/10.1111/j.0006-341X.2000.00455.x
- Educational Testing Service. (2019). A snapshot of the individuals who took the GRE general test. ETS. https://www.ets.org/s/gre/pdf/snapshot_test_taker_data_2018.pdf
- Educational Testing Service. (2021). GRE guide to the use of scores. ETS. https://www.ets.org/s/gre/pdf/gre_guide.pdf
- Egger, M., Smith, G., Schneider, M., & Minder, C. (1997). Bias in meta-analysis detected by a simple, graphical test. The BMJ, 315(7109), 629–634. https://doi.org/10.1136/bmj.315.7109.629
- Ellin, A. (2012, April 13). Do grades matter? New York Times. https://www.nytimes.com/2012/04/15/education/edlife/do-grades-matter.html
- Elliott, D. L. (2022). A ‘doctoral compass’: Strategic reflection, self-assessment and recalibration for navigating the ‘twin’ doctoral journey. Studies in Higher Education, 47(8), 1652–1665. https://doi.org/10.1080/03075079.2021.1946033
- Feagin, J. R. (2010). The White racial frame: Centuries of racial framing and counter-framing. Routledge.
- Feldon, D. F., Maher, M. A., Hurst, M., & Timmerman, B. (2015). Faculty mentors’, graduate students’, and performance-based assessments of students’ research skill development. American Educational Research Journal, 52(2), 334–370. https://doi.org/10.3102/0002831214549449
- Felix, H., Laird, J., Ennulat, C., Donkers, K., Garrubba, C., Hawkins, S., & Hertweck, M. (2012). Holistic admissions process: An initiative to support diversity in medical education. The Journal of Physician Assistant Association, 23(3), 21–27. https://doi.org/10.1097/01367895-201223030-00004
- Francis, A., Klein, L., Holmes Thomas, S., Kainz, K., & Blank Wilson, A. (2022). Holistic admissions and racial/ethnic diversity: A systematic review and implications for social work doctoral education. Journal of Social Work Education, 58(2), 227–244. https://doi.org/10.1080/10437797.2021.1895927
- Goldberg, E., & Alliger, G. (1992). Assessing the validity of the GRE for students in psychology: A validity generalization approach. Educational and Psychological Measurement, 52(4), 1019–1027. https://doi.org/10.1177/0013164492052004026
- Gomer, B., & Yuan, K. H. (2021). Subtypes of the missing not at random missing data mechanism. Psychological Methods, 26(5), 559–598. https://doi.org/10.1037/met0000377
- Griffin, K. A. (2020). Institutional barriers, strategies, and benefits to increasing the representation of women and men of color in the professoriate. In L. W. Perna (Ed.), Higher education: Handbook of theory and research (Vol. 35, pp. 1–73). Springer.
- Hawkman, A. M. (2020). Swimming in and through whiteness: Antiracism in social studies teacher education. Theory & Research in Social Education, 48(3), 403–430. https://doi.org/10.1080/00933104.2020.1724578
- Hedges, L. V., Tipton, E., & Johnson, M. C. (2010). Robust variance estimation in meta-regression with dependent effect size estimates. Research Synthesis Methods, 1(1), 39–65. https://doi.org/10.1002/jrsm.5
- Helms, J. (2002). A remedy for the Black-white test-score disparity. The American Psychologist, 57(4), 303–305.
- Helms, J. E. (2006). Fairness is not validity or cultural bias in racial-group assessment: A quantitative perspective. The American Psychologist, 61(8), 845–859. https://doi.org/10.1037/0003-066X.61.8.845
- Karabel, J. (2005). The chosen: The hidden history of admission and exclusion at Harvard, Yale, and Princeton. Houghton Mifflin.
- Klieger, D., Belur, V., & Kotloff, L. (2017). Perceptions and uses of GRE® scores after the launch of the GRE ® revised general test in August 2011. ETS Research Report Series, 1(1), 1–49. https://doi.org/10.1002/ets2.12130
- Kuncel, N., Hezlett, S., & Ones, D. (2001). A comprehensive meta-analysis of the predictive validity of the graduate record examinations: Implications for graduate student selection and performance. Psychological Bulletin, 127(1), 162–181. https://doi.org/10.1037/0033-2909.127.1.162
- Kuncel, N., Kochevar, R., & Ones, D. (2014). A meta-analysis of letters of recommendation in college and graduate admissions: Reasons for hope. International Journal of Selection and Assessment, 22(1), 101–107. https://doi.org/10.1111/ijsa.12060
- Kuncel, N., Wee, S., Serafin, L., & Hezlett, S. (2010). The validity of the graduate record examination for master’s and doctoral programs: A meta-analytic investigation. Educational and Psychological Measurement, 70(2), 340–352. https://doi.org/10.1177/0013164409344508
- McGee, E. O., Botchway, P. K., Naphan-Kingery, D. E., Brockman, A. J., Houston, S., II, & White, D. T. (2022). Racism camouflaged as impostorism and the impact on Black STEM doctoral students. Race Ethnicity and Education, 25(4), 487–507. https://doi.org/10.1080/13613324.2021.1924137
- Messick, S. (1980). Test validity and the ethics of assessment. The American Psychologist, 35(11), 1012–1027. https://doi.org/10.1037/0003-066X.35.11.1012
- Messick, S. (1995). Validity of psychological assessment: Validation of inferences from persons’ responses and performances as scientific inquiry into score meaning. The American Psychologist, 50(9), 741–749. https://doi.org/10.1037/0003-066X.50.9.741
- Miller, C., & Stassun, K. (2014). A test that fails. Nature, 510(7504), 303–304. https://doi.org/10.1038/nj7504-303a
- Miller, C. W., Zwickl, B. M., Posselt, J. R., Silvestrini, R. T., & Hodapp, T. (2019). Typical physics Ph. D. admissions criteria limit access to underrepresented groups but fail to predict doctoral completion. Science Advances, 5(1), 1. https://doi.org/10.1126/sciadv.aat7550
- Mohajeri, O. (2021). “Fly on the wall” moments reveal whiteness-at-work for contested white graduate students. International Journal of Qualitative Studies in Education, 35(4), 393–409. https://doi.org/10.1080/09518398.2021.2003897
- Morrison, T., & Morrison, M. (1995). A meta-analytic assessment of the predictive validity of the quantitative and verbal components of the graduate record examination with graduate grade point average representing the criterion of graduate success. Educational and Psychological Measurement, 55(2), 309–316. https://doi.org/10.1177/0013164495055002015
- Murphy, S., Klieger, D., Borneman, M., & Kuncel, N. (2009). The predictive power of personal statements in admissions: A meta-analysis and cautionary tale. College and University, 84(4), 83–86, 88.
- National Center for Education Statistics. (2019). Table of full-time faculty in degree-granting postsecondary institutions, by race/ethnicity, sex, and academic rank: Fall 2015, fall 2017, and fall 2018. Digest of Education Statistics. https://nces.ed.gov/programs/digest/d19/tables/dt19_315.20.asp
- National Center for Science and Engineering Statistics. (2020). Employment sector of doctorate recipients with definite postgraduation commitments for employment in the United States, by sex, citizenship status, ethnicity, and race: Selected years, 1999–2019. Survey of Earned Doctorates, Table 47. https://ncses.nsf.gov/pubs/nsf21308/data-tables.
- Okahana, H., & Zhou, E. (2018). Graduate enrollment and degrees: 2007 to 2017. Council of Graduate Schools.
- Patton, L. (2016). Disrupting postsecondary prose: Toward a critical race theory of higher education. Urban Education, 51(3), 315–342. https://doi.org/10.1177/0042085915602542
- Petersen, S., Erenrich, E., Levine, D., Virogeaux, J., & Gile, K. (2018). Multi-institutional study of GRE scores as predictors of STEM PhD degree completion: GRE gets a low mark. Plos One, 13(10), e0206570. https://doi.org/10.1371/journal.pone.0206570
- Posselt, J. R. (2014). Toward inclusive excellence in graduate education: Constructing merit and diversity in PhD admissions. American Journal of Education, 120(4), 481–514. https://doi.org/10.1086/676910
- Posselt, J. R. (2015). Disciplinary logics in doctoral admissions: Understanding patterns of faculty evaluation. The Journal of Higher Education, 86(6), 807–833. https://doi.org/10.1353/jhe.2015.0030
- Posselt, J. R. (2016). Inside graduate admissions: Merit, diversity, and faculty gatekeeping. Harvard University Press.
- Posselt, J. R. (2018). Normalizing struggle: Dimensions of faculty support for doctoral students and implications for persistence and well-being. The Journal of Higher Education, 89(6), 988–1013. https://doi.org/10.1080/00221546.2018.1449080
- Posselt, J., Hernandez, T. E., Villarreal, C. D., Rodgers, A. J., & Irwin, L. N. (2020). Evaluation and decision making in higher education: Toward equitable repertoires of faculty practice. In L. W. Perna (Ed.), Higher education: Handbook of theory and research (Vol. 35, pp. 1–63). Springer Nature.
- Samson, F. L. (2013). Multiple group threat and malleable White attitudes toward academic merit. DuBois Review, 10(1), 233–260. https://doi.org/10.1017/S1742058X1300012X
- Schneider, L. M., & Briel, J. B. (1990). Validity of the GRE: 1988-89 summary report. Educational Testing Service.
- Sealy, L., Saunders, C., Blume, J., & Chalkley, R. (2019). The GRE over the entire range of scores lacks predictive ability for PhD outcomes in the biomedical sciences. Plos One, 14(3), e0201634. https://doi.org/10.1371/journal.pone.0201634
- Small, A. (2017). Range restriction, admissions criteria, and correlation studies of standardized tests. arXiv e-prints https://arxiv.org/abs/1709.02895.
- Sperling, R., Zwahr-Castro, J., Cruz, F., & Montalvo, J. (2017). Whites aren’t bad, Asian Americans are just better: Asymmetrical attributions for the white-Asian American achievement gap. Journal of Latinos and Education, 16(2), 110–123. https://doi.org/10.1080/15348431.2016.1205991
- Stewart, D. L., & Nicolazzo, Z. (2018). High impact of [whiteness] on trans* students in postsecondary education. Equity & Excellence in Education, 51(2), 132–145. https://doi.org/10.1080/10665684.2018.1496046
- Tang, C., Song, Q. C., & Wee, S. (2022). Dropping the GRE, keeping the GRE, or GRE-optional admissions: Considering tradeoffs and fairness. International Journal of Testing, 22(1), 43–71. https://doi.org/10.1080/15305058.2021.2019750
- Verostek, M., Miller, C., & Zwickl, B. (2021). Analyzing admissions metrics as predictors of graduate GPA and whether graduate GPA mediates Ph.D. completion. Physics Review: Educational Research, 17(2), 020115. https://doi.org/10.1103/PhysRevPhysEducRes.17.020115
- Wickham, H. (2016). Ggplot2: Elegant graphics for data analysis. Springer. https://ggplot2.tidyverse.org
- Wilson, K. M. (1979). The validation of GRE scores as predictors of first-year performance in graduate study: Report of the GRE cooperative validity studies project (GRE Board Research Report GREB 75-8R). Educational Testing Service.
- Wolf, C. (2014). The effect of the graduate record examination on minority applications experience at New York institute of technology. Journal of Allied Health, 43(4), 65E–67E.