Abstract
Experimental results for several trashrack models placed in a pressurized rectangular conduit are presented. The tests were performed for both straight and oblique approach flows. Trashrack models of different bar cross-sectional shapes, bar thicknesses, bar depths and bar spacing were studied for a range of velocities. The results indicate that the head loss across the trashrack increases with increasing approach velocity, flow inclination, and blockage ratio. Lower head losses were observed for bars with cross-sectional shape other than rectangular. Results were found to differ only moderately from the previous trashrack energy loss literature based almost entirely on open channel flow experiments. An equation has been developed that well represents the current experimental findings.
1 Introduction
Trashracks are comprised of an array of bars fitted at intakes of hydroelectric generating stations to prevent turbine damage from debris within the flow. Because of their simple geometry and availability, rectangular bars are typically used for trashracks. Large clear spacing between the individual bars can result in reduced energy losses with a low probability of preventing fish entrainment, while tightly spaced bars can physically prevent fish entrainment at the cost of an increase in energy loss through the trashrack.
A large body of literature deals with understanding the resistance to flow caused by objects of different shapes. Commonly, the drag coefficient of one specific object – rather than an array – is reported as a function of the Reynolds number (e.g. Naudascher Citation1991). The hydraulic resistance of a vast range of objects and fittings is summarized by Idelchik (Citation2001). Recently, computational fluid dynamics modelling was used by Khan et al. (Citation2004) to study the effect of partially blocking a trashrack in Oregon. Test investigations of trashracks are by no means a new endeavour. Kirschmer (Citation1926) and Spangler (Citation1929) studied trashrack bars of various sizes, shapes and bar spacing. Kirschmer (1926) developed from his tests
The United States Army Corps of Engineers (Citation1987) summarizes some of these results, indicating that all tests were conducted in open channel flow, and that the applicability of the formulae to submerged trashracks is unknown. This concern was the driving force behind the current research. Interested readers may refer to Wu and Molinas (Citation2005) who investigated energy losses through open channel contractions.
This study is one component of a larger project involving Manitoba Hydro, Fisheries and Oceans Canada and the University of Manitoba. The question arose whether the trashrack bar clear spacing could be reduced to physically prevent fish entrainment into the turbines while maintaining a reasonable level of hydraulic efficiency. The research objectives were to study the hydraulics near the trashracks and to develop data sets for calibration and verification of a computational fluid dynamics model. To accomplish these tasks, three different test sets were conducted. The first two sets made in open channel flow are summarized by Tsikata et al. (Citation2009a, Citation2009b) and Tsikata (Citation2008). Since trashracks at all the Manitoba Hydro generating stations are submerged, the third test set, which is the focus below, utilized piezometer taps to determine head loss across submerged trashrack models.
2 Experimental set-up and measurement procedure
2.1 Test facility and measurement technique
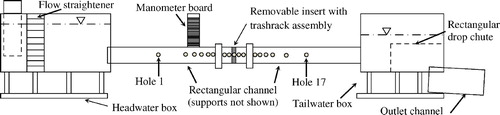
Experiments were conducted at the Hydraulics Research & Testing Facility, University of Manitoba. shows a scheme of the main apparatus components to ensure pressurized conditions across the trashracks. The main channel is composed of two 2.44 m long acrylic sections flanged at either end. Each section is 0.305 m deep and 0.455 m wide. The two sections are joined at the middle by a rectangular insert of the same cross section, 0.263 m long and secured via flanges. The trashrack bars were secured firmly in the insert before bolted to the main channel. Seventeen piezometer taps of 1.59 mm diameter were inserted along the sidewall of the main channel, connected to transparent flexible tubes of 3.18 mm inner diameter and mounted to a manometer board. Pressure fluctuations within the rectangular channel were usually of the order ±1 mm, while the resolution was better than ±0.5 mm.
Figure 1 Schematic side view of experimental apparatus (not to scale)
2.2. Test conditions
shows the notation used to describe the trashrack bar configuration and channel orientation. The tests were grouped into three series. Series 1 used acrylic-made rectangular bars to investigate the effects of bar thickness, bar spacing as well as approach velocity on the head loss. Dimensions and spacing, including the number of trashrack bars n, are summarized in , ordered from lowest to highest blockage ratio. The tests were conducted for straight approach flow θ = 0°. Prior to a test with trashrack bars, measurements were conducted with no bars in the channel to determine the baseline energy losses within the channel. The final two columns, Δh* and Δh** are the dimensionless head loss coefficients, which are discussed further below.
Table 1 Summary of test conditions for Series 1 and non-dimensional head loss
Figure 2 Scheme of channel inserts and relevant dimensions for (a) straight and (b) oblique approach flow
The effects of approach flow angle θ and approach flow velocity on the head loss were investigated in Series 2. Values of θ = 0°, 10°, 20° and 30° were considered () for s = 12 mm and L = 100 m, respectively. summarizes these test conditions.
Table 2 Summary of test conditions for Series 2 and non-dimensional head loss
In Series 3, the effect of bar shape and approach velocity on the head loss was investigated (). Shape S3–T1 is based on the NACA 0012 airfoil. Shape S3–T2 uses the same NACA 0012 leading edge, which is then mirrored on its trailing edge. Shape S3–T3 is based on a commercially available bar, and is the only bar with inconsistent values of s and L. Shape S3–T5 has a 6 mm radius at the leading edge. summarizes the test conditions for Series 3, including the shape factor η, to be discussed below.
Table 3 Summary of test conditions for Series 3, non-dimensional head loss and shape factor
Figure 3 Cross-sectional shapes of bars tested (dimensions in mm)
3 Results and discussion
3.1 Variation of pressure head
The variation of pressure head h with the streamwise distance has a similar trend for all tests. In general, the pressure head was nearly constant far upstream of the trashrack models. At their leading edges, h decreased with a more pronounced decrease within the bars, consistent with the increasing velocity head associated with the reduction in the net flow area. The pressure head then increased rapidly from its minimum to a nearly constant value far downstream of the trashrack models. It, however, did not recover to its upstream value. The head loss across the bars Δh was calculated by subtracting the average of the pressure readings of holes 13 through 16 from the average of holes 2 through 5.
3.2 Head loss
The head loss across the trashracks increases with the approach velocity U. shows Δh versus U for various blockage ratios p for Series 1. As expected, the values of Δh increase with U. Further, Δh increases rapidly with p. Superimposed on are the lines given by using
EquationEq. (2) reported subsequently. shows the dimensionless head loss coefficient Δh* = Δh/(U
2/2g) for selected tests, demonstrating independence of the Reynolds number R = Us/ν, because of the relatively high R and the fact that separation occurs consistently at sharp edges of rectangular bars (Naudascher Citation1991). The results for each test can therefore be collapsed into one dimensionless head loss coefficient Δh*, indicated by the dotted lines and the values in the figure legend. Values of Δh* for all tests are reported in .
Figure 4 Results from rectangular bar tests showing (a) Δh(U) with (—)
EquationEq. (2), (b) Δh*(R), (c) Δh**(p
2)
Flow visualization tests using dye tracer centred upstream of selected trashrack bars confirmed that the flow separates dramatically from the leading bar corners, creating a recirculation zone on both side bar faces. Tsikata et al. (2009a) made similar observations using PIV. The width of the recirculation zone was observed to increase with increasing velocity U.
demonstrates the effect of blockage ratio on Δh**, calculated by subtracting the value of Δh* for the empty channel test from the corresponding Δh* values of each trashrack model. Thus, the effects of frictional losses and minor losses associated with the bolted flanges of the channel insert were removed. The figure shows that Δh** increases linearly with increasing p 2. Also shown in is a line of best fit passing through the origin with a slope of 7.43.
The effect of oblique approach flow on trashrack head loss Δh and Δh** is shown in . The head loss increases with θ, yet for θ = 0° and θ = 10° there is no significant effect on Δh. Head losses are increased by 6 and 32% for θ = 20° and θ = 30°, respectively. A similar trend follows from Tsikata et al. (2009b) for straight approach flow with angled bars, rather than oblique flow with straight bars. and show that Δh*, Δh** for Series 2 also increase with U.
Figure 5 Results from Series 2 showing (a) Δh(U,θ), (—)
EquationEq. (2), (b) Δh**(θ)
The head loss results obtained for Series 3 are shown in . As previously, the head loss increases with U. summarizes the values of Δh*, Δh** and η. They decrease as the shape becomes more streamlined. shows that the head loss is highest for rectangular bars (S1–T4), but least for the NACA 0012 bars (S3–T1). The Δh values are quite similar for S3–T1 and S3–T2. It was observed that rounding the leading bar edge reduced the values of Δh significantly, consistent with Tsikata (Citation2008). For example, if rectangular bars with round leading edge (S3–T5) are used, the head loss decreases by 32% compared with rectangular bars, while streamlining the bar leading edge (S3–T4) decreases the head loss by 53%. Comparing the values of Δh** for tests S3–T1, S3–T2 and S3–T4, which all have the same leading edge, shows that there is a benefit of having a more streamlined trailing edge in addition to a streamlined leading edge.
Figure 6 Results from Series 3 showing Δh(U), (—)
EquationEq. (2)
The flow visualization tests demonstrated the effect of bar shape on flow separation. Separation initiated at the upstream corners of the rectangular bar in test S1–T4, and the width of the subsequent recirculation zone at the bar side face increased to a maximum of some 10 mm for U = 1.86 m/s. Near the downstream bar end, the magnitude of the dye fluctuation increased substantially, suggesting an increase in turbulence intensity. Conversely, for the NACA 0012 bar in test S3–T1, the dye trace was always within approximately 2 mm of the bar and therefore no recirculation zone was observed. Furthermore, the magnitude of the dye trace fluctuations at the downstream bar end suggested a much smaller turbulence level than in test S1–T4. Because of the lack of definite separation initiation locations, a slight dependence on Reynolds number was observed with the more streamlined bars.
The present results of the head losses may be represented by
3.3 Comparison among head loss equations
The head loss Δh was estimated using several equations from the literature and compared with the data of Series 1. A linear trend line passing through the origin was fitted to the data. presents the slope of the trend line and its coefficient of determination R
2. The results were further assessed by calculating the root-mean-squared error. shows that several equations over-predict the head losses measured herein, yet R
2 are similar for all equations. Since the variations in slope and R
2 for the literature data are not significantly different from
EquationEq. (2), the former appear to be valid for estimating head loss through submerged trashracks.
Table 4 Summary of parameters for comparing head loss equations
4 Conclusions
Energy loss across submerged trashracks was studied by examining the effect of trashrack bar thickness, spacing, shape, velocity and angle of the approach flow. An equation was developed that reasonably predicts the measured head loss. The following conclusions can be made from this experimental study:
-
Head loss is a function of blockage ratio, approach flow angle and velocity, and bar shape over the range of test conditions.
-
Head loss is significantly reduced by using the non-rectangular bar shapes. Streamlining of both the up- and downstream bar edges reduces energy loss more than streamlining only one edge. The bars need not be symmetric to provide a significant head loss decrease.
-
Approach flow angles less than or equal to 10° have a negligible effect on head loss, whereas the increase is considerable otherwise.
-
Based on the present results and literature data, the head loss associated with water surface disturbance up- and downstream of the trashracks for open channel flow are negligible. Previous equations formulated for head loss through trashracks placed in open channel with trashrack bars protruded above the water surface also provide reasonable estimates of head loss through submerged trashracks.
The results presented herein help trashrack designers to assess the hydraulic implications of increasing trashrack blockage ratios and changing trashrack bar shape. Designers will also need to consider the optimum clear spacing to be used for specific types of fish, the increased operation and maintenance cost due to the greater frequency of debris and/or frazil ice accumulation on the upstream trashrack edge, as well as the susceptibility of these shapes to corrosion that may eventually reduce the benefits that the initial shape presented.
Notation
| A j | = |
total nozzle area |
| b | = |
clear spacing between bars (m) |
| g | = |
gravitational acceleration (m/s2) |
| h | = |
pressure head (m) |
| L | = |
bar depth measured parallel to flow (m) |
| n | = |
number of trashrack bars |
| p | = |
blockage ratio |
| s | = |
bar thickness at thickest section point (m) |
| U | = |
approach flow velocity (m/s) |
| α | = |
trashrack angle (°) |
| η | = |
shape factor |
| θ | = |
approach flow angle (°) |
| ν | = |
kinematic viscosity (m2/s) |
| Δh | = |
head loss (m) |
| Δh* | = |
head loss coefficient |
| Δh** | = |
dimensionless head loss coefficient |
Acknowledgements
The authors wish to thank Dennis Lemke, Efrem Teklemariam and Kevin Sydor from Manitoba Hydro, Christos Katopodis and Haitham Ghamry from the Department of Fisheries and Oceans, as well as Mark Tachie from the University of Manitoba for their assistance throughout this project. Thanks also to Nicholas Kehler for constructing the test apparatus.
Related Research Data
References
- Fellenius , W. and Lindquist , E. G.W. 1929 . “ Experiments on the head loss caused by protecting racks at water-power plants ” . In Hydraulic laboratory practice , New York : ASME . 533–538
- Idelchik , I. E. 2001 . Handbook of hydraulic resistance , 3 , Redding, CT : Begell House Publishers .
- Khan , L. A. , Wicklein , E. A. , Rashid , M. , Ebner , L. L. and Richards , N. A. 2004 . Computational fluid dynamics modeling of turbine intake hydraulics at a hydropower plant . J. Hydraulic Res. , 42 ( 1 ) : 61 – 69 .
- Kirschmer , O. 1926 . Untersuchungen über den Gefällsverlust an Rechen. Hydraulisches Institut Mitteilung 1 , Edited by: Thoma , D. München, [in German] : Technische Hochschule .
- Meusburger , H. , Volkart , P. and Minor , H.-E. A new improved formula for calculating trashrack losses . 4 , Beijing, China. Proc. 29th IAHR Congress , pp. 804 – 809 .
- Naudascher , E. 1991 . “ Hydrodynamic forces ” . In IAHR hydraulic structures design manual 3 , Rotterdam NL : Balkema .
- Osborn , J. F. 1968 . Rectangular-bar trashrack and baffle headlosses . J. Power Div., ASCE , 94 ( PO2 ) : 111 – 123 .
- Spangler , J. 1929 . “ Investigation of the loss through trash racks inclined obliquely to the stream flow ” . In Hydraulic laboratory practice , New York : ASME . 461–470
- Tsikata , J. M. 2008 . “ Experimental investigation of turbulent flow through trashracks ” . In MSc thesis , University of Manitoba, Winnipeg, MB .
- Tsikata , J. M. , Katopodis , C. and Tachie , M. F. 2009a . Experimental study of flow near model trashracks . J. Hydraulic Res. , 47 ( 2 ) : 275 – 280 .
- Tsikata , J. M. , Tachie , M. F. and Katopodis , C. 2009b . Particle image velocimetry study of flow near trashrack models . J. Hydraul. Eng. , 135 ( 8 ) : 671 – 684 .
- United States Army Corps of Engineers . 1987 . Hydraulic design criteria , Open channel flow trash rack losses, Coastal and Hydraulics Laboratory, Vicksburg, MS . Sheet 010-7
- Wu , B. and Molinas , A. 2005 . Energy losses and threshold conditions for choking in channel contractions . J. Hydraulic Res. , 43 ( 2 ) : 139 – 148 .