Abstract
Experimental results are presented on suspended load transport rates of clay eroded from a channel bed made up of two types of cohesive sediment mixtures. The first mixture was prepared using fine gravel and clay with the clay proportion by weight varying from 10 to 50%. In the second mixture, equal proportions of fine gravel and fine sand were mixed with clay in proportions of 10 to 50%. Based on dimensional considerations a computational procedure was developed to estimate the rate of suspended load transport of the clay fraction eroded from the cohesive sediment mixtures. In the absence of cohesion, the proposed computational method transforms to a method for computation of suspended load transport rate of the cohesionless sediment mixtures. Studies on suspended load transport rates of cohesive sediment mixtures containing gravel as presented here were not reported so far in the literature to the best of our knowledge.
1 Introduction
Knowledge on detachment and transport of cohesive sediment by surface flows is relevant for studies relating to soil erosion in catchments, reservoir sedimentation, stable channel design, or river morphological modeling. This knowledge is also useful for the mitigation of soil surface erosion by rainfall and flowing water which causes severe damage to structures, like earth dams and highway embankments, and in engineering project investigations for stream bank erosion and stability, or scour around hydraulic structures. Fine cohesive sediments eroded from catchment areas adversely affect the aquatic life due to their deposition within the interstices of the coarser material of river bed. Thus, erosion of loose beds of sand, gravel and other materials like clay and weak rocks correspond to problems of considerable importance in hydraulic engineering.
Processes of bed and suspended load transports for cohesionless uniform and non-uniform sediments are well investigated (Parker et al. Citation1990, Garde and Ranga Raju Citation2006). Investigations on the erosion and the transport of consolidated and unconsolidated cohesive sediments formed by clay and other fine sediments such as silt and sand are also available (Raudkivi Citation1990). However, land surfaces and river bed material frequently consist of mixtures of cohesive and coarse cohesionless sediments. Soil in upland catchment areas is one such example (Kothyari and Jain Citation2008, Jain and Kothyari Citation2009). Results from the study of the detachment of cohesive sediment mixture containing gravel and its transport by the flow in the form of suspended load were not yet reported, however.
The main mechanisms that cause sediment to be moved in flowing water are flow velocity, and the shear and normal stresses resulting from flow turbulence (e.g. Garde and Ranga Raju Citation2006). If the hydrodynamic forces in a turbulent flow exceed the resisting forces of the cohesive sediment bed, sediment detachment initiates and flowing water becomes turbid (e.g. Kothyari and Jain Citation2008). An additional increase of the shear stress causes an increased sediment detachment from the bed, and sediment transport commences. Apart from river flows such erosion can also be caused by vortices or high velocity jets in the vicinity of hydraulic structures. The present study however is focused on studying the influence of cohesive material (clay) on suspended load transport by channel flows caused by the detachment of cohesive bed made up of mixture of gravel, sand and clay.
The detachment of cohesive sediment is controlled not only by macroscopic physical sediment properties such as its density but also by inter-particle bond strength and its fabric characteristics (Mazurek et al. Citation2001, Citation2003). Therefore, the erosion process of cohesive sediments depends on both physico-chemical properties and complex mechanical characteristics such as shear stress and shear strength. The amount and type of clay, antecedent moisture content, bulk density, and unconfined compressive strength are considered below to be the easily measured variables representing the factors controlling erosion characteristics of cohesive sediment mixtures.
2 Review of literature
Numerous investigations relating to suspended load transport rate of uniform and non-uniform sediments in the absence of cohesion are available, e.g. Garde and Ranga Raju Citation(2006). However, fewer investigations were made to determine suspended load transport rates by detachment of uniform and non-uniform cohesionless sediments mixed with clay fraction. Studies have been made on the erosion of cohesive sediments mostly consisting of either pure clay or mixtures of silt, sand and clay using laboratory-based experimental data. As is done herein, the erosion rate of the cohesive sediment mixtures was measured volumetrically or by weighing the material lost as a result of the erosion process.
Partheniades Citation(1965) investigated the erosion rate of cohesive sediments through flume tests. His sediment was of high plasticity with gradation of 60% clay of size less than 2 microns to 50 microns and very small amount of fine sand. The variation of erosion rates of clayey beds was studied with the bed shear stress, suspended sediment concentration and cohesive bed strength. It was concluded that clay resistance to erosion is independent of the macroscopic shear strength of cohesive bed. Similar conclusions were also reported by Briaud et al. Citation(2001) for clay-silt mixtures of median size ranging from 0.0012 mm to 0.06 mm. Herein (details are given below), the Unconfined Compressive Strength (UCS) of the bed material is considered a relevant variable describing the erosion rate of cohesive sediment mixture containing gravel. Hanson Citation(1996), however, recommended that the soil strength alone should not be relied upon to quantify the cohesive sediment erodibility.
Parchure and Mehta Citation(1985) measured the erosion behavior of soft cohesive sediment deposits. An experimental procedure involving layer-by-layer erosion under a range of bed shear stresses of successively increasing magnitude was utilized. The rate of erosion was found to vary exponentially with the bed shear stress. Cohesive shear strength was found to increase with the depth and it was also influenced by the type of sediment, the bed consolidation pressure and the salinity. Mitchener and Torfs Citation(1996) measured erosion rates using suspended load concentration of deposited stratified sediment bed materials from natural Scheldt mud and uniform fine sand. It was reported that while adding sand to the mud, or vice versa, the erosion resistance increased causing a reduction in the erosion rate, provided that the critical shear stress for the erosion is exceeded. The highest value of reduction occurred if sand is present between 30% and 50% by weight in sand-mud mixtures. Zreik et al. Citation(1998) measured surface erosion of freshly deposited Boston blue clay in a rotating annular flume. The erosion rate was obtained by measuring the suspended sediment concentration at intervals of 10 to 15 minutes. The age and structure of the clay were found to strongly affect the resistance to bed erosion. Following an increase in flow velocity, the erosion rate increased rapidly to a peak value and then dropped off to approximately zero. The resistance to erosion at a given depth and for a given bed forming clay structure increased with the age of the channel bed. Aberle et al. Citation(2004) developed a straight benthic in-situ flume to measure the erosion rate of cohesive sediments in both the fresh and salt water environments. Erosion was estimated by measuring the suspended sediment concentration using a turbidity meter. The erosion rate was noticed to occur at a high rate initially but decreasing exponentially with time. As herein, the erosion rate was found to be dependent of the bed material characteristics. Bulk density, water content, organic matter and sand content were the parameters used to quantify the characteristics of bed material by Aberle et al. Citation(2004).
Black et al. Citation(2002) and Mostafa et al. Citation(2008) have presented experimental results on surface erodibility tests performed with undisturbed and remolded samples of natural cohesive soils made up of mixtures of clay, silt and sand. When subjected to shear stress caused by flowing water, erosion was noticed to occur in these soils in modes of particle erosion and mass erosion. The erosion resistance was noticed to increase with the decrease of mean sediment size, increase of moist bulk density, and an increase of water content up to a certain level. Similar to Ansari et al. (Citation2002, Citation2003), the plasticity index, water content, and moist bulk density of the soil sample were used to parameterize the soil resistance against flow erosion. Note, however, that the plasticity index can not be measured for cohesive sediment mixtures containing gravel as is the present study. This review thus indicates that no investigation is available as yet to quantify the effect of cohesion on suspended load transport rate due to the detachment of non-uniform cohesive sediments of gravel sizes also present in the mixture.
3 Experimental program
3.1 General
The experiments were conducted at the Hydraulic Engineering Laboratory of the Department of Civil Engineering, Indian Institute of Technology, Roorkee, India. Their detailed description is available by Kothyari and Jain Citation(2008) and Jain and Kothyari Citation(2009). Only the salient features of the experimental program are therefore presented below.
3.2 Sediment properties
Cohesionless sediments consisting of fine sand and fine gravel were used as the base material. Clay was added in various proportions to the base material to simulate cohesive sediments. A wide range of field conditions was simulated by varying antecedent moisture conditions of the cohesive sediment test channel beds. Experiments were also conducted to determine various engineering properties of clay, sand and gravel and their mixtures.
Local available clay excavated from a depth of 2.0 m below the ground was used as cohesive material. Tests to determine the clay properties were conducted as per Indian Standard Code of Practice (IS Citation1970). A laser particle size analyzer was used to determine the particle size distribution curve of the clay. The clay material had a median size of d 50 = 0.0039 mm, geometric standard deviation of σ g = 1.5, the sand had d 50 = 0.23 mm and σ g = 1.53, and the gravel had d 50 = 3.1 mm and σ g = 1.28. The density of sand and gravel was 2.65 t/m3. As per the Wentworth scale, the clay is classified as the coarse clay (Garde and Ranga Raju Citation2006). The other engineering clay properties were: liquid (subscript L) limit W L = 38%, plastic (subscript P) limit W P = 24%, plasticity index PI = 14%, maximum dry density = 18.27 kN/m3, Optimum Moisture Content OMC = 16%, cohesion at OMC C u = 54 kN/m2, angle of internal friction at OMC θ c = 21° and density = 2.6 t/m3. As per IS-1498, the clay is classified as CI, i.e. clay with intermediate compressibility. The X-ray diffraction test was conducted to determine the composition of various clay minerals. Their percentage composition was found as per Klages and Hopper Citation(1985) was Kaolinite = 17.6%, Illite = 60.3%, Vermiculite = 15.3% and Chlorite = 6.8%.
3.3 Properties of cohesive sediment mixtures
Cohesive sediment mixtures were prepared by mixing clay first with fine gravel and next with mixture of fine sand and fine gravel in proportions varying from 10% to 50% by weight at the start of an experimental run. In clay-sand-gravel mixture the sand and gravel were mixed in equal proportion by weight. The antecedent moisture content in the cohesive sediment has great influence on its physical properties (Ansari et al. Citation2002). Depending upon the moisture content, the cohesive sediments change their stages, i.e. liquid, plastic and non-plastic (semi-solid). The tests were conducted under the maximum possible range of antecedent moisture content (4.88% to 21.69%) so as to represent their different stages as anticipated in the field conditions. Thus detachment and transport rate were observed at several moisture consistencies ranging from very soft sediment with negligible cohesion (viscous state) to hard sediment having a high value of cohesion.
3.4 Experimental flume
A tilting flume of length = 16 m, width = 0.75 m and depth = 0.5 m was used (Kothyari and Jain Citation2008). The test section of length = 6.0 m and width = 0.75 m started 8.0 m from the channel entrance. Sediment mixture was filled in the test section to a depth of 0.13 m below the bed level on its up- and downstream sides. A thin layer of the same cohesive sediment mixture was also glued uniformly onto the up- and downstream flume beds to simulate the roughness of the test section. Observations were made at various flume slopes ranging from 2.417 × 10⁻³ to 1.0 × 10⁻². The discharge to the flume was supplied by a constant overhead tank, regulated by a valve in the inlet pipe. The discharge was measured volumetrically in a tank below the channel end.
3.5 Measurements and observations
The UCS value for a sample of sediment mixture was measured using a laboratory-based unconfined compression test apparatus. Cylindrical specimens were taken from the compacted bed and tested as per IS Citation(1991) in an unconfined compression apparatus. Bulk unit weight of sediment was determined as per IS Citation(1975) by using a standard core cutter method. The value of dry density was computed by using the observed value of bulk density and antecedent moisture content. The void ratio was derived from the computed value of dry density of the cohesive sediment mixture.
After saturating the sediment bed for 24 h, a selected discharge was allowed into the flume and uniform flow was established by maintaining the pre-determined opening of the flume tail gate. The sediment got detached from the flume bed and transported as both suspended and bed loads. In sediment mixtures having clay fractions larger than 20% by weight the bed material was observed to detach in the form of thick flakes. However, the detachment occurred in the form of aggregates of irregular geometry and varying sizes while the clay fraction in the mixture was larger than 40% by weight. The detached flakes and aggregates immediately segregated into their constituents and the clay portion was always transported as suspended sediment and the cohesionless sediment moved as bed load. Herein only the results and conclusions relative to the suspended load transport rates are described.
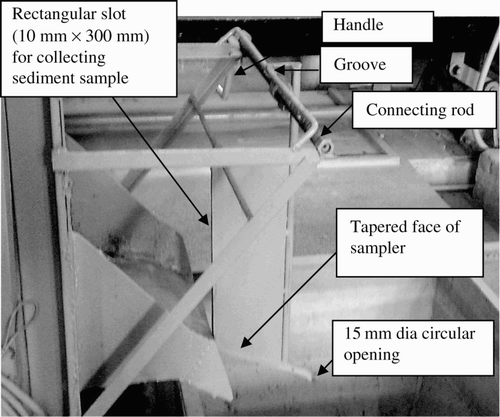
The concentration of suspended load was measured using a depth-integrated sampler installed at the downstream flume end. This sampler was made up of 2 mm thick steel plates and consisted of a rectangular slot with an opening of width 10 mm and height 300 mm that faced the flow (). The bottom surface of the sampler was tapered downwards so as to form an outlet at the downstream end of the sampler, in the form of a circular opening of size 15 mm. Its length of the bottom edge was 30 mm. The sampler hangs down, keeping the rectangular slot oriented in vertical position, from a horizontal bar having grooves and ridges and connected at its two ends with the railings on the flume top (). To traverse the flow width, the sampler was moved widthwise along the bar at the top by operation of a handle connected to it. The measurement of suspended load was taken at a temporal interval of about 30 minutes for initial durations of the runs; while the bed level changes were rapid, and at an interval of about 60 minutes during a later part of the runs; while the bed transients became gradual. Samples of sediment water mixture were collected in containers of 12 to 15 l capacity by traversing the depth integrated sampler over the entire flow width. The containers were weighed to determine their weight of water-sediment mixture. The water was then removed after allowing the fine sediment to settle completely, which required more than 24 h.
Figure 1 Details of depth integrating sampler
Next, the sediments were removed from these containers into smaller size pans using filters. These pans were placed in an electric oven for drying. Then, the samples were weighed using an electronic balance sensitive to 0.01 g. The concentration of suspended sediment sampled in each container was determined by dividing its weight by the given volume/weight of water volume containing this sediment.
Water and bed surface profiles were also measured at a longitudinal spacing of 0.5 m along the axis of the test section concurrently to the measurement of the sediment transport rate. The water surface profile was measured using a point gauge sensitive to ±0.1 mm, whereas the bed profile was measured using the blunt end of the point gauge also sensitive to ±0.1 mm. The point gauge and the blunt gauge were intruded into the flow only for a short duration while taking the observations so as not to disturb the flow and bed conditions. The total duration of the experimental runs varied from 1 to 15 hours. Experiments were conducted under a range of antecedent moisture contents and under various values of the flow tractive shear stress.
A total of 46 runs were conducted with clay-gravel mixtures, whereas 48 runs were conducted with clay-sand-gravel mixtures. In total 312 observations were made to measure the rate of suspended load transport of clay-gravel mixtures, whereas 353 such observations were made for clay-sand-gravel mixtures. The ranges of experimental data collected are listed in and . The complete data are available by Jain Citation(2008).
Table 1 Range of sediment and hydraulic parameters of experimental runs with clay-gravel mixtures
Table 2 Range of sediment and hydraulic parameters for experimental runs with clay-sand-gravel mixtures
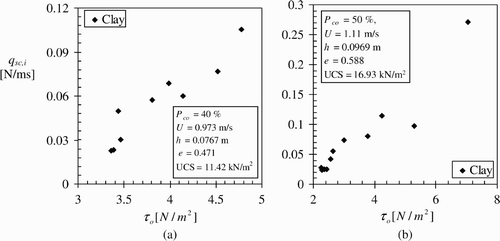
The variation of the detachment rate with the bed shear stress observed during experimental runs respectively with clay-gravel and clay-sand gravel mixture is shown in , with P
co
= initial value of clay percentage in sediment mixture. The values of flow parameters listed in the legends of also correspond to those at test start. however shows the concurrently measured data of q
sc,i
, flow and bed surface profiles. The bed shear stress was computed as , where
= specific water weight, R
b
= hydraulic radius with respect to bed which was computed as per Einstein's procedure (Garde and Ranga Raju Citation2006) and S
f
= friction slope. The average value of flow depth along the test section was used to determine R
b
. Similarly, the concurrently observed water surface profile was used for determination of S
f
.
Figure 2 Variation of detachment rate with bed shear stress (a) clay-gravel mixture and (b) clay-sand-gravel mixture
4 Analysis of experimental data on suspended load transport
4.1 Active bed layer and its thickness
The sediment transport rates measured herein corresponded to a degrading bed of non-uniform sediments. The sediment particles present on the bed and the flow get continuously exchanged during the processes of sediment detachment and transport. This exchange is considered to be limited to a certain thickness on top bed surface. This thickness would depend upon sediment size, bed form characteristics and flow characteristics. This layer (thickness) of the bed material through which the exchange of sediment particles would occur is termed Active Bed Layer (ABL). The bed material below ABL is termed as substrate. The percentages of different size fractions, namely P c , P s and P g in the sediment mixture concurrent to the time of suspended load transport rate observation were determined based on the ABL concept, as explained below.
The ABL thickness is determined as (Jain and Kothyari Citation2009)
4.2 Variation of ABL composition
The composition of ABL is altered because of differential transport rates of individual size fractions of the bed material. For degradation, the fraction of ABL at the top surface was eroded. The volume of various size fractions remaining in ABL after the degradation were computed using a grain sorting equation as
The value of Δt = time interval between two consecutive observations made for the bed and water surface profiles while Δx = length of test section used in computations. The location k was considered to coincide with start of the test section while location k + 1 was considered to coincide with end of the test section. Thus values of ,
and
are equal to zero at location k as sediment was not re-fed and the flume was non-circulatory,
,
and
were considered to be equal to their measured values at the channel outlet because no deposition of sediments was noticed between the end of the test section and the channel outlet. Likewise, the observed values of A along the test section were used in the computations. The transport rates observed in terms of dry weight were converted into corresponding volumetric rate by making use of the known value of the specific weights of different size fractions.
Next the new thickness of ABL was computed at the time level. A part of the substrate now joins ABL. Its thickness
joining ABL at the spatial node k was computed as (Singh et al.
Citation2004)
4.3 Rate of suspended load transport
The assessment of detachment and transport rate of cohesionless sediments can be determined by methods available in the literature (Garde and Ranga Raju Citation2006) from knowledge of grain density, size and gradation, flow and fluid parameters. As already explained, for quantifying the transport rates of cohesive sediments, first the values of and P
g
in the bed material were computed using EquationEqs. (1)
to Equation(4)
. The concurrent value of bed shear stress was also determined using the computed friction slope from observed water surface profiles.
As per Samaga et al. Citation(1986), the suspended load transport rate for cohesionless uniform bed material can be computed by using a relationship of functional form
4.4 Procedure for computation of qs,i
-
Determine value of arithmetic mean size d a of bed material mixture.
-
Determine value of τ c for size d a using Shields’ criterion.
-
Compute
-
Calculate
and
-
Compute value of
-
Compute
-
Compute
-
Determine value of
Figure 3 Variation of clay transport rate with bed shear stress for clay-gravel and clay-sand-gravel mixtures
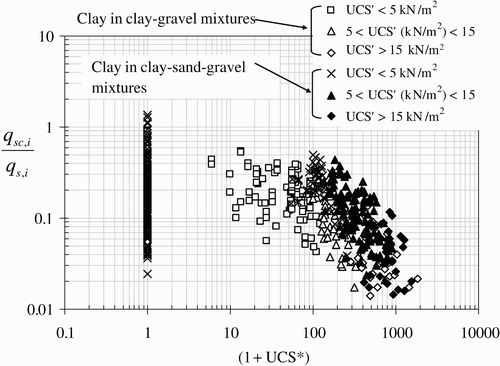
The effect of shear strength of cohesive sediments on the suspended sediment transport rate was studied by plotting the variation of UCS′ with the corresponding observed value of (). Here UCS′ =
UCS. In , the data are classified as per three ranges of the UCS′ values. It is noticed that the ability of the cohesive sediment to resist erosion increases with an increase in UCS of the sediment mixtures.
Figure 4 Variation of clay transport rate with UCS′ for clay-gravel and clay-sand-gravel mixtures
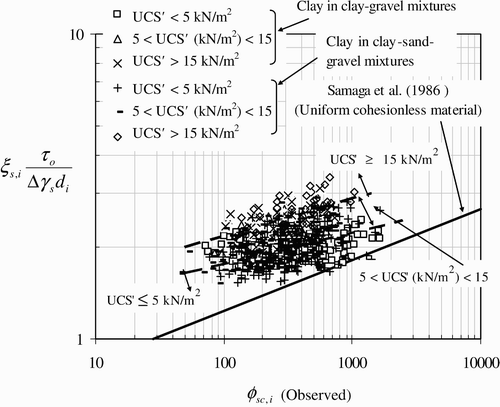
Similar results as described above have also been reported by Kamphuis and Hall Citation(1983) in the context of erosion of clay-silt-sand mixtures. Similarly, Robinson and Hanson Citation(1995) observed the headcut advance rate to decrease with an increase in UCS values of cohesive sediment consisting of clay-silt-sand mixtures. The zones of various UCS′ values are shown by dotted lines as a few data encroached into neighboring zones for high values of P c and flow shear stress.
5 Development of relationship for suspended load transport
5.1 Dimensional considerations
An examination of analytical and semi-theoretical approaches on suspended load transport of cohesionless sediments reveals that their transport rate is a function of bed shear stress and particle size only. However, for cohesive sediments, the transport rate due to detachment is in addition a function of clay percentage, dry density, or unconfined compression strength because of the physico-chemical properties. Thus, the functional form can be written as q sc,i
The parameters P c , C u , θ c , θ sh , Δγ s , d a can be expressed into dimensionless form as (Ansari et al. Citation2002, Citation2003)
Note that the terms C
* and θ* are improved indicators of the cohesiveness of sediment mixtures consisting of fractions of clay, silt, sand and gravel as these values were derived by giving weightages to the values of C
u
and θ
c
according to the percentage of clay content. Similarly, UCS* is considered to appropriately explain the mechanical behavior of cohesive sediments originating from different hydro-geological regions and therefore having variable physico-chemical characteristics (Kothyari and Jain 2009). UCS* is also considered to account for the scaling effects related to the behavior of clay material. Thus, EquationEq. (9) reduces to
The dimensionless parameters and
are combined here with the assumption that their influence can be investigated using the ratio
.The range of
covered by the present data is small i.e. from 1.54 to 2.12. As
did not fully explain the variation in
, it was dropped from the further analysis and the new functional relationship for q
sc,i
is written as
It is worthwhile to use the variable instead of
so that
while
. Similarly the variable
is used instead of UCS* to account for both hard (UCS* > 0) and soft (UCS* = 0) consistencies of cohesive sediments. The functional relationship of EquationEq. (15)
allows for developing a method to compute the suspended load transport rate caused by the detachment of the cohesive sediment mixture. The value of
to be used in EquationEq. (15)
is determined by using an appropriate relationship for suspended load transport of the cohesionless sediment mixture. As mentioned previously the relationship of Khullar Citation(2002), and Khullar et al.
Citation(2009) is used to estimate
herein as it computes suspended load transport rate of very fine sediments (wash load) as well.
Note that appreciable differences have been observed between the process of detachment and transport of cohesionless and cohesive sediments. However, no data other than collected herein are available. These data have revealed that is inversely proportional to
() and
is inversely proportional to
as well if UCS*> 0 (). However, for a few points in and
while P
c
was negligibly small (1 to 1.5%).
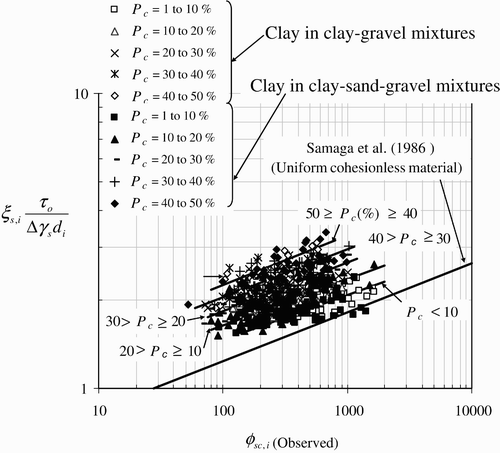
Figure 5 Variation of with
for clay-gravel and clay-sand-gravel mixtures
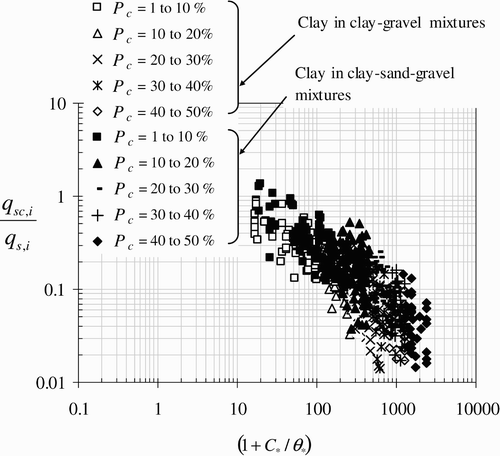
Figure 6 Variation of with
for clay-sand-gravel and clay-sand-gravel mixtures
A number of trials aimed to develop a satisfactory relationship for explaining the variation of with a change of
and
, as shown in for suspended load transport of clay in clay-gravel and in clay-sand-gravel mixtures. A compact and well distributed scatter of data around the line of agreement in may be noted.
Figure 7 Variation of suspended load transport parameter with bed shear stress for clay-gravel and clay-sand-gravel mixtures
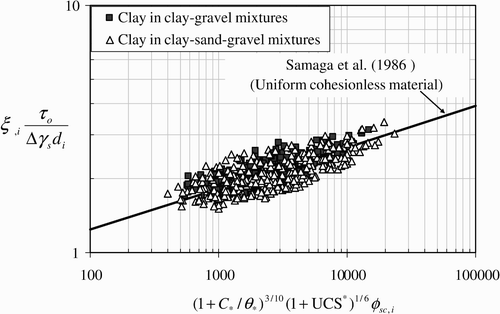
Further, the following relation is proposed to compute suspended load transport rate of clay detached by flow from clay-gravel mixture and from clay-sand-gravel mixture
5.2 Computational procedure
-
Compute the temporal variation in bed material composition using the formulations for ABL with EquationEqs. (1)
-
Determine size d a of bed material using corresponding weightages of gravel size, sand size and clay size and compute
-
Compute
-
Compute value of
-
Compute suspended load transport rate q sc,i as
To validate the proposed relationship and proposed method for the determination of q sc,i the discrepancy ratio R i and standard deviation σ are computed (Yang et al. Citation1996) as
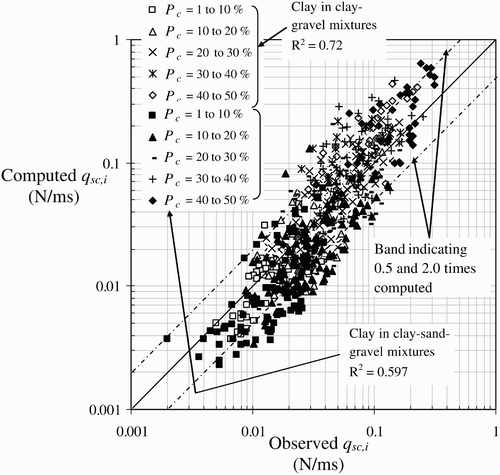
Table 3 Comparison between computed and observed value of suspended load transport rates
Note from that values are estimated by the proposed method with a maximum error band of 0.5 to 2 times the observed values for about 87% of data for the clay-gravel mixture and for about 67% of the data for clay-sand-gravel mixtures. However, the mean of the discrepancy ratio values is close to unity for both types of the cohesive sediment mixtures.
To further check the goodness of fit of the proposed method, the computed values of the suspended load transport rate are plotted against the corresponding observed suspended load transport rates as shown in , which reveals that the proposed method produces results with a maximum error of about two folds for more than 80% of the total data. The scatter of results by the proposed method as indicated by albeit is large with R 2 = 0.72 for data of clay-gravel mixture, and R 2 = 0.597 for clay-sand-gravel mixture, but acceptable in the context of similar results generally reported in the literature on sediment transport studies (Yang et al. Citation1996, Almedeij and Diplas Citation2003). Only one type of clay was however used in the present experiments. Additional work is therefore required using different types of clay in the cohesive sediment mixture and thus simulating field conditions more realistically.
Figure 8 Observed versus computed suspended load transport rate of clay for clay-gravel and clay-sand-gravel mixtures
It is significant to note that in the absence of cohesion, the proposed relation for suspended load transport rate transforms to that of Khullar et al. Citation(2009) for suspended load transport rate of cohesionless sediment mixtures. Several other dimensionless groups were also used for studying the variations in q sc,i /q s,i . Only the best results obtained are reported above.
6 Conclusions
Experiments were conducted to study the suspended load transport rate caused by the detachment of cohesive sediment beds made up of clay mixed in various proportions with uniform and non-uniform cohesionless sediments. Two types of sediment mixtures were used, namely clay mixed in proportions initially varying from 10 to 50% by weight, with fine gravel and clay mixed in the same proportions with fine sand and fine gravel, each having an equal proportion in the mixture. Observations indicate the bed material was detached by flow in the form of flakes if the bed material contained more than 20% clay by weight, and for further higher percentages of clay (40% or more), the detachment occurred in the form of aggregates of irregular geometry and varying sizes. While moving in the flow, the flakes and aggregates immediately collapse into their constituent parts and the clay part is transported as suspended sediment. The proportion of clay fraction in the bed material mixture was found to significantly affect the rate of suspended load transport.
Based on dimensional considerations the functional forms of the relationship were derived to compute the transport rate of clay moving in suspension by detachment from clay-gravel mixture and clay-sand-gravel mixture and an equation was developed for its estimation. The significant reduction in the transport rate of suspended load that occurs in the presence of cohesion (i.e. clay) in the mixture of bed material is amply reflected by the present data. In the absence of cohesion in the mixtures, the proposed relation reduces to the method of Khullar et al.
Citation(2009) which was used for the computation of as this method is applicable to estimate suspended load transport rate of very fine sediment (wash load) as well.
Notation
| ABL | = |
Active bed layer |
| B | = |
Flume width |
| C cav | = |
Suspended sediment concentration |
| C u | = |
Cohesion at optimum moisture content |
| C * | = |
Dimensionless clay content |
| d | = |
Sediment size |
| d a | = |
Arithmetic mean size |
| d 50 | = |
Median size |
| e | = |
Void ratio |
| h | = |
Flow depth |
| i b | = |
Proportion of sediment size fraction d i of sediment bed |
| i s q s,i | = |
Suspended load transport rate of size fraction d i |
| N | = |
Total number of observations |
| P c | = |
Clay percentage in bed material at time of measurement |
| P co | = |
Initial percentage of clay in sediment bed |
| P g | = |
Gravel percentage in bed material at time of measurement |
| P s | = |
Sand percentage in bed material at time of measurement |
| Q bc | = |
Volumetric rate of bed load discharge of cohesive sediment bed |
| Q sc | = |
Volumetric rate of suspended load discharge of cohesive sediment bed |
| q s | = |
Suspended load transport rate of cohesionless sediment by weight per unit width |
| q s,i | = |
Suspended load transport rate of a size fraction of cohesionless sediment |
| q sc,i | = |
Suspended load transport rate of clay |
| q sc,mi | = |
Computed suspended load transport rate of clay |
| R i | = |
Discrepancy ratio |
| R¯ | = |
Average discrepancy ratio |
| R b | = |
Hydraulic radius with respect to channel bed |
| R¯ d | = |
Average discrepancy ratio based on the difference |
| S f | = |
Friction slope |
| T b | = |
Thickness of active bed layer |
| U | = |
Mean velocity of flow |
| UCS | = |
Unconfined compressive strength of cohesive sediments |
| UCS′ | = |
Unconfined compressive strength at given time during run defined as |
| UCS* | = |
Dimensionless unconfined compressive strength defined as |
| V | = |
Volume of sediment in modified ABL |
| W | = |
Antecedent moisture content |
| z | = |
Channel bed elevation |
Greek symbols
| γ d | = |
Dry density of sediment bed |
| γ s | = |
Specific weight of sediment |
| γ w | = |
Specific weight of water |
| τ c | = |
Critical shear stress for cohesionless sediment |
| τ cc | = |
Critical shear stress for cohesive sediment |
| τ o | = |
Average shear stress of flow |
| Δp i | = |
Percentage of sediment in ABL of size d i |
| Δx | = |
Computational spatial step |
| Δt | = |
Computational time step |
| σ | = |
Standard deviation of computed result |
| φ s,i | = |
Dimensionless suspended load transport parameter for cohesionless sediment |
| φ sc,i | = |
Dimensionless suspended load transport parameter for clay |
| θ c | = |
Angle of internal friction for cohesive sediment |
| θ sh | = |
Angle of repose or internal friction for cohesionless sediment |
| θ* | = |
Dimensionless angle of internal friction for cohesive sediment mixture |
| λ | = |
Porosity of sediment bed material |
| ξ s,i | = |
Sheltering-exposure-interference factor |
References
- Aberle , J. , Nikora , V. and Walters , R. 2004 . Effect of bed material properties on cohesive sediment erosion . J. Marine Geology , 207 : 83 – 93 .
- Almediej , J. H. and Diplas , P. 2003 . Bed load transport in gravel-bed streams with unimodal sediment . J. Hydraulic Engng. , 129 ( 11 ) : 896 – 904 .
- Ansari , S. A. , Kothyari , U. C. and Ranga Raju , K. G. 2002 . Influence of cohesion on scour around bridge piers . J. Hydraulic Res. , 40 ( 6 ) : 717 – 729 .
- Ansari , S. A. , Kothyari , U. C. and Ranga Raju , K. G. 2003 . Influence of cohesion on scour under submerged circular vertical jet . J. Hydraulic Engng. , 129 ( 12 ) : 1014 – 1019 .
- Black , K. S. , Tolhurst , T. J. , Paterson , D. M. and Hagerthey , S. E. 2002 . Working with natural cohesive sediments . J. Hydraulic Engng. , 128 ( 1 ) : 2 – 8 .
- Borah , D. K. , Alonso , C. V. and Prasad , S. N. 1982 . Routing graded sediments in stream formulations . J. Hydraulic Engng. , 108 ( 12 ) : 1486 – 1503 .
- Briaud , J. F. , Ting , C. K.F. , Chen , H. C. , Cao , Y. , Han , S. W. and Kwak , K. W. 2001 . Erosion function apparatus for scour rate predictions . J. Geotechnical Geo-environmental Engng. , 127 ( 2 ) : 105 – 113 .
- Einstein , H. A. 1950 . “ The bed load function for sediment transportation in open channel flows ” . In Technical Bulletin 1026 , Washington DC, , USA : United States Department of Agriculture .
- Garde , R. J. and Ranga Raju , K. G. 2006 . Mechanics of sediment transport and alluvial stream problems , New Delhi, , India : New Age . 3rd ed
- Hanson , G. J. 1996 . Investigating soil strength and stress-strain indices to characterize erodibility . Trans. ASAE. , 39 ( 3 ) : 883 – 890 .
- IS . 1970 . Classification of soils for general engineering purposes , New Delhi, , India : IS 1498. Bureau of Indian Standards .
- IS . 1975 . Determination of in-place density by core-cutter method , New Delhi, , India : IS 2720, Part 29. Bureau of Indian Standards .
- IS . 1991 . Determination of shear strength by unconfined compression method , New Delhi, , India : IS 2720, Part 10. Bureau of Indian Standards .
- Jain , R. K. 2008 . “ Influence of cohesion on detachment and transport of clay-sand-gravel mixtures ” . In Ph.D. Thesis , Roorkee, , India : Dept. Civil Engineering, Indian Institute of Technology .
- Jain , R. K. and Kothyari , U. C. 2009 . Cohesion influences on erosion and bed load transport . Water Resources Research , (in press)
- Kamphuis , J. W. and Hall , K. R. 1983 . Cohesive material erosion by unidirectional current . J. Hydraulic Engng. , 109 ( 1 ) : 39 – 62 .
- Karim , M. F. and Kennedy , J. F. 1982 . “ IALLUVIAL: A computer-based flow and sediment routing model for alluvial stream and its application to Missouri river ” . In IIHR Report No. 250 , Iowa City IA : The University of Iowa .
- Khullar , N. K. 2002 . “ Effect of wash load on transport of uniform and non-uniform sediments ” . In Ph.D. Thesis , Roorkee, , India : Dept. Civil Engineering, Indian Institute of Technology .
- Khullar , N. K. , Kothyari , U. C. and Ranga Raju , K. G. 2009 . “ Suspended wash load transport of non-uniform sediments ” . In J. Hydraulic Engng , ASCE . (under revision)
- Klages , M. G. and Hopper , R. W. 1985 . Clay minerals in northern plains coal overburden measured by X-Ray diffraction . Am. J. Soil Science Soc. , 46 : 415 – 419 .
- Kothyari , U. C. and Jain , R. K. 2008 . Influence of cohesion on incipient motion condition of sediment mixtures . Water Resources Research , 44 ( 4 ) : 1 – 15 .
- Mazurek , K. A. , Rajaratnam , N. and Sego , D. C. 2001 . Scour of cohesive soil by submerged circular turbulent impinging jets . J. Hydraulic Engng. , 127 ( 7 ) : 598 – 606 .
- Mazurek , K. A. , Rajaratnam , N. and Sego , D. C. 2003 . Scour of a cohesive soil by submerged plane turbulent wall jets . J. Hydraulic Res. , 41 ( 2 ) : 195 – 206 .
- Mitchener , H. and Torfs , H. 1996 . Erosion of mud-sand mixtures . J. Coastal Engng. , 29 : 1 – 25 .
- Mostafa , T. S. , Imran , J. , Chaudhry , M. H. and Khan , I. B. 2008 . Erosion resistance of cohesive soils . J. Hydraulic Res. , 46 ( 6 ) : 777 – 787 .
- Parchure , M. T. and Mehta , A. J. 1985 . Erosion of soft cohesive sediments . J. Hydraulic Engng. , 111 ( 10 ) : 1308 – 1326 .
- Partheniades , E. 1965 . Erosion and deposition of cohesive soils . J. Hydraulics Div. , 91 ( 1 ) : 105 – 139 . ASCE
- Parker , G. 1990 . Surface based bed load transport relation . J. Hydraulic Res. , 28 ( 4 ) : 417 – 436 .
- Peerless , S. J. 1967 . Basic fluid mechanics , Oxford NY : Pergamon Press .
- Raudkivi , A. J. 1990 . Loose boundary hydraulics , New York, , USA : Pergamon Press . 3rd ed
- Robinson , K. M. and Hanson , G. J. 1995 . Large scale headcut erosion testing . J. Agriculture Engng. , 38 ( 2 ) : 429 – 434 . ASAE
- Samaga , B. R. , Garde , R. J. and Ranga Raju , K. G. 1986 . Suspended load transport of sediment mixtures . J. Hydraulic Engng. , 112 ( 11 ) : 1019 – 1035 .
- Singh , A. K. , Kothyari , U. C. and Ranga Raju , K. G. 2004 . Rapidly varying transient flows in alluvial rivers . J. Hydraulic Res. , 42 ( 5 ) : 473 – 486 .
- Yang , C. T. , Molinas , A. and Wu , B. 1996 . Sediment transport in the Yellow River . J. Hydraulic Engng. , 122 ( 5 ) : 237 – 244 .
- Zreik , D. A. , Krishnappan , B. G. , Germaine , J. T. and Madsen , O. S. 1998 . Erosional and mechanical strength of deposited cohesive sediments . J. Hydraulic Engng. , 124 ( 11 ) : 1076 – 1085 .