
ABSTRACT
Flood waves caused by the failure of dams can result in disastrous consequences to the downstream region, particularly in the case of cascade reservoirs. However, if an intermediate dam in the cascade reservoirs remains intact and upright in the presence of the incoming dam-break wave, it can retard the dam-break flow. In this study, flume experiments with cascade reservoirs were conducted to investigate the retarding effects of the intermediate intact dam on dam-break flow. Two patterns of dam-break flow overtopping the intermediate intact dam, i.e. the leap pattern and overflow pattern, were observed. The results reveal that the retarding effects of the dam are primarily affected by the ratio of the water depth in front of the dam to the dam height; when the ratio is less than 1/2, the retarding effects are significant.
1 Introduction
Dam-break flow often causes catastrophic damage to life and property downstream, and considerable attention has been paid to this problem. Theoretical studies of dam-break flow date back to Ritter (Citation1892), who derived a theoretical solution of the free surface profile evolution for the instantaneous dam-break flow problem in a horizontal and frictionless channel with a rectangular cross-section. Considering the hydraulic resistance effect, Dressler (Citation1952) improved the theoretical solution of the same problem. Considering the wet-bed condition downstream of the dam, Stoker (Citation1957) extended the Ritter solution. Hunt (Citation1984) derived a perturbation solution for the dam-break flow under the condition of finite-length reservoirs. Chanson (Citation2006) developed the Ritter solution to the case of dam-break flow over a smooth sloping bed. These theoretical solutions can accurately describe the characteristics of dam-break flow. However, they can only resolve several idealized cases, and thus experimental studies are required. Numerous experiments on dam-break flows were performed to investigate wave propagation characteristics and hydraulic parameters such as free surface profiles and velocity fields under different initial and boundary conditions (Cochard & Ancey, Citation2007; Eaket, Hicks, & Peterson, Citation2005; Kocaman & Ozmen-Cagatay, Citation2012; LaRocque, Imran, & Chaudhry, Citation2013; Orendorff, Rennie, & Nistor, Citation2011; Ozmen-Cagatay, Kocaman, & Guzel, Citation2014; Soares-Frazão, Citation2007). In addition, some experimental studies on the impact force of the dam-break flow on downstream structures were conducted (Chen, Xu, Deng, Xue, & Li, Citation2014; Lobovský, Botia-Vera, Castellana, Mas-Soler, & Souto-Iglesias, Citation2014). Recently, the cascade reservoir system has been a mainstream method of hydropower development, and thus the safety of cascade reservoir systems in valleys is particularly important. When the upstream dams among the cascade reservoirs break, the downstream dams risk collapse upon the impact of the dam-break flow, which causes intensified threats to the downstream-dam security (Cao, Huang, Pender, & Liu, Citation2014; Xu, Chen, Xue, & Niu, Citation2012; Xue et al., Citation2011). On many occasions dams do not break; instead, they retard the dam-break flow and reduce the threats to the others. However, to our knowledge, these retarding effects have not been studied and thus the conditions of their occurrence remain unknown.
In this study, flume experiments were conducted to investigate these retarding effects of the intermediate intact dam on the dam-break flow in cascade reservoirs. An intermediate dam between upstream and downstream dams was set up as intact and upright in the experiments. The effects of the intermediate intact dam on the dam-break flow were obtained using high-resolution digital cameras and high-precision pressure sensors.
2 Experimental configuration
The dam-break experimental set-up was built and installed at the State Key Laboratory of Hydraulics and Mountain River Engineering of the Sichuan University. The physical model consisted of a smooth rectangular cross-section flume, three dams, and a pool, as shown in . A smooth rectangular cross-section flume with inner dimensions of 20.0 × 0.5 × 1.0 m was used, and the bottom slope of the flume was set as 12° to reasonably accommodate three reservoirs in the limited testing space. The flume was made of transparent glass with a steel frame for visual observation. The dam spacing of the three dams was 7.8 m. The upstream and downstream dams were represented by a flat plate, which was 0.6 m long, 0.5 m wide and 0.1 m thick. The cross-section dimensions of the intermediate intact dam were designed following the standard of the gravity dam, and its height (D) was determined depending on experimental scenarios (). Four high-precision digital pressure sensors were installed on the centreline of the downstream dam vertically and labelled as Pi (i = 1, 2, 3, 4) (). Note that the centre of sensor P4 was located approximately 0.01 m above the dam bottom because the pressure sensor itself was 0.02 m in diameter. Furthermore, two high-resolution digital cameras were placed outside of the intermediate intact dam and downstream dam to record the propagation process of the dam-break flow in the two reservoirs.
Figure 1 Dimensions (in m) of the experimental set-up: (a) side view, (b) plan view
Figure 2 Schematic cross-section dimensions of the intermediate dam (unit: m)
Figure 3 Front view showing the locations of pressure sensors on the downstream dam (unit: m)
During the tests, when the upstream dam instantaneously and completely collapsed, the water in the reservoir poured down in a notably short time. The dam-break flow propagated downstream along the flume, overtopped the intermediate intact dam, continued to propagate and eventually hit the downstream dam. The time evolution of pressure loads on the downstream dam varied with different heights of the intermediate intact dams and different initial water depths in front of the three dams. The dam height D was selected as 0 (the dam was removed), 0.20, 0.30, 0.40, 0.50 and 0.60 m; the initial water depth h in front of the dam was selected according to the dam height D; the initial water depth hu in front of the upstream dam was set from 0.10 m to 0.30 m with 0.05 m step; the initial water depth hd in front of the downstream dam ranged from 0.10 m to 0.50 m with 0.10 m step. Details of the test cases are shown in . In this study, the upstream dam was imitated by the flat plate hinged to the bottom of the flume by two stainless-steel hinges. A removable bar was placed on the top of the plate to fix it. When the bar was removed, the plate rapidly fell under hydrostatic pressure, and the dam-break condition was triggered. Therefore, an identical critical value of the collapse of the upstream dam can be guaranteed for identical water depths in the upstream reservoir. The experiments were repeated up to four times, and the averaged pressure loads were obtained to ensure the reasonable accuracy and credibility of the measurements for each test case. For example, in the test case with D = 0.40 m, hu = 0.30 m, h = 0.40 m, and hd = 0.30 m, the time evolution of the pressure loads for three repeated tests and the mean pressure loads are shown in . Two representative pressure loads, i.e. the first two peak pressure loads, were selected from the four curves in each plot for the error analysis. The result shows that the errors of the mean pressure of the first and second peak pressures were within ± 6% and ± 10%, respectively.
Figure 4 Time evolution of pressure loads from all four pressure sensors for three repeated tests and the mean (D = 0.40 m, hu = 0.30 m, h = 0.40 m, hd = 0.30 m): (a) P1, (b) P2, (c) P3, (d) P4
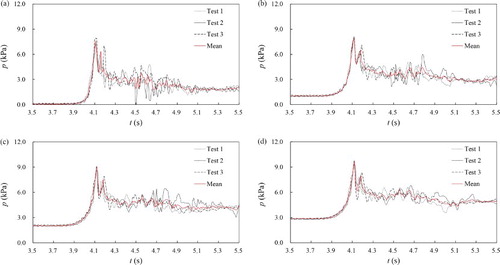
Table 1 Experimental scenarios with different heights of intermediate dam and initial water depths
3 Two patterns of dam-break flow overtopping the intermediate intact dam
The experiments were performed to simulate the process of the dam-break flow overtopping the intermediate intact dam. The water depths in front of the upstream and intermediate intact dams and the height of the intermediate intact dam significantly affect the evolution of the dam-break flow. The dimensionless parameter α is the ratio of the water depth in front of the intermediate intact dam to the dam height. For various α, two typical patterns were observed when the dam-break flow overtopped the intermediate intact dam: the leap pattern () and overflow pattern ().
Figure 5 Snapshots of the leap pattern
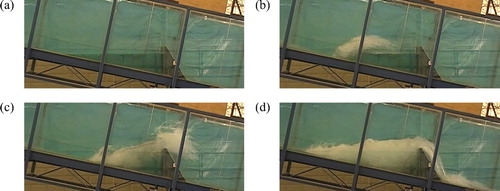
Figure 6 Snapshots of the overflow pattern
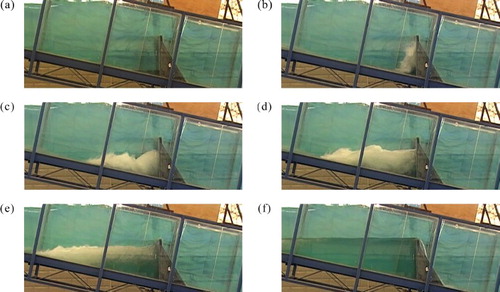
The leap pattern occurred when the dam was lower, or the dam was higher but the water depth in the upstream reservoir was also higher, (viz. α was relatively larger), e.g. D = 0.40 m, hu = 0.20 m, and α = 0.75, as shown in a. After the upstream dam failed, the dam-break flow propagated along the flume, entered the reservoir of the intermediate intact dam, and was blocked by the still water and the dam (b). First, parts of the dam-break flow leapt over the intermediate intact dam in the shape of surges because of the inertia effect, and the remainder was retarded in the reservoir, as indicated in c. Then, parts of the dam-break flow in the reservoir repeatedly leapt over the dam in the shape of surges with violent turbulence and distinct air entrapment, as shown in d. Finally, some dam-break flow remained stuck in the reservoir. The overflow pattern occurred when the dam was higher and when both the water depth in the upstream reservoir and α relatively small, e.g. D = 0.60 m, hu = 0.15 m, and α = 0.17, as shown in a. When the dam-break flow was fully blocked by the intermediate intact dam and water in the reservoir (b), it bounced back towards the upstream (c); then, the back flow developed into the plunging breaker and formed new surge propagation, which was accompanied with sufficient surface mixing with the air entrapment in the reservoir (d). In the process, the turbulence gradually weakened, with the reservoir water level increased (e). Finally, a stable overflow appeared on the intermediate intact dam when the water level was higher than the dam crest (f). Similarly, parts of the dam-break flow remained in the reservoir. Therefore, the evolving pattern of the dam-break flow in the flume is affected, and the flow volume decreases. The obvious delay and subduction function is attributed to the retarding effects of the intermediate intact dam.
4 Characteristics of the retarding effects of the intermediate intact dam on the dam-break flow
As explained in the previous section, the process of the dam-break flow overtopping the intermediate intact dam can be classified into two distinct patterns, which accordingly affect the pressure loads on the downstream dam. Therefore, two dimensionless parameters T and β were used to study the characteristics of the time evolution of the impact pressure. Time t is multiplied by 0.1 to obtain the dimensionless time T = 0.1t
, and pressure load p is divided by the hydrostatic pressure at the bottom of the downstream reservoir (
) to define the relative pressure β =
, where 0.1 is a coefficient to narrow the variable range, and g and ρ are the gravity acceleration and mass density, respectively. compares the time evolution of relative pressure loads obtained by the four sensors when the intermediate intact dam was removed (a), and the intermediate intact dam was reserved (b and c) in the case of the constant water depths in front of the upstream and downstream dams.
Figure 7 Time evolution of relative pressure loads for different cases: (a) intermediate dam removed (D = 0, hu = 0.20 m, hd = 0.30 m), (b) leap pattern (D = 0.40 m, hu = 0.20 m, h = 0.30 m, hd = 0.30 m), (c) overflow pattern (D = 0.60 m, hu = 0.20 m, h = 0.10 m, hd = 0.30 m)
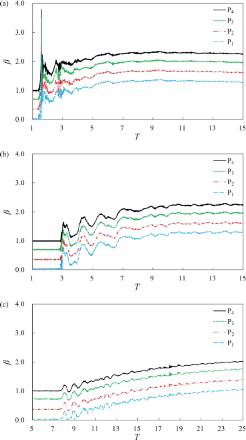
It can be noticed that the four sensors recorded identical periodic fluctuations of the pressure loads. When the dam-break flow propagated along the flume and hit the downstream dam, the pressure loads first sharply increased. Then, the dam-break flow wave was gradually attenuated, and the pressure loads tended to stabilize. The highest peak is recorded by bottom sensor P4, which is the sensor that receives the full impact, whereas the pressure loads on other sensors are provided by the run-up of the dam-break flow.
Comparing b and c with a, we can deduce that the number of pressure load peaks slightly increases, while the peak value of the pressure loads significantly decreases when the dam maintains the original place. In other words, the impact times of the dam-break flow on the downstream dam slightly increase, whereas the impact strength obviously weakens. Thus, the intermediate intact dam has remarkable retarding effects on the dam-break flow. The pressure loads also decrease more sharply in the overflow pattern (c) than in the leap pattern (b). Hence, with identical water depths in front of the upstream and downstream dams, the retarding effects in the overflow pattern are larger than that in the leap pattern, i.e. the former would more likely protect the downstream dam from the threat of dam-break flow.
The first peak values of pressure loads that were recorded by the four sensors in the first dam-break wave, which vary for different ratios of α, were also studied to analyse the retarding effects. For example, consider D = 0.60 m for which the change of β and α for different water depths in front of the upstream and downstream dams is shown in . The corresponding value for the same scenario without of the intermediate dam is also provided in this figure. A dashed line (α = 0.5) is drawn to discriminate two different regions. When α > 0.5, the values of β significantly increase (a–d), whereas when α ≤ 0.5, values β vary if the water depth in front of the downstream dam is low (e.g. hd = 0.10 m; a and c) or almost invariable if the water depth in front of the downstream dam is high (e.g. hd = 0.30 m; b and d). For each sensor except some individual cases, values β are smaller for the scenario with an intermediate intact dam than those without one (a–d). In addition, when the water depth in front of the downstream dam is low (e.g. hd = 0.10 m), the variation of β for the sensors below (P4) and around the water surface (P3) is consistent, whereas the change of data points above the water surface (P1–P2) is not identical with them, as shown in a–d. Thus, the sensors at higher positions do not record a first impact event, and the peak values for these sensors are actually obtained later in time at the arrival of the secondary wave.
Figure 8 Relation of β and α for different water depths in front of the upstream and downstream dams: (a) hu = 0.15 m, hd = 0.10 m, (b) hu = 0.15 m, hd = 0.30 m, (c) hu = 0.30 m, hd = 0.10 m, (d) hu = 0.30 m, hd = 0.30 m (see Supplemental data)
Comparing β values in the presence of the intermediate dam with the basic scenario, where there is no intermediate intact dam in cascade reservoirs, the impact pressure evidently decreased, which indicates that the intermediate intact dam has retarding effects on the dam-break flow. The β value apparently increases when the overflow pattern (α ≤ 0.5) is changed to the leap pattern (α > 0.5), as shown in a and b. Thus, the retarding effects of an intermediate intact dam decrease with the changing patterns. c and d show that the retarding effects have identical characteristics even if both α ≤ 0.5 and α > 0.5 are leap patterns. In other words, the sudden decrease in retarding effects on the dam-break flow mainly depends on the ratio of the water depth (in front of the intermediate intact dam) to the dam height. The retarding effects are more remarkable for a ratio less than 1/2 than a ratio more than 1/2.
5 Conclusions
An experimental study on the retarding effects of the intermediate intact dam on the dam-break flow in cascade reservoirs was performed using high-resolution digital cameras and high-precision pressure sensors. Two patterns were observed when the dam-break flow overtops the intermediate intact dam: (1) the leap pattern, where the dam-break flow leaps over the intermediate intact dam; and (2) the overflow pattern, where the dam-break flow overflows along the intermediate intact dam, when the water level gradually increases until exceeding the dam crest. The retarding effects of the intermediate intact dam on the dam-break flow are mainly affected by the ratio of the water depth in front of the intermediate intact dam to the dam height. When the ratio is less than 1/2, the retarding effects are prominent.
In design projects, when an upstream dam is at risk of dam break, the retarding effects of downstream intact dams should be considered in conjunction with its self-security, and the water depths in front of the downstream intact dams should be reasonably determined considering the dam types and their own dam-break risk.
The reported results aimed to provide a wider perspective to the dam-break problem of cascade reservoirs. A substantial number of future work threads arise from the issues that were discussed in this manuscript. Further attention should be paid to the measurement technique and experimental set-up. Assessing the portability results by considering the scale effects is also an important task.
Supplemental data
Supplemental experimental data on pressure loads can be accessed here http://doi:10.1080/00221686.2016.1276103.
Notation
| D | = | height of intermediate intact dam (m) |
| g | = | gravity acceleration (m s−2) |
| h | = | initial water depth of intermediate intact dam (m) |
| hd | = | initial water depth of downstream dam (m) |
| hu | = | initial water depth of upstream dam (m) |
| p | = | pressure load on downstream dam (kPa) |
| Pi | = | pressure sensors on downstream dam (i = 1, 2, 3, 4) |
| t | = | time (s) |
| T | = | dimensionless time (–) |
| α | = | ratio of water depth of intermediate intact dam to dam height (–) |
| β | = | relative pressure (–) |
| ρ | = | mass density (kg m−3) |
TJHR_1276103_Supplemental_data.docx
Download MS Word (137.2 KB)Acknowledgements
The authors would like to thank Yongting Deng and Huayong Chen for assistance during the experiments.
Additional information
Funding
Related Research Data
References
- Cao, Z., Huang, W., Pender, G., & Liu, X. (2014). Even more destructive: Cascade dam break floods. Journal of Flood Risk Management, 7(4), 357–373. doi: 10.1111/jfr3.12051
- Chanson, H. (2006). Analytical solutions of laminar and turbulent dam break wave. In River Flow 2006: Proceedings of the international conference on fluvial hydraulics (pp. 465–474). London: Taylor & Francis.
- Chen, H. Y., Xu, W. L., Deng, J., Xue, Y., & Li, J. (2014). Experimental investigation of pressure load exerted on a downstream dam by dam-break flow. Journal of Hydraulic Engineering, 140(2), 199–207. doi: 10.1061/(ASCE)HY.1943-7900.0000743
- Cochard, S., & Ancey, C. (2007). Tracking the free surface of time-dependent flows: Image processing for the dam-break problem. Experiments in Fluids, 44(1), 59–71. doi: 10.1007/s00348-007-0374-3
- Dressler, R. F. (1952). Hydraulic resistance effect upon the dam-break functions. Journal of Research of the National Bureau of Standards, 49(3), 217–225. doi: 10.6028/jres.049.021
- Eaket, J., Hicks, F. E., & Peterson, A. E. (2005). Use of stereoscopy for dam break flow measurement. Journal of Hydraulic Engineering, 131(1), 24–29. doi: 10.1061/(ASCE)0733-9429(2005)131:1(24)
- Hunt, B. (1984). Dam-break solution. Journal of Hydraulic Engineering, 110(6), 675–686. doi: 10.1061/(ASCE)0733-9429(1984)110:6(675)
- Kocaman, S., & Ozmen-Cagatay, H. (2012). The effect of lateral channel contraction on dam break flows: Laboratory experiment. Journal of Hydrology, 432–433, 145–153. doi: 10.1016/j.jhydrol.2012.02.035
- LaRocque, L. A., Imran, J., & Chaudhry, M. H. (2013). Experimental and numerical investigations of two-dimensional dam-break flows. Journal of Hydraulic Engineering, 139(6), 569–579. doi: 10.1061/(ASCE)HY.1943-7900.0000705
- Lobovský, L., Botia-Vera, E., Castellana, F., Mas-Soler, J., & Souto-Iglesias, A. (2014). Experimental investigation of dynamic pressure loads during dam break. Journal of Fluids and Structures, 48, 407–434. doi: 10.1016/j.jfluidstructs.2014.03.009
- Orendorff, B., Rennie, C. D., & Nistor, I. (2011). Using PTV through an embankment breach channel. Journal of Hydro-Environment Research, 5(4), 277–287. doi: 10.1016/j.jher.2010.12.003
- Ozmen-Cagatay, H., Kocaman, S., & Guzel, H. (2014). Investigation of dam-break flood waves in a dry channel with a hump. Journal of Hydro-environment Research, 8(3), 304–315. doi: 10.1016/j.jher.2014.01.005
- Ritter, A. (1892). The propagation of water waves. Ver Deutsch ingenieur zeitschr[Berlin], Part 2, 36(33), 947–954.
- Soares-Frazão, S. (2007). Experiments of dam-break wave over a triangular bottom sill. Journal of Hydraulic Research, 45, 19–26. doi: 10.1080/00221686.2007.9521829
- Stoker, J. J. (1957). Water waves. New York, NY: Interscience.
- Xu, W. L., Chen, H. Y., Xue, Y., & Niu, Z. P. (2012). The chain of dam break in cascade reservoirs. Beijing: China Water Power Press.
- Xue, Y., Xu, W.-l., Luo, S.-j., Chen, H.-y., Li, N.-w., & Xu, L.-j. (2011). Experimental study of dam-break flow in cascade reservoirs with steep bottom slope. Chinese Journal of Hydrodynamics, 23(4), 491–497. doi: 10.1016/S1001-6058(10)60140-0