
ABSTRACT
This paper presents results from a scale model study related to the stability of dumped and placed riprap on steep slopes of 1:1.5 (vertical: horizontal) exposed to overtopping. The experiments showed that small rearrangements of the stones in placed riprap, quantified as displacements of particular stones, led to a compaction in the lower part of the riprap and to loosening in the upstream part. The riprap became unstable when the maximum displacements exceeded the size of the longest axes of the riprap stones. The experimental data were used to develop a relationship to describe the development of the displacements taking the load-history into account. The obtained results were indirectly confirmed by comparison with findings of two reports which are described in the present paper. Moreover, placing the riprap stones in an interlocking pattern resulted in five times higher critical discharges compared to randomly dumped riprap.
1 Introduction
Riprap is a common measure to protect shorelines, streambeds, river banks, dams, bridge piers and abutments as well as other hydraulic structures against erosion (e.g. Abt & Johnson, Citation1991; Abt, Thornton, Scholl, & Bender, Citation2013; Chanson, Citation2015; CIRIA, CUR, & CETMEF, Citation2007; Jafarnejad, Franca, Pfister, & Schleiss, Citation2017). It is defined as a permanent and erosion-resistant ground cover of large elements such as natural rocks or artificial elements to secure subjacent layers against the impact of hydrodynamic forces due to currents and waves. Riprap can be exposed to wave action or currents either perpendicular or parallel to the slope, and the elements forming the riprap can either be dumped or placed one by one in a specific pattern. These two construction methods define dumped riprap and placed riprap, respectively. Compared to dumped riprap, placed riprap is both more cost- and labour-intensive during construction. On the other hand, placed riprap offers specifically at steep slopes a higher stability in comparison to dumped riprap (Dornack, Citation2001).
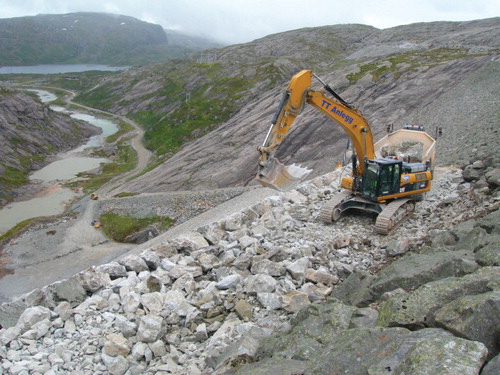
A special application of placed riprap is to protect the downstream slopes of rockfill dams against erosion due to leakage, overtopping and violent attacks (e.g. Orendorff, Al-Riffai, Nistor, & Rennie, Citation2013; Toledo, Morán, & Oñate, Citation2015). Moreover, dependent on the dam-height, a specific area of the dam downstream side may be used as spillway by specifically creating a notch in the dam (e.g. Dornack, Citation2001; Larsen et al., Citation1986). In order to protect dams, dam safety regulations in Norway prescribe to protect the downstream slope with a placed riprap built with an interlocking pattern and the stones placed with their longest axes inclined towards the dam (Fig. ; Ministry of Petroleum and Energy, OED, Citation2009). The typical downstream slopes of Norwegian rockfill dams are 1:1.5 (vertical: horizontal) corresponding to a slope of S = 0.67, which is usually covered with a single-layered placed riprap. Studies about riprap stability on such steep slopes with overtopping flows parallel to the slope are rare as most of the existing studies were carried out for milder slopes. It is against this background and the fact that many Norwegian dams need to be upgraded in the near future, including the construction or upgrade of placed riprap, that a research project was initiated to investigate the stability of placed riprap on steep slopes with the objective to improve corresponding design approaches. The project focuses on both small-scale laboratory investigations as well as large-scale field tests and further details on the project can be found in e.g. Hiller, Kjosavik, Lia, and Aberle (Citation2016), Hiller and Lia (Citation2015) and Lia, Vartdal, Skoglund, and Campos (Citation2013).
Figure 1 Reconstruction of a placed single-layer riprap on the downstream slope of the 129 m high rockfill dam Svartevatn in south-western Norway. The riprap stones are placed one by one in an interlocking pattern and form with the adjacent filter layer an erosion protection against accidental leakage and overtopping. (Photo: NTNU)
In this paper, we present results from laboratory tests related to the stability and failure mechanisms of placed riprap due to stone displacement as a consequence of overtopping. Section 2 provides an overview over existing design relationships and summarizes findings of two reports related to stone displacement due to overtopping. Section 3 describes the physical model tests of which the results are presented in Section 4 and discussed in Section 5. Geotechnical stability criteria concerning the dam structure, as for example summarized in Larsen et al. (Citation1986) and Morán and Toledo (Citation2011), are beyond the scope of this paper.
2 Riprap stability on steep slopes
Dumped and placed riprap are characterized by different failure mechanisms when being exposed to overtopping. The failure of dumped riprap is usually defined as the moment when the adjacent filter layer is exposed to the flow which occurs when the randomly placed surface layer stones are eroded (e.g. Abt & Johnson, Citation1991; Linford & Saunders, Citation1967; Peirson, Figlus, Pells, & Cox, Citation2008; Robinson, Rice, & Kadavy, Citation1998). Placed riprap, on the other hand, consists typically of a single surface layer of stones, which are placed in an interlocking pattern on top of a filter. The failure criteria for placed riprap has also been associated with filter exposure. For single-layer riprap, this means that erosion of the first riprap stone defines failure due to the exposition of the filter at this particular location. However, Dornack (Citation2001), Larsen et al. (Citation1986) and Sommer (Citation1997) reported that the erosion of single stones in a placed riprap does not necessarily result in the loss of the structural integrity of the single-layer placed riprap structure. This is due to the fact that interlocking of stones results in a bearing structure increasing the stability compared to that of a single stone. In this context, Peirson et al. (Citation2008) distinguish between “initial displacement of a single stone”, “significant rock motion” (dislocation of five rocks over a distance of more than five stone diameters) and “armour failure”, when the filter layer is exposed. In the study of Peirson et al. (Citation2008), erosion of the first stone out of placed riprap did not result in “armour failure” as their dumped and placed riprap consisted of two layers of stones. Consequently, critical conditions can be defined at the discharge when progressive (bulk) erosion occurs (Dornack, Citation2001; Larsen et al., Citation1986; Sommer, Citation1997).
The interlocking of riprap stones allows for the transfer of longitudinal forces within the placed riprap. If these forces become large enough, they can cause either sliding or rupture of the riprap layer (Dornack, Citation2001; Larsen et al., Citation1986; Siebel, Citation2007; Sommer, Citation1997). Moreover, as will be described below, the longitudinal forces can cause a compaction at the lower end of the riprap layer resulting in a loosening of the riprap in the upper part. According to Larsen et al. (Citation1986), such loosening can occur at very steep slopes and it represents a sore point in the riprap at which bulk failure may be initiated due to flow attack of the stones, which gradually lose their interlocking.
Although existing approaches for the determination of the stability of steep riprap take into account geometrical and flow boundary conditions, riprap material characteristics and fluid properties, they neglect the failure mechanism due to the combination of compaction and loosening. This may be due to the fact that most approaches have been developed for dumped riprap and slopes S < 0.2 (see e.g. the summary of Abt et al., Citation2013) for which the failure mechanism “displacement” is not of importance.
The surface layer of dumped riprap is usually parameterized by the stone density ρs, stone size d, grain size distribution, and the embankment slope S. For placed riprap an additional parameter, the packing factor, needs to be introduced to describe the quality of the placement as described further below. The flow over the riprap surface can be characterized by the Froude number F = v(gh)−0.5 with v = flow velocity, g = gravitational acceleration and h = water depth. When a riprap structure is overtopped, both v and h vary along the dam downstream slope until the flow is fully developed, meaning that F = 1 at the crest and F > 1 further downstream. However, the definition of v and h is hampered due to the rough bed conditions, requiring the definition of an arbitrary bed level. This limits the applicability of F to investigate riprap stability. An alternative way is to use a so called “Schoklitsch-type” approach by combining F and the relative submergence h/d to a stone-related Froude number Fs = q(gd3)−0.5 with q = discharge per unit width. At critical conditions (i.e. riprap failure) this Froude number becomes thus:
(1)
where qc is the critical discharge per unit width at riprap failure.
Equation (1) allows for a direct comparison of experimental data from different studies at critical conditions. Figure a shows Fs,c as a function of the slope S for different studies carried out with dumped riprap. The data in Fig. a were extracted from Abt et al. (Citation2013), who summarized experimental data of various investigations as described in the figure caption, as well as Godtland (Citation1989), Larsen et al. (Citation1986) and Peirson et al. (Citation2008). The figure shows that the stability of dumped riprap decreases significantly with increasing slope due to the destabilizing effect of gravitational forces at larger slopes (e.g. Graf, Citation1991). Moreover, the comparison of the dumped riprap data with data for placed riprap reported by Dornack (Citation2001), Larsen et al. (Citation1986) and Peirson et al. (Citation2008), shown in Fig. b, verifies that placed riprap offers a higher stability at steep slopes. In fact, the data in Fig. b show that for the slope range covered by the placed riprap studies (S > 0.125) the critical stone-related Froude number is generally Fs,c > 2 while Fs,c < 2 for the dumped riprap studies. In addition to the experimental data, Fig. b visualizes existing approaches derived for the sizing of riprap stones (excluding potential safety factors). The figure reveals differences between these approaches, which will be briefly highlighted in the following.
Figure 2 Existing data points for dumped riprap (a) and placed riprap and design curves (b). Most data are available for dumped riprap on gentle slopes. The studies by Larsen et al. (Citation1986) and Peirson et al. (Citation2008) include data of dumped and placed riprap made of the same stones and show that placed riprap is more stable than dumped riprap. aThe data summarized in Abt et al. (Citation2013) contain data points from Abt et al. (Citation1987); Abt and Johnson (Citation1991); Mishra (Citation1998); Peirson and Pells (Citation2005); Robinson et al. (Citation1998); Siebel (Citation2007); Thornton, Cox, and Turner (Citation2008); Thornton, Abt, Clopper, Scholl, and Cox (Citation2012); and Wittler (Citation1994). Note that no distinction is made in terms of stone size, density or roundness for the presented data
The placed riprap study of Dornack (Citation2001) had the objective to optimize erosion protection of spillways on small earthfill dams constructed for flood retention. The investigation was based on experiments carried out with stones of a density ρs = 2610 kg m−3, an equivalent diameter ds (diameter of a sphere having the same volume as an average stone) in the range of 0.030 m ≤ ds ≤ 0.050 m, slopes ranging from 0.29 ≤ S ≤ 0.67 and lengths covered with riprap of 3.5 m ≥ Ls ≥ 1.8 m, respectively. Based on these data, Dornack (Citation2001) developed a design equation for placed riprap applicable for 0.1 ≤ S ≤ 0.67:
(2)
with tan α = S, where α is the slope angle, and ρ is the density of water. In this equation, stabilizing friction forces due to the large inclination are indirectly taken into account by the second slope term. Equation (2) represents the lower boundary of Dornack’s experimental data and its application would result in an adequate riprap design for the boundary conditions used by Dornack (Citation2001) and Larsen et al. (Citation1986) (see Fig. b). However, the formula does not describe the data of Peirson et al. (Citation2008) (experimental parameters: two-layer riprap with 0.076 m ≤ d50 ≤ 0.109 m where d50 = median stone size, 2290 kg m−3 ≤ ρs ≤ 2640 kg m−3, 0.2 ≤ S ≤ 0.4 and 8.4 m ≥ Ls ≥ 4.2 m, respectively). The latter data points are closer to the line defined by the approach developed by Knauss (Citation1979):
(3)
which is valid in the range of 0.1 ≤ S ≤ 0.67 and was derived for stone densities of ρs = 2700 kg m−3 and a packing factor Φ ranging between 0.625 ≤ Φ ≤ 1.125 (the two values are reflected by the two curves in Fig. b). According to Scheuerlein (Citation1968), the Φ-factor is defined as the ratio of mean vertical roughness height to the mean horizontal width of the roughness elements. Developing the approach, Knauss (Citation1979) combined results from Hartung and Scheuerlein (Citation1970), Linford and Saunders (Citation1967), Olivier (Citation1967) and Scheuerlein (Citation1968). However, Peirson and Cameron (Citation2006) found that the approach by Hartung and Scheuerlein (Citation1970) was not conservative for design and revised the formula for the critical velocity accordingly. Their approach applicable for dumped riprap was further revised in Peirson et al. (Citation2008).
The packing factor Φ used in Eq. (3) is similar to a roughness density parameter, but may be difficult to determine in field situations. However, the above Φ-factor range defined by the boundaries 0.625 and 1.125, respectively, can also be expressed in terms of a packing factor (1.2 ≥ Pc ≥ 0.8, respectively), with Pc being defined by Linford and Saunders (Citation1967) and Olivier (Citation1967) according to:
(4)
where N is the number of stones per m2. Typical values for Pc range from 0.8 (stones placed on edge) to 1.2 (dumped stones), i.e. Pc is lower for a densely packed riprap compared to loosely packed or dumped riprap. Note that the placed riprap data of Dornack (Citation2001) and Larsen et al. (Citation1986) shown in Fig. b were characterized by Pc = 0.80 and Pc = 0.63, respectively, which might explain some of the deviation in Fs,c compared to the Peirson et al. (Citation2008) data for which Pc = 0.94 (assuming ds = d50 to calculate Pc).
The stability criteria outlined above neither reflect the effect of a potential compaction of the riprap layer due to flow forces nor consider a potential time-dependency of the erosion process as mentioned for example by Jafarnejad et al. (Citation2017) in their time-based failure analysis of riprap exposed to flow perpendicular to the slope. The literature review carried out in the framework of the presented research project revealed reports of Larsen et al. (Citation1986) and Sommer (Citation1997) in regard to the significance of displacements for the stability of placed single-layer riprap composed of angular quarry stones. These reports were prepared in German and have thus not necessarily been available for international researchers. Although some findings of these studies become already apparent from the above considerations, some more details are presented in the following.
Larsen et al. (Citation1986) studied the stability of both dumped and placed riprap (Fig. ). The majority of the tests with placed riprap were carried out with stones of ds = 0.074 m and Pc = 0.63 with a length of the placed riprap of Ls = 2.34 m at slopes of S = 0.125, S = 0.25 and S = 0.4. The single-layer riprap was placed below a chute section with fixed roughness elements. Larsen et al. (Citation1986) found that the successive overtopping of the riprap with increasing discharges resulted in a compaction of the downstream part of the placed riprap at slopes of S = 0.25 and S = 0.4. This compaction caused a loosening of the riprap further upstream, close to the fixed chute part. The compaction was quantified by manual measurements of the displacement Δx (i.e. stone movement in flow direction compared to the initial location) of five individual stones following each discharge step. Larsen et al. (Citation1986) normalized Δx with Li, the distance between the measured stone and the downstream fixed point of the riprap, and observed a reasonable collapse of the individual displacement curves Δxi/Li when these were plotted vs. the applied discharges. The observed maximum relative displacements of the five stones had ranges of 1.6–2.0% for S = 0.25 and 1.3–2.0% for S = 0.4.
The experiments carried out with S = 0.125, on the other hand, resulted in smaller and more evenly distributed displacements which caused no significant loosening of the riprap. Larsen et al. (Citation1986) hypothesized that in the latter case, the shear force by the overtopping water could, to a large extent, be transferred through friction into the filter layer (and hence into the embankment) while this force-transfer mechanism was not as efficient for the steeper slopes. Larsen et al. (Citation1986) recommended consequently that transverse cross-structures should be considered when designing steep ripraps to facilitate force transfer into the embankment and to limit displacements.
Sommer (Citation1997) investigated single-layer, placed riprap with ds = 0.134 m and an average packing factor of Pc = 0.77 at slopes of S = 0.25, S = 0.33 and S = 0.5 in a 4.7 m long and 0.97 m wide chute. In comparison to Larsen et al. (Citation1986), the experiments were carried out without a fixed upstream chute section. Moreover, Sommer (Citation1997) added compressed air to the flow at the inlet section to mitigate effects arising from the short flow development zone upstream of the measurement section (approx. 0.7 m). The experiments were carried out by increasing the discharge in a stepwise manner and displacements were measured following each discharge increment. Displacements were quantified with a laser displacement meter along three longitudinal profiles of 2.7 m length (measured from the downstream fixed point). These profiles covered also a drag force measurement device installed in the riprap downstream region, which was protected by a rigid fence (for the analysis of drag forces see Sommer, Citation1997). Note that further details on individual displacement measurements as well as the loading history in terms of q and time reported by Sommer (Citation1997) were available from one of the authors’ project-thesis (Aberle, Citation1995).
Sommer (Citation1997) reported difficulties to reach critical conditions for the tested ripraps, as they withstood the maximum possible discharge in the flume of q ≈ 0.5 m2 s−1, i.e. for these experiments Fs,c > 3.25. The riprap remained stable due to the interlocking mechanism even if parts of the filter layer were eroded or if a gap developed at the upstream end of the riprap. In fact, failure in the experiments could only be achieved through manual manipulation of the riprap. The maximum relative displacements Δxi/Li found in the experimental series ranged between 0.5–2.4% for S = 0.33 and 0.6–1.7% for S = 0.25.
Based on the experimental results, Sommer (Citation1997) derived a three step recommendation for the design of placed riprap taking into account stone displacements. The first step includes the determination of the required stone diameter for a given discharge and embankment slope using Eq. (1) and the equation:
(5)
Equation (5) may be interpreted as an intermediate approach between the approaches by Dornack (Citation2001) and Knauss (Citation1979) (Fig. b). Even though Sommer (Citation1997) noted the gradual development of displacements in his tests, the time-dependency of the displacements was not incorporated in the design approach. In step 2, Sommer (Citation1997) recommended the limitation of the riprap compaction to 0.5ds, i.e. Δxi/ds ≤ 50% through the construction of fixed cross-structures in the placed riprap. The corresponding allowable riprap length Ls upstream of such a cross-structure can be determined from the relationship:
(6)
We note that the third step included geotechnical considerations, which are not the focus of the present paper.
It is interesting to note that the application of Eq. (6) to estimate the relative stone displacements Δxi/ds for the data presented by Dornack (Citation2001) and Peirson et al. (Citation2008) results in intervals of [94%, 158%] and [67%, 113%], respectively. The lower limits of both intervals are larger than the value Δxi/ds ≤ 50% recommended by Sommer (Citation1997), indicating that displacements may have been contributing to riprap failure, although details in regard to this issue have not been reported in these studies.
The above considerations show that stone displacements can be an important factor concerning the stability of placed riprap, especially on steep slopes. However, corresponding data are scarce and further investigation of displacements as failure mechanism requires additional data. The focus of the following sections is to determine and quantify stone displacements in placed riprap on steep slopes of S = 0.67 exposed to overtopping and to relate the displacements to discharge and time.
3 Experimental set-up and procedure
Experiments were carried out in a 25 m long, 2 m high and 1 m wide horizontal flume in the hydraulic laboratory of the Norwegian University of Science and Technology (NTNU). A conceptual 1:10 scale model of the downstream section of a dam was constructed along a 4 m long window section at the upstream part of the flume assuming Froude similarity. The base frame of the model consisted of a 0.55 m long horizontal crest and a 2.43 m long chute (along flow direction) with an inclination of 1:1.5 (S = 0.67; Fig. ). The base frame was constructed from expanded metal which was sealed by a polyethylene mat and silicon at the transitions to the flume walls. The discharge to the flume was delivered by two pipes equipped with Siemens Sitrans Mag 5000 (Nordborg, Denmark) discharge meters and controlled by valves. The model was located sufficiently downstream of the inflow section to guarantee calm flow conditions at the crest of the model dam when testing the ripraps, as described below. The upstream water level was monitored with a Microsonic mic + 340 sensor (Dortmund, Germany) located 1.6 m upstream of the crest corresponding to 3–4 times the overtopping depth at high discharges.
An automated 3D-traverse system at the top of the flume spanned the model section and allowed for the determination of coordinates of individual points along the model dam by an attached laser displacement metre with an accuracy of ± 0.1 mm in x- and y-direction and ± 1 mm in z-direction. Two Cartesian coordinate systems with the origin at the transition from the horizontal crest to the chute were defined to account for the horizontal and the sloped section, respectively (Fig. ). The x-axis of the first coordinate system xyz was aligned with the bottom of the chute while the second coordinate system (x′y′z′) was rotated through −33.7° with the x′-axis parallel to the horizontal crest. The z- and z′-coordinate described the height perpendicular to the model base frame. Two video cameras were used to provide video footage of the tests. One camera was facing the dam while the second camera was filming through the flume window.
Figure 3 Model set-up with Ls = 1.8 m and definition of the coordinate systems xyz and x′y′z′ with the origin at the break-point between the crest and the chute. The marked stones MS are placed in the middle of the flume y = y′ ≈ 0.5 m. All measures in mm, flow direction from left to right. The inclination of the riprap stones is indicated with β in the enlarged part
The tested riprap structures covered the 0.55 m long horizontal crest and a chute length Ls with a range of 0.8–1.8 m (see below for details). The adjustable downstream end of the riprap section was used to lock the riprap and constructed by an expanded metal sheet perpendicular to the chute. The downstream end of the riprap was elevated against the flume bottom to avoid backwater effects, as the focus of the investigations was on erosion of the riprap due to overtopping and not failure due to scour development at the transition to the tail water area.
The tests were carried out with both placed and dumped riprap, which were installed on a filter layer (Fig. ). The latter consisted of a geotextile and a 0.1 m thick layer of angular stones with a diameter d50,F = 0.025 m and a density of ρs,F = 3050 kg m−3. The thickness of the filter layer was chosen in agreement with the Norwegian guidelines for the construction of embankment dams (Norwegian Water Resources and Energy Directorate, NVE, Citation2012). The riprap surface layer consisted of quarry stones of rhyolite with a diameter of d50 = 0.057 m, a density of ρs = 2710 kg m−3 and an average mass of 0.24 kg. The d50 was derived from the grain size distribution (by mass) of the nominal diameter d = (abc)1/3 (Bunte & Abt, Citation2001) of 500 stones, where a, b and c denote the longest, intermediate and shortest axis of the stones, respectively. The a, b, and c axes were manually measured with a calliper and the mean values corresponded to 0.091, 0.053 and 0.038 m, respectively. The stones were angular to subangular and slightly oblong (a/b = 1.7 in average) and, although individual stones varied in size, the grain size distribution of the surface stones could be classified as uniform (d60/d10 = 1.17 with dmin = 0.041 m and dmax = 0.074 m). The friction angle was evaluated with a tilting box to 50° and 52° for the filter and dumped riprap stones, respectively.
Placed riprap was constructed manually by placing stones from down- to upstream in an interlocking pattern. For the tests with Ls = 1.8 m approximately 1200 stones were needed. The stones were placed at an angle of β ≈ 60° between the chute-bottom and the stones a-axis (see enlarged part in Fig. ) and β ≈ 90° on the horizontal crest, as these values are characteristic for existing ripraps at Norwegian dams (Hiller, Citation2016; Lia et al., Citation2013). Dumped riprap consisted of a layer with a thickness of approximately 1.5 d50 and was constructed by randomly placing the riprap stones with an arbitrary orientation and without any interlocking pattern. Placing rather than dropping and spreading the stones was necessary due to the steep slope of S = 0.67. The number of placed or dumped stones was used to determine the packing factor Pc with Eq. (4) in Table for both the placed and dumped riprap, respectively.
In the following, results from 10 experiments are presented of which eight were carried out with placed riprap (tests P01–P08) and two with dumped riprap (tests D01 and D02). Table summarizes the experimental boundary conditions for the tests. Five of the placed riprap tests were carried out with Ls = 1.8 m (P01–P04 and P08), one with Ls = 1.0 m (P05), and two with Ls = 0.8 m (P06 and P07). The tests with dumped riprap (D01 and D02) were carried out with Ls = 1.8 and 0.8 m, respectively, and served for a direct comparison of the stability of dumped and placed riprap. We note that the reason for the different riprap length Ls was to enable a direct comparison of tests P05–P07 and D02 with field tests described in Hiller et al. (Citation2016), which were carried out using 12 m wide and 3 m high test dams with riprap stones of d50 = 0.4 m. The results of this comparison will be presented in a separate paper, as stone displacement could not be determined in the field tests.
It is worth mentioning that Pc for the placed riprap varied slightly between the tests. The lower Pc values for the tests P03–P06 reflect that the experimentalists became more experienced in packing the riprap (lower Pc values in Table ). The Pc value for P07 and P08 increased again because the riprap stones were placed into the interlocking pattern without carefully choosing and placing each stone. This procedure aimed at the reduction of the effect arising through the experience in placing riprap (see below) and to reduce model effects due to manual placement compared to machine placement as described in Pardo, Herrera, Molines, and Medina (Citation2014) for concrete elements. For the present experiments, this meant that the stones were randomly picked and then placed interlocking with the neighbouring stones without further optimization measures (i.e. the stones were not put at other locations where they would have fitted better). It was the intention to achieve interlocking, but not to minimize the porosity in the model (i.e. β ≈ 60° and not β ≈ 90°) in order to construct the placed riprap as similar as in prototype conditions where the riprap stones are placed with an excavator and the selection is limited to the number of stones delivered by a truck.
In the present laboratory tests, the displacements of particular stones were determined using the aforementioned positioning system. We focused on the determination of the displacement of individual stones by measuring the position of a point marker tagged to their top instead of the determination of the positions of all stones, because a complete scan of the riprap was hampered due to shadowing of the oblong stones. The marked stones were located along the centreline (y = y′ ≈ 0.5 m) at fixed initial positions of x′ ≈ −0.2 m and x ≈ 0, 0.2, 0.6, 1.0, 1.4 and 1.8 m, respectively, for Ls = 1.8 m. For the tests with a reduced length Ls the number of marked stones was reduced so that the displacements of only four stones located at x′ ≈ −0.2 m and x ≈ 0, 0.2, 0.6 m were determined. The marked stones can be identified in Fig. and were labelled with “MSxx”, where “xx” denotes their initial position along the x-axis. In the following, stone displacements Δx, Δy and Δz are defined for the marked stones as the difference in the marker position compared to its original position before the riprap was exposed to the flow. Note that due to the different nature of dumped riprap, displacements were not measured in the tests D01 and D02.
The tests P01 and D01 were used to determine the specific discharge per unit width q through the filter only (0.007 and 0.006 m2 s−1, respectively) as well as through the filter and riprap layer (0.012 and 0.020 m2 s−1, respectively). These flows were characterized by a water level over the horizontal crest reaching the top of the filter layer (i.e. at the boundary between the filter and the riprap stones) and the tips of the riprap stones, respectively. The subsequent tests were started with a higher initial specific discharge ranging between q = 0.05 and 0.20 m2 s−1. Following the initial load period, q was stepwise increased in intervals with a range of Δq = 0.02–0.05 m2 s−1. Each discharge was maintained for a specific time interval Δt and, before the next increase in q, the flow was stopped and the positions of the marked riprap stones were determined. The critical discharge qc corresponded to the discharge where a complete failure of the riprap, i.e. progressive erosion (bulk failure), occurred. The discharge when the first stone was eroded from the riprap was labelled qs and this discharge did not necessarily correspond to qc. Note that the flow through both the filter and the riprap layer (included filter) for the tests with placed riprap corresponded only to a small percentage of the observed qc (3% and 5%, respectively).
Table shows that the experimental boundary conditions varied slightly between the tests as they were carried out with a different number of experimental steps n in order to reduce the time-effort or to test the effect of specific load patterns. For example in P04, the discharge was stepwise increased to q = 0.40 m2 s−1 for which the flume head tank was intermittently (but only slightly) overtopped. Although the maximum discharge was applied in this test, the riprap did not fail and it was therefore decided to continue this test with a slightly reduced discharge of q = 0.35 m2 s−1 to avoid further overtopping of the head tank. However, as the riprap did not fail after 12.5 h overtopping with this discharge, q was increased again to q = 0.40 m2 s−1 before the riprap failed 4.5 h later. This test was thus used to investigate the effect of a long-term load of the riprap. Stone displacements were determined several times by stopping the flow.
Table 1 Experimental boundary conditions for the tests including slope length Ls, packing factor Pc, discharge q given as range, number of discharge steps n, time intervals Δt, and unit discharges qs and qc corresponding to erosion of the first stone and bulk erosion of the riprap, respectively. For placed riprap only boundary conditions for q≥0.05 (m2 s−1) are given in the table. The discharge range includes the n discharge steps which were run for complete time intervals Δt. If the riprap failed during step (n + 1) before Δt was reached, qs or qc exceeds the discharge range.
As indicated above, the experiments P05–P07 were scaled according to the experimental procedure in the field tests by Hiller et al. (Citation2016). A similar load sequence was applied in test P08 which, however, was carried out with a larger length Ls of the riprap layer in order to investigate the effect of Ls on riprap failure. The discharge was therefore directly increased after each step without stopping the flow in order to keep similarity in the load-pattern between the laboratory and field tests. This means that stone positions were determined following overtopping with an initial discharge and after the field discharge sequence was completed and the maximum achievable discharge qmax was reached. Note that qmax was increased in these tests compared to P04 due to some modifications at the inlet tank to facilitate an increased maximum discharge without overtopping of the head tank. The erosion of the first stone could not be unambiguously related to the applied discharge in the experiments P05 and P07 because of the restricted visibility of the riprap surface due to wavy water surface and highly turbulent flow conditions. Moreover, the riprap did not fail in P05–P07 even if the maximum achievable discharge was applied following the load of the riprap with the scaled field hydrograph. Failure could only be achieved through manually removing stones from the riprap, being the reason for the unknown critical discharge in Table indicated by qc > 0.49 m2 s−1.
4 Results and analysis
The direct comparison of the critical discharges for the placed and dumped riprap reveals that the placed riprap had, on average, a fivefold higher stability than dumped riprap. This is also evident through the critical stone-related Froude numbers because the stone size was not changed during the present study. The placed riprap was characterized by a lower Pc, i.e. it was more densely packed than the dumped riprap (Table ). Table furthermore shows that the erosion of a single stone did not necessarily affect the structural integrity of the placed riprap as in all cases qs < qc, except for P03.
It was observed that individual stones within the riprap were or became loose during the tests, so that they could be more easily eroded. The combination of placing more than 500 stones per m2 and the asperities and uneven shapes of angular stones resulted in some clearance between the stones, despite their placement in an interlocking pattern. In the experiments, the loose stones could be identified due to their trembling motion during water flow. However, not all of these stones were necessarily eroded and some stabilized again after some time due to the compaction of the riprap, i.e. they were stabilized due to minor movements of their neighbouring stones. Failure of the placed riprap was observed at the transition between the horizontal crest and the inclined chute as a result of the formation of a gap spanning the flume width. The gap expanded with both increasing experimental time and discharge and was caused by the gradual displacement of the riprap layer on the chute in flow direction. The displacements were caused by flow induced vibrations, resulting in compaction of the placed riprap. In addition, the shear-induced force of the flow could not be completely transferred from the riprap stones through the filter and into the embankment. Due to the steep slope of S = 0.67 the forces accumulated within the riprap layer. The displacements accumulated with increasing distance to the downstream riprap end (see also below) and the uppermost riprap stones on the chute consequently lost their interlocking, making them more prone to the flow attack than interlocked stones. Moreover, some riprap stones, which were located immediately upstream of the developing gap, turned gradually over and covered the gap, with their a-axes aligned to the flow.
The displacement of individual stones Δxi (but also in transverse and vertical direction Δyi and Δzi, respectively) depends on stone characteristics, packing density, distance between the stone and the fixed downstream end, the applied discharge (flow forces) and load period. The riprap was physically stabilized at the downstream end of the chute and at this position the displacements were ≈ 0 m. The displacement of individual stones in x-direction depends thus on the distance to the fix-point and can be normalized according to Larsen et al. (Citation1986) by Δxi/Li, where Li = Ls−xi and the subscript i denotes the position of a stone along the x-axis. The displacements developed gradually during the discharge steps, indicating that the time-dependency of the displacements should be included into stability approaches in addition to maximum failure discharge and critical stone-related Froude number, respectively. The combined impact of load period and discharge can be expressed by the product of these parameters, i.e. qt. Considering subsequent steps, qt needs to be presented as a sum, i.e. Σ(qjΔtj) where the subscript j denotes a discharge step. Table summarizes the results for the placed riprap tests in regard to the stone-related Froude numbers for the erosion of a single stone (Fs,s) and bulk failure (Fs,c), the maximum displacement Δxmax in the step before the failure occurred, and Σ(qt)tot. The latter is the total volume of water per unit width which had passed over the riprap, i. e. Σ(qt)tot = , where (n + 1) denotes the discharge step in which the riprap failed. Note that dumped riprap failed for critical stone-related Froude numbers of Fs,c = 0.9 (D01) and Fs,c = 1.2 (D02), respectively.
Table 2 Summary table of the results for placed riprap including the packing factor Pc, the stone-related Froude numbers for erosion of the first stone Fs,s and riprap failure Fs,c, the maximum displacements Δxmax observed at MS0 as well as the total volume of water which passed over the riprap per width during the test Σ(qt)tot
A closer inspection of the displacements in x-direction showed that, as expected, the maximum displacement Δxmax was generally observed at the transition from the horizontal crest to the chute, i.e. at MS0. Exceptions were the tests P01 and P03 where Δxmax occurred at MS200 with Δxmax = 0.125 m and Δxmax = 0.068 m, respectively. These displacements were similar to the ones observed for MS0 and the larger displacements for MS200 may result from a rotation of the stones during displacement. Some stones rearranged with small movements to a temporary more stable position and the rearrangement due to the trembling was often accompanied by an increase of the inclination angle β. The displacement was determined by the marker at the top of the stone and thus an increase in β results in positive Δz- and small negative Δx-values which were superimposed of the longitudinal displacement. For example, if a riprap stone with a = 0.091 m does not move in the x-direction, but rotates through 30° (from β = 60° to β = 90°), the resulting displacements are Δx = −0.046 m and Δz = +0.012 m. Note that in all tests, the displacements in y- and z-direction, Δy and Δz, were small compared to Δx (Δy ≤ 0.014 m and Δz ≤ 0.034 m).
Figure a exemplifies the development of the cumulative displacement for the marked stones as a function of q for test P02 which was carried out with constant time steps of Δt = 3600 s. The stones MS-200 and MS1800, located on the horizontal crest upstream of the transition to the chute and at the downstream end of the riprap, respectively, moved only marginally during the experiments. MS1800 was partly pulled out of the riprap during P02 so that Δxmax (MS1800) = 0.012 m (Fig a), even though this particular stone was located in the first row upstream of the locked end of the riprap. During all other tests Δxmax (MS1800) ≤ 0.005 m. Figure a shows further that the magnitude of the displacement of the stones MS0-MS1400 depended on the distance of the measurement stones to the downstream fixed point. Plotting Δxi/Li vs. q/qc (which is equal to Fs/Fs,c) results, similar to the observations of Larsen et al. (Citation1986), in a reasonably good collapse of the data points as indicated by Fig. b for the stones MS0-MS1400. Note that the deviations of the normalized displacements between the different tests in Fig. b increase for q/qc > 0.6. The relative displacements for each step were also examined for all tests, but it was not possible to isolate a specific discharge that caused a major displacement compared to the other discharges. The near collapse of the Δxi/Li values for MS0-MS1400 (Fig. b) indicates the possibility to consider averaged Δxi/Li values for each test. Figure a presents the averaged normalized displacements (the overbar denotes the averaging operator) as a function of q/qc for the tests that failed without manual interference (indicated in Table ). For the tests P01–P03 and P08, the
-curves show a reasonable agreement despite some differences in load-history. However, the data points for P04 deviate due to the long-term load pattern as described in the experimental procedure. This means that only tests with similar load periods can be compared in this way. Note that for P01, small negative Δx were observed for the lowest discharges, which can be associated with the aforementioned rotation of stones. Moreover, Figs b and a show that maximum displacement was not necessarily observed for q/qc = 1. The maximum relative displacements associated with q/qc < 1 are, however, an artefact of the experimental procedure as the displacements could not be measured after riprap failure. The riprap failed in a load period with increased discharge (i.e. in step n + 1) being the reason for values q/qc < 1 (see Table for details).
Figure 4 Measured displacements at the marked stones for test P02 in absolute values (a) and dimensionless (b). MS-200 and MS1800 are omitted in (b) as they displaced differently compared to the other marked stones. Note that the riprap failed at q/qc = 1 and the maximum displacements were determined after the prior discharge step, i.e. for q/qc < 1
Figure 5 Averaged dimensionless displacements over MS0 to MS1400 compared to the relative discharge in (a) and relative to the volume of water passed over the riprap in (b), including the regression Eq. (7). The vertical bars show the minimum and maximum values for the displacements included in the average. For P04 only the smallest and largest value for are plotted for q/qc = 1 in (a)
The displacements resulted in the development of a gap at the transition from the crest to the chute over time. Consequently, the combined impact of load period and discharge as mentioned above was included in the further analysis by considering Σ(qt)tot in order to compare the relative displacements of the different tests. This was also necessary because Σ(qt)tot varied between 291 and 33,023 m2 (Table ), reflecting that the development of the displacements depends on the packing of the riprap stones, i.e. the packing density represents an initial boundary condition for the displacements. Figure b shows the relative displacements
as a function of Σ(qt)/[Σ(qt)tot]. For the preparation of the figure, Σ(qt) was determined according to
, where k denotes the step for which the displacement was measured (k ≤ n + 1). The sum Σ(qt) was then normalized by Σ(qt)tot as defined above. The time interval Δtn+1 for the step n + 1 where riprap failure occurred was different from Δt given in Table and, as mentioned above, the displacements could not be determined for this last load period so that Σ(qt)/[Σ(qt)tot] < 1 in Fig. b. In general, the data points collapse reasonably well on a single line. Note that, compared to the other tests, more data points are plotted for P04 for Σ(qt)/[Σ(qt)tot] < 0.3 (Fig. b) due to the long term load associated with this particular test. For this experimental series, the low discharge-steps contributed only marginally to Σ(qt)tot compared to the multiple steps associated with qc.
Neglecting data points for which ≤ 0 (which we associate with measurement errors and/or stone rotation), the data in Fig. b were fitted by a power law with a coefficient of determination R2 = 0.85 (Fig. b):
(7)
The 95% confidence interval for the relative displacement
at Σ(qt)/[Σ(qt)tot] = 1 is [0.050, 0.064]. As mentioned above, the maximum displacement was generally observed at MS0 so that Li can be replaced by Ls when considering the maximum displacement. Thus, it becomes possible to estimate a maximum displacement interval Δxmax = [0.090 m, 0.115 m] for Ls = 1.8 m in the present study. It is interesting to note that the size of the longest stone axis a falls in this interval (average a = 0.091 m; amin = 0.069 m and amax = 0.115 m).
5 Discussion
The results of the present study confirm the displacement of riprap stones during overtopping as a relevant failure mechanism for placed riprap on steep slopes of S = 0.67. Thus it can be inferred that the stability of placed riprap depends on both discharge, the chute length Ls and the overtopping-time as the displacements were observed to be gradually developing. Details on the load history were, however, only available for the study of Sommer (Citation1997), and the following comparison of the present results with results from other studies is therefore limited to the critical stone-related Froude number Fs,c and the boundary conditions.
The critical stone-related Froude numbers Fs,c for dumped riprap obtained in the present study are smaller than Fs,c obtained by Peirson et al. (Citation2008) even though the interstitial flow was included in the total discharge. Furthermore, erosion of the first stone for dumped riprap coincided with riprap failure in the present experiments, whereas Peirson et al. (Citation2008) reported qs/qc < 1 (i.e. the ratio between initial displacement and armour failure). The difference between the present and the Peirson et al. (Citation2008) study is that the latter experiments were carried out with lower slopes providing an adequate explanation for these differences (Fig. a). The comparison of the obtained Fs,c-values for placed riprap with the data shown in Fig. b reveals larger Fs,c-values than previously reported for S = 0.67 (Fs,c ≥ 5.6). Moreover, Fs,c is, for the present experiments, larger than the predicted values according to the approaches from Dornack (Citation2001), Knauss (Citation1979) and Sommer (Citation1997). Although the formula of Knauss (Citation1979) considers indirectly flow aeration, the failure of the riprap was not affected by air entrainment in the present experiments.
Visual observations during the experiments showed that air entrainment started at 0.2 m < x < 0.4 m for q = 0.1 m2 s−1 and that the point of aeration moved downstream with increasing discharge. For q ≥ 0.3 m2 s−1, air entrainment could no longer be observed. It can therefore be assumed that aeration is not a key factor in regard to stability considerations for comparable prototype situations, as verified in the field observations by Hiller et al. (Citation2016). Scale effects due to air entrainment are consequently assumed to be negligible. However, the flow is at the borderline for scale effects according to Pfister and Chanson (Citation2012), who recommended W0.5 ≥ 140 (Weber number W = ρhv2/σ, with σ = surface tension) to avoid significant scale effects in two-phase air–water flows under Froude similitude as W0.5 ≈ 45 for q = 0.1 m2 s−1 and W0.5 ≈ 145 for q = 0.4 m2 s−1 in the present experiments. Note that the absence of flow aeration is an indicator that the flow was not fully developed due to the restricted riprap length, which is the reason why detailed investigations concerning the flow field and flow resistance were not carried out. Nonetheless, riprap failure could be initiated even though flow velocities in the flow development zone were lower than in the fully developed flow zone (which was not reached in the present experiments for large discharges). This observation is in agreement with Dornack (Citation2001) who observed riprap failure always upstream of the point of air entrainment. Inspecting Figs b and a and bearing in mind that aeration was absent for q > 0.3 m2 s−1 and that aeration was observed at 0.2 m < x < 0.4 m for q = 0.1 m2 s−1 results in an interesting observation. The gradient of the displacement curves changes at q ≈ 0.2 m2 s−1 (or q/qc ≈ 0.6), except for P04 (Fig. a), and shows slight differences with increasing discharge for the different stones (see results for P02 in Fig. b). In fact, for the lower discharges where aeration was observed, the displacements did not develop as pronounced as for larger discharges where aeration was absent. Although the hydrodynamic forces are smaller at lower discharges, aeration may result in even lower flow forces due to the reduction of the fluid density. Aeration might therefore influence the development of the displacements. The critical displacement-length, however, is assumed to be independent of aeration. Further investigations are required to substantiate this observation.
Failure of the placed riprap was in all tests initiated at the transition between the horizontal crest and the chute. The flow velocities at the crest were close to the velocity corresponding to F = 1 and were thus lower than the maximal velocity over the steep chute. This is a clear indication that the maximum velocity vmax over a steep and placed riprap has only an indirect effect on stability, as failure is not initiated at the location where vmax occurs. However, vmax will have an effect on the stone displacement as it is a governing parameter for the drag forces exerted by stones, but this issue could not be investigated in the present experiments.
The placed riprap tests can be directly compared with the data reported by Dornack (Citation2001) for S = 0.67 and Ls = 1.8 m (Fig. b). Dornack (Citation2001) used slightly smaller stones with a 4% lower density ρs, and the ripraps tested in his experiments were characterized by larger packing factors (in average Pc was 50% larger in his experiments compared to the present tests). This rather significant difference in Pc provides an explanation of the observed average difference of approximately 50% for Fs,c. Furthermore, it highlights the significance of the packing density on stability and hence indirectly the significance of stone displacements. A direct comparison with the data from Peirson et al. (Citation2008) is difficult due to different slopes, single- compared to double-layered riprap, and a significant larger packing factor of Pc = 0.94 in Peirson et al. (Citation2008). This Pc value corresponds nearly to the Pc value for dumped riprap in the present study.
A quantitative comparison of the displacement data with the data reported by Larsen et al. (Citation1986) and Sommer (Citation1997) is difficult due to the difference in boundary conditions and the lack of a general approach to link displacements with hydraulic parameters. Moreover, a significant difference in the experimental set-up is that the present tests were carried out with a horizontal crest, which was not present in the experiments of Larsen et al. (Citation1986) and Sommer (Citation1997). Nevertheless, the development of the gap at the transition between the crest and the chute due to the compaction and loosening in the riprap layer is in agreement with the conclusions of Larsen et al. (Citation1986) and Sommer (Citation1997) that displacements are an important failure mechanism for steep riprap.
Two specific datasets of Sommer (Citation1997) for which detailed data were available from Aberle (Citation1995) can be used to support the findings of the present study. For Fs = 3.25 and Li=2.7 m, Aberle (Citation1995) reported relative displacements of Δxi/Li ≤ 0.024 for a slope of S = 0.33, before the riprap was manually manipulated to induce failure. The riprap was loaded in steps of Δq = 0.1 m2 s−1 up to a maximum achievable discharge of q = 0.5 m2 s−1 with Δt = 1800 s, resulting in Σ(qt)=2700 m2 for stone related Froude-numbers up to Fs = 3.25. Assuming the applicability of Eq. (7), despite the fact that it has been derived for S = 0.67, yields Σ(qt)tot = 14,220 m2 by inserting = Δxi/Li = 0.024 and Σ(qt) = 2700 m2. Furthermore, assuming that the load pattern would be continued by increasing the discharge with Δq = 0.1 m2 s−1 every Δt = 1800 s until Σ(qt)/[Σ(qt)tot]≈1 results in qc ≈ 1.2 m2 s−1. Applying the same calculations for the second dataset for which Δxi/Li ≤ 0.017 on a slope of S = 0.25 (Aberle, Citation1995) reveals Σ(qt)tot = 27,960 m2 and qc ≈ 1.7 m2 s−1. The calculated qc for S = 0.33 and S = 0.25 correspond to critical stone-related Froude numbers of Fs,c = 7.8 and Fs,c = 11.1, respectively, and are in the same range as the Fs,c values of the present study.
Equation (7) can also be compared with Eq. (6). At riprap failure Σ(qt)/[Σ(qt)tot] ≈ 1 and, as the maximum displacements Δxmax were observed at MS0 for which the distance to the fixed point corresponds to the chute length, i.e. Li = Ls, the left-hand side of Eq. (7) can be replaced by , resulting in:
(8)
This equation is valid for S = 0.67 and Pc = 0.56 (representing the average of Pc for P01–P04 and P08). Equation (6) can be rearranged to obtain:
(9)
assuming that Ls/ds – 1 ≈ Ls/ds for large Ls/ds values. The factor (0.048 sinα) = 0.027 for S = 0.67 and is thus 47.5% smaller than the factor in Eq. (8). However, the packing factors in the present study were different from the packing factor in Sommer (Citation1997). The packing factor Pc affects the development of displacements because dense packing minimizes the amount of void between the riprap stones and thus the extent of the displacements. Sommer (Citation1997) used sinα to include the effect of the slope in Eq. (6). For his data with S ≤ 0.5 sinα ≈ tanα, whereas for extrapolation to steeper slopes, we consider using tanα as more appropriate. Hence, using the inverse proportion of the packing factors 0.8/0.56 and tanα instead of sinα results in a factor of 0.047 for tanα = 0.67, which is reasonably close to 0.056. Moreover, Sommer (Citation1997) recommended a limitation of the maximum displacements to 0.5ds for the design of placed ripraps as discussed in Section 2. Sommer (Citation1997) used stones for which a/b = 1.2, which is smaller than the ratio of the slight oblong stones with a/b = 1.7 in the present study. The placed riprap in the present study remained stable until the gap in the break-point between crest and chute spanned the size of an a-axis of a stone (i.e. larger than 0.5 ds). Thus, the proportions and shape of the stones as well as their variation in size might also influence the maximum achievable packing density and the limit for the maximum allowable displacement. Placing oblong stones with their longest axes normal to the slope will, for example, result in a higher packing density (lower Pc value) than placing cubical stones with the same volume. For dumped riprap, angular-shaped stones provide higher stability than round stones of the same size (Abt, Thornton, Gallegos, & Ullmann, Citation2008) and a similar effect can be assumed for placed riprap as the asperities will increase the interlocking forces between the stones.
Dornack (Citation2001) recommended to construct cross-structures perpendicular to the flow direction in placed riprap to limit the accumulating longitudinal forces and a consequent disruption of the placed riprap. Furthermore, such structures can be used to limit the displacements (Larsen et al., Citation1986; Sommer, Citation1997). The present study supports the need of such cross-structures because the test series P05, P06 and P07, which were carried out with reduced Ls, did not fail compared to the tests with longer lengths. For steep ripraps of larger length Ls without cross-structures, the displacements are assumed to either accumulate at the upstream end of the riprap structure or the riprap will rupture due to inhomogeneity in the riprap and the subjacent filter so that several gaps may develop. The development of displacements is time-dependent and implies that the duration of overtopping has to be included in the design of placed riprap on steep slopes. A prerequisite for displacements as failure mechanism is that the flow forces will be large enough to initiate riprap failure, i.e. to erode stones, and hence a lower threshold value for the critical discharge exists. For the design of placed riprap on spillways or as extra safety against accidental overtopping, a flood hydrograph for the specific site with the required return period has to be chosen as a basis for design. In case of overtopping as an extraordinary load, certain displacements are acceptable because the riprap can be repaired after the flood event.
6 Conclusions
Results from physical model tests of placed riprap on steep slopes exposed to overtopping demonstrated that placing riprap stones in an interlocking pattern increased the stability in terms of the critical unit discharge for failure and the critical stone-related Froude number approximately five times in comparison to randomly dumped riprap. Erosion of the first stone did not necessarily cause failure and progressive erosion should be used as a failure criterion. The results of the present study as well as the findings reported by Larsen et al. (Citation1986) and Sommer (Citation1997), identify displacements accumulating within the riprap as crucial for the stability of placed riprap on steep slopes. Consequently, displacements need to be considered as a failure mechanism for placed riprap, in addition to the established failure mechanisms such as the stability in terms of the critical stone-related Froude number. The chute length Ls as well as the packing density affect the potential compaction of the riprap stones and hence the development of a gap as sore point within the riprap. Riprap stones located at the developing gap lost gradually their interlocking, and the riprap failed in the present study when the maximum displacement exceeded the longest axes of the riprap stones. The displacements relative to the distance to the downstream fixed point developed quantitatively in the same way over the slope. Their development was related to the relative water volume, which had passed over the riprap layer. A regression formula was derived and combined with a maximum allowable displacement Δxmax corresponding to the length of the a-axis of the riprap stones. This resulted in a stability criteria of a/Ls > 0.056 = Δxmax/Ls based on the data from the present study. Additional data from independent studies are needed to evaluate and quantify the effect of the discharge magnitude as well as the time-dependency in the form of the passed water volume on the development of the displacements. Moreover, the slope, packing and chute length will also influence the development of the displacements but the aforementioned design criteria for the displacements is only dependent on the chute length.
Further investigations should also focus on the effect of aeration as well as flow development on displacements. Spatial characteristics of displacements should be considered as well as the stability at exposed locations such as the downstream end of the riprap and abutments, e.g. along the typical trapezoidal geometry of the downstream slopes of embankment dams. It is worth mentioning that advanced measuring equipment can allow for direct monitoring of riprap compaction in both the field and laboratory. For example, intelligent sensors with accelerometers and positioning systems as described by Gronz et al. (Citation2016) may be used to directly monitor the movement of individual riprap stones over longer time-periods. Such information can subsequently be used to assess the quality of the riprap over time.
Notation
| a, b, c | = | main axes of a stone (longest, intermediate, shortest) (m) |
| d | = | stone size (m) |
| di | = | stone diameter of grain size distribution corresponding to i% finer (m) |
| ds | = | equivalent stone diameter (m) |
| F | = | Froude number (−) |
| Fs | = | stone-related Froude number (−) |
| Fs,c | = | critical stone-related Froude number at riprap failure (−) |
| Fs,s | = | stone-related Froude number at erosion of first stone (−) |
| g | = | gravitational acceleration (9.81 m s−2) |
| h | = | water depth (m) |
| Li | = | distance to the downstream fixed point (m) |
| Ls | = | slope length (m) |
| m | = | stone mass (kg) |
| n | = | number of steps (−) |
| N | = | number of stones per unit area (m−2) |
| Pc | = | packing factor (−) |
| q | = | unit discharge (m2 s−1) |
| qc | = | critical unit discharge (m2 s−1) |
| qs | = | unit discharge at erosion of the first stone (m2 s−1) |
| S | = | tan(α) = slope (−) |
| t, Δt | = | time, time step (s) |
| v | = | flow velocity (m s−1) |
| vc | = | critical flow velocity (m s−1) |
| W | = | Weber number (−) |
| xyz, x′y′z′ | = | coordinates, x and x′ in flow direction (m) |
| α | = | slope angle (°) |
| β | = | angle between the a-axis of a stone and the slope (°) |
| Δx, Δy, Δz | = | displacement in x, y and resp. z-direction (m) |
| ρ | = | density of water (kg m−3) |
| ρs | = | density of stone (kg m−3) |
| σ | = | surface tension (N m−1) |
| Φ | = | packing factor (−) (Knauss, Citation1979) |
Acknowledgements
The authors thank the Master degree students Eirik Helgetun Pettersen, Jens Jakobsen and Fredrikke Kjosavik for their help in carrying out the physical model tests and the staff of the NTNU hydraulic laboratory for technical assistance. The permissions to use the reports of Larsen et al. (Citation1986) and Sommer (Citation1997) by the Regierungspräsidium Karlsruhe and the Karlsruhe Institute of Technology are acknowledged. The authors appreciated the comments of the editor and reviewers which helped to improve this article.
ORCID
Priska H. Hiller http://orcid.org/0000-0002-7639-5358
Jochen Aberle http://orcid.org/0000-0002-5435-2832
Additional information
Funding
References
- Aberle, J. (1995). Stabilität ungebundener Deckwerke unter Berücksichtigung der Deckwerksverschiebung bei Überströmung [Riprap stability considering displacements during overtopping] (unpublished thesis). Universität Karlsruhe.
- Abt, S. R., & Johnson, T. L. (1991). Riprap design for overtopping flow. Journal of Hydraulic Engineering, 117, 959–972. doi: 10.1061/(Asce)0733-9429(1991)117:8(959)
- Abt, S. R., Khattak, M. S., Nelson, J. D., Ruff, J. F., Shaikh, A., Wittler, R. J., … Hinkle, N. (1987). Development of riprap design criteria by riprap testing in flumes: phase 1 (NUREG/CR-4651). Washington, DC: Nuclear Regulatory Commission.
- Abt, S. R., Thornton, C. I., Gallegos, H. A., & Ullmann, C. M. (2008). Round-shaped riprap stabilization in overtopping flow. Journal of Hydraulic Engineering, 134, 1035–1041. doi: 10.1061/(ASCE)0733-9429(2008)134:8(1035)
- Abt, S. R., Thornton, C. I., Scholl, B. A., & Bender, T. R. (2013). Evaluation of overtopping riprap design relationships. JAWRA Journal of the American Water Resources Association, 49, 923–937. doi: 10.1111/jawr.12074
- Bunte, K., & Abt, S. R. (2001). Sampling surface and subsurface particle-size distributions in wadable gravel- and cobble-bed streams for analyses in sediment transport, hydraulics, and streambed monitoring (General Technical Report RMRS-GTR-74). Fort Collins CO: United States Department of Agriculture.
- Chanson, H. (2015). Embankment overtopping protection systems. Acta Geotechnica, 10, 305–318. doi: 10.1007/s11440-014-0362-8
- CIRIA, CUR, CETMEF. (2007). The rock manual: The use of rock in hydraulic engineering (2nd ed.). C683. London: CIRIA.
- Dornack, S. (2001). Überströmbare Dämme – Beitrag zur Bemessung von Deckwerken aus Bruchsteinen [Overtoppable dams – a contribution to the design of riprap] (PhD thesis). Technische Universität Dresden.
- Godtland, K. (1989). Steinfyllingsdammer: dimensjonering av nedstrøms plastringsstein unntatt damfoten [Rockfill dams: design of riprap stones on the downstream slope except the dam toe] (STF60 A89121, ISBN: 82-595-5892-0). Trondheim: Norges hydrotekniske laboratorium.
- Graf, W. H. (1991). Flow resistance over a gravel bed: Its consequence on initial sediment movement. In A. Armanini & G. Di Silvio (Eds.), Lecture Notes on Earth Sciences, Fluvial Hydraulics of Mountain Regions (pp. 17–32). Berlin: Springer.
- Gronz, O., Hiller, P. H., Wirtz, S., Becker, K., Iserloh, T., … Ries, J. B. (2016). Smartstones: A small 9-axis sensor implanted in stones to track their movements. CATENA, 142, 245–251. doi: 10.1016/j.catena.2016.03.030
- Hartung, F., & Scheuerlein, H. (1970). Design of overflow rockfill dams. 10th Congress on Large Dams, Q36, 587–598.
- Hiller, P. H. (2016). Kartlegging av plastring på nedstrøms skråning av fyllingsdammer [Survey of placed riprap on the downstram slope of rockfill dams] (B1-2016-1, ISBN-10: 978-827598-0951). Trondheim: Norwegian University of Science and Technology.
- Hiller, P. H., Kjosavik, F., Lia, L., & Aberle, J. (2016). Field tests of placed riprap as erosion protection against overtopping and leakage. Poster presented at the meeting of the United States Society on Dams, Denver CO.
- Hiller, P. H., & Lia, L. (2015). Practical challenges and experience from large-scale overtopping tests with placed riprap. In M. Á. Toledo, R. Morán, & E. Oñate (Eds.), Dam Protections against Overtopping and Accidental Leakage (pp. 151–157). London: CRC Press/ Balkema.
- Jafarnejad, M., Franca, M. J., Pfister, M., & Schleiss, A. J. (2017). Time-based failure analysis of compressed riverbank riprap. Journal of Hydraulic Research, 55, 224–235. doi: 10.1080/00221686.2016.1212940
- Knauss, J. (1979). Computation of maximum discharge at overflow rockfill dams (a comparison of different model test results). 13th International Congress on Large Dams, Q50, 143–159.
- Larsen, P., Bernhart, H. H., Schenk, E., Blinde, A., Brauns, J., & Degen, F. P. (1986). Überströmbare Dämme, Hochwasserentlastung über Dammscharten [Overtoppable dams, spillways over dam notches] (unpublished report prepared for Regierungspräsidium Karlsruhe). Karlsruhe: Universität Karlsruhe.
- Lia, L., Vartdal, E. A., Skoglund, M., & Campos, H. E. (2013). Rip rap protection of downstream slopes of rock fill dams – a measure to increase safety in an unpredictable future climate. Paper presented at the European Club Symposium of the International Commission on Large Dams, Venice.
- Linford, A., & Saunders, D. H. (1967). A hydraulic investigation of through and overflow rockfill dams (RR. 888). The British Hydromechanics Research Association.
- Ministry of Petroleum and Energy. (OED, 2009). Forskrift om sikkerhet ved vassdragsanlegg (damsikkerhetsforskriften) [Dam safety regulation] (FOR 2009-12-18-1600). Ministry of Petroleum and Energy.
- Mishra, S. K. (1998). Riprap design of overtopped embankments (PhD thesis). Colorado State University, Fort Collins, CO.
- Morán, R., & Toledo, M. A. (2011). Research into protection of rockfill dams from overtopping using rockfill downstream toes. Canadian Journal of Civil Engineering, 38, 1314–1326. doi: 10.1139/l11-091
- Norwegian Water Resources and Energy Directorate. (NVE, 2012). Veileder for fyllingsdammer [Guidelines for embankment dams] (Guideline 4/2012). Oslo: Norwegian Water Resources and Energy Directorate. Retrieved January 27, 2014, from: http://publikasjoner.nve.no/veileder/2012/veileder2012_04.pdf.
- Olivier, H. (1967). Through and overflow rockfill dams – new design techniques (Paper No. 7012). Institution of Civil Engineers.
- Orendorff, B., Al-Riffai, M., Nistor, I., & Rennie, C. D. (2013). Breach outflow characteristics of non-cohesive embankment dams subject to blast. Canadian Journal of Civil Engineering, 40, 243–253. doi: 10.1139/cjce-2012-0303
- Pardo, V., Herrera, M., Molines, J., & Medina, J. (2014). Placement test, porosity, and randomness of cube and cubipod armor layers. Journal of Waterway, Port, Coastal, and Ocean Engineering, 140, 04014017. doi: 10.1061/(ASCE)WW.1943-5460.0000245
- Peirson, W. L., & Cameron, S. (2006). Design of rock protection to prevent erosion by water flows down steep slopes. Journal of Hydraulic Engineering, 132, 1110–1114. doi: 10.1061/(ASCE)0733-9429(2006)132:10(1110)
- Peirson, W. L., Figlus, J., Pells, S. E., & Cox, R. J. (2008). Placed rock as protection against erosion by flow down steep slopes. Journal of Hydraulic Engineering, 134, 1370–1375. doi: 10.1061/(ASCE)0733-9429(2008)134:9(1370)
- Peirson, W. L., & Pells, S. E. (2005). Steady state testing of scour protection options for Penrith Lakes weirs (Technical report 2005/11). The University of New South Wales Water Research Laboratory.
- Pfister, M., & Chanson, H. (2012). Discussion – “Scale effects in physical hydraulic engineering models” by Heller, V. Journal of Hydraulic Research, 50, 244–246. doi: 10.1080/00221686.2012.654671
- Robinson, K. M., Rice, C. E., & Kadavy, K. C. (1998). Design of rock chutes. Transactions of the American Society of Agricultural Engineers, 41, 621–626. doi: 10.13031/2013.17230
- Scheuerlein, H. (1968). Der Rauhgerinneabfluss [Flow in rough channels] (PhD thesis). Technische Hochschule München.
- Siebel, R. (2007). Experimental investigations on the stability of riprap layers on overtoppable earthdams. Environmental Fluid Mechanics, 7, 455–467. doi: 10.1007/s10652-007-9041-8
- Sommer, P. (1997). Überströmbare Deckwerke. [Overtoppable erosion protections] (unpublished report). Institut für Wasserbau und Kulturtechnik, Versuchsanstalt für Wasserbau, Universität Karlsruhe.
- Thornton, C., Abt, S. R., Clopper, C., Scholl, B. N., & Cox, A. L. (2012). Rock stability testing in overtopping flow – 2012 (Hydraulics Laboratory Technical Report 2012-1). Fort Collins CO: Engineering Research Center, Colorado State University.
- Thornton, C., Cox, A. L., & Turner, M. D. (2008). Las Vegas wash sloped rock-weir study (Report). Las Vegas NV: Report prepared for the Southern Nevada Water Authority.
- Toledo, M. Á., Morán, R., & Oñate, E. (Eds.). (2015). Dam protections against overtopping and accidental leakage. London: CRC Press/ Balkema.
- Wittler, R. J. (1994). Mechanics of riprap in overtopping flow (PhD thesis). Colorado State University, Fort Collins, CO.