
 ?Mathematical formulae have been encoded as MathML and are displayed in this HTML version using MathJax in order to improve their display. Uncheck the box to turn MathJax off. This feature requires Javascript. Click on a formula to zoom.
Abstract
Semi-permeable sediment traps are designed to retain sediment during large floods and enable sediment transport continuity during ordinary floods by combining two barriers with a guiding channel. During floods, not only sediment but also large wood (LW) can be transported, that may block the inclined bar screen (mechanical barrier) and inhibit sediment transport. The design of the inclined bar screen has not been tested with LW. We conducted a first set of simplified flume experiments to study the effect of (1) initial conditions, (2) bar screen design, and (3) LW volume on sediment transport. First results demonstrate that a LW volume blocking 20% of the flow cross-section is sufficient to reduce sediment transport by 50%. Hence, LW volume is a relevant parameter for the design of inclined bar screens. We provide future research ideas to enable the local separation of LW and sediment.
1 Introduction and objectives
Sediment traps are designed to retain sediment during large floods to prevent downstream deposition and inundations. Common sediment traps tend to retain sediment during ordinary floods (i.e. morphologically effective discharge; Schwindt, Citation2017) and, hence, affect sediment transport continuity during all discharge conditions. Recently, research on sediment traps focused on the design of “semi-permeable structures” that enable sediment retention during large floods and sediment transport continuity during ordinary floods (D’Agostino et al., Citation2000; Meninno et al., Citation2019; Piton et al., Citation2019; Piton & Recking, Citation2016a, Citation2016b; Rossi & Armanini, Citation2019; Roth et al., Citation2018; Schwindt, Citation2017). One promising concept was developed by Schwindt et al. (Citation2018). The concept includes a guiding channel that passes the retention structure with a given bed slope and enables sediment to be transported downstream for discharges up to the bankfull discharge of the guiding channel, corresponding to the morphologically effective discharge. For mountainous regions, this effective discharge can correspond to a flood with a return period of up to 50 years (Hassan et al., Citation2014; Schwindt, Citation2017). The retention structure consists of a mechanical (inclined bar screen, i.e. a rack structure) and hydraulic barrier (dam with low-level outlet) (Fig. a). The governing design parameter for the mechanical barrier to achieve its semi-permeability during ordinary floods is the bottom clearance between the guiding channel and the bar screen, defined as the product of a pre-factor fm and the characteristic grain size diameter d84 (Fig. b).
Figure 1 (a) Plan view of semi-permeable sediment trap concept by Schwindt et al. (Citation2018) with (1) inlet, (2) guiding channel, (3) retention area, (4) inclined bar screen (mechanical barrier), and (5) dam with low-level outlet (hydraulic barrier) (adapted from Schwindt et al., Citation2018); (b) cross-section of guiding channel with inclined bar screen (adapted from Schwindt et al., Citation2018), black rectangle represents model area of present study, and (c) side view of experimental set-up with notation
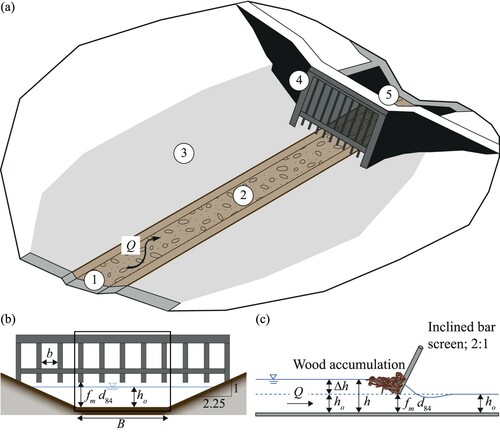
During floods, not only sediment but also large wood (LW) is transported and may accumulate at the inclined bar screen (mechanical barrier, Fig. a). A LW accumulation reduces the open flow cross-section area, leading to backwater rise, which affects sediment transport (Schalko, Citation2020). Previous studies on LW accumulations at rack structures demonstrated that backwater rise and local scour increase with increasing LW volume and that LW should be included in a flood hazard assessment (Schalko et al., Citation2019a, Citation2019b). Piton et al. (Citation2019) introduced a “hybrid barrier”, which enables the separation between LW and sediment and consists of an open check dam with an inclined rack positioned on the spillway. The flume experiments proved successful for a specific case study. The effect of LW has not been considered to evaluate the efficiency of the semi-permeable sediment trap by Schwindt et al. (Citation2018), in particular for the design of the inclined bar screen (mechanical barrier). We hypothesize that even a small amount of wood can alter the flow conditions and reduce or disable sediment transport continuity. The present study focuses on the scenario of ordinary floods, where the semi-permeable sediment trap by Schwindt et al. (Citation2018) should be permeable for water, sediment and LW, and neither the inclined bar screen nor the hydraulic barrier should affect these processes. The consideration of LW accumulation significantly increases the complexity of the problem, as LW transport and accumulation are dynamic and random processes. Therefore, we conducted a first set of simplified flume experiments to study the effect of (1) initial conditions, (2) bar screen design configurations, and (3) LW volume on the sediment transport capacity at an inclined bar screen. Based on our preliminary results focusing on the interaction between LW and sediment at the mechanical barrier, we provide future research ideas to enable the local separation of LW and sediment at sediment traps.
2 Experimental set-up
2.1 Hydraulic model
The flume experiments were conducted according to Froude similitude with a model scale factor of λ = 30 at the Laboratory of Hydraulics, Hydrology and Glaciology (VAW) at ETH Zurich. The tiltable glass-walled flume is 0.40 m wide, 8 m long, and 0.70 m deep. The bottom slope varied by So = 1.4–3.3%. The experiments were performed with a fixed bed that had a roughness length similar to the added sediment. The discharge varied by Q = 11.6–30 l s–1 (corresponding to upscaled unit discharge values with λ = 30 of q = 4.8–12.4 m2 s–1, similar to unit discharge values of the River Allenbach in Switzerland with a return period smaller than 30 years) and was measured with an electromagnetic flow meter with a ±0.1% accuracy. The approach flow conditions were controlled by adapting So, Q, and characterized by the approach flow depth ho, flow velocity vo = Q/(Bho), and flow Froude number F = vo/(gho)1/2 = 1.1–1.5 (supercritical flow), with B = channel width, and g = gravitational acceleration. The flow depth was measured using ultrasonic distance sensors (UDS) with ±0.3 mm accuracy, with two UDSs positioned 1.2 m and 0.3 m upstream and one UDS 1.2 m downstream of the inclined bar screen. Resulting flow depth upstream of the inclined bar screen h is the sum of the backwater rise Δh and the approach flow depth ho; h = Δh + ho. A filter basket was installed at the flume outlet to collect wood and sediment. The set-up by Schwindt et al. (Citation2018) (Fig. a) was simplified to model a rectangular section of the guiding channel (black rectangle in Fig. b) with the inclined bar screen (mechanical barrier; Fig. b) to easily adapt bar screen design and channel slope. We neglect the concrete orifice dam of the Schwindt et al. (Citation2018) design, as the focus of this study is on the sediment–LW interaction at the inclined bar screen during ordinary floods. The experimental set-up and notation of this study are illustrated in Fig. c. The inclined bar screen was designed based on Schwindt et al. (Citation2018) and Roth et al. (Citation2018), as the latter optimized the design for smaller grain sizes. According to Schwindt et al. (Citation2018), the open bar spacing b = x d84 (with x defined as a pre-factor) and the bottom clearance height, defined as the product of fm d84 (Fig. b), are both a function of the characteristic grain size diameter d84. In prototype, the model bar diameter db would be designed based on structural criteria and governs the bar screen blockage ratio. For this study, db was set to 5 mm, in the same order of magnitude as d84. The bar screen was positioned 4 m downstream of the inlet with an inclination of 2:1 (Schwindt et al., Citation2018).
2.2 Model sediment and large wood
A uniform bed material was used as the model sediment with the characteristic grain size diameters of dm = 5.5 mm (subscript m as mean), d90 = 6.0 mm (0.180 m in prototype with λ ≈ 30), d84 = 5.9 mm, d16 = 5.2 mm. The sediment was chosen to model coarse gravel bed rivers (e.g. River Allenbach in Switzerland with d90 = 0.198 m). The sorting coefficient of the grain size distribution σg = 1.1 was verified with a sieving analysis. Prior to the addition of LW, the initial condition of sediment transport was defined as apparent transport across channel width. The initial (subscript IC) non-dimensional bed shear stress θIC ≥ 0.07 was larger than the threshold value for incipient motion θcr = 0.047 (Shields, Citation1936 or Meyer-Peter & Müller, Citation1948). The corresponding sediment input transport rate Gb,in (g s–1), based on the sediment transport equation by Rickenmann (Citation1990), was added continuously to the flow over the entire test duration. The sediment transport reduction factor ξ was defined according to Roth et al. (Citation2018):
(1)
(1)
with Gb,out = sediment output transport rate. Roth et al. (Citation2018) based their design recommendations on a threshold value of ξ ≥ 0.75, where sediment transport continuity is enabled.
Natural wooden logs were used to model LW (LW is defined as logs with a diameter > 0.1 m and length > 1 m; Keller & Swanson, Citation1979) with a log diameter of dL = 0.01 m and log length LL = 0.15–0.20 m. The logs were irregular in shape and without branches. They were not watered prior to the test and the log density ρL amounted to 500 kg m–3 (“in-stream wood”, see Ruiz-Villanueva et al., Citation2016). The model LW was scaled based on recommendations by Schalko et al. (Citation2018). LW was added in 10–50 g packages with a total mass of 200 g (≈20 logs). The amount of added LW is normalized as the relative LW volume Vs,rel, required to block an idealized rectangular cuboid of B × ho × ho:
(2)
(2)
The solid LW volume Vs can be determined based on the mass of the LW accumulation with ρL = 500 kg m–3 (multiplied with λ3 for prototype conditions).
2.3 Test programme and procedure
The test programme is listed in . Tests 1–3 investigated the effect of varying initial sediment transport conditions with θIC = 0.07–0.15. Tests 3–6 studied different bar screen design configurations by varying the bottom clearance height fm d84. While for tests 1–3, fm d84 = 1.75 d84 = 10 mm based on recommendations by Roth et al. (Citation2018), fm d84 was varied to fm d84 = 20 and 40 mm for tests 4–5. For test 6, fm d84 = 19 mm to model a similar relative bottom clearance height ((fm d84)/ho) to Roth et al. (Citation2018) with (fm d84)/ho = 0.56. For all tests, open bar spacing b amounted to b = 1.2 d84 = 7.1 mm based on Roth et al. (Citation2018) and db = 5 mm. The effect of LW volume on sediment transport capacity was studied in tests 5–6.
Table 1 Test programme
The test procedure can be summarized as follows. The approach flow conditions were set by gradually increasing Q with S = 0% at test start. Subsequently, channel slope was increased to the respective So, and the sediment addition started. To evaluate the initial sediment transport condition, ho was measured with UDS and θIC was calculated. Equilibrium of sediment transport (Gb,in = Gb,out) was validated by manually measuring Gb,out for a defined duration (∼5 min) using the filter basket, and then drying and weighing the sediment with ±0.5 g s–1 accuracy. The inclined bar screen was inserted to the flume with the respective bottom clearance height fm d84. LW was added 0.5 m downstream of the inlet in packages. For each package, the individual logs were distributed across the channel width in random orientation to the flow. Resulting backwater rise Δh was measured during the entire test duration using UDS. For tests 5–6, Gb,out was manually determined after the addition of each LW package. The test procedure was visually documented with a video camera. After addition of the respective LW volume, bottom slope was reduced to So = 0%, sediment addition stopped, and Q reduced. LW that accumulated at the bar screen was extracted and dried. The respective model tests were conducted for a relatively short time period and the time-component was not part of this study.
3 Experimental results and discussion
3.1 Effect of initial conditions
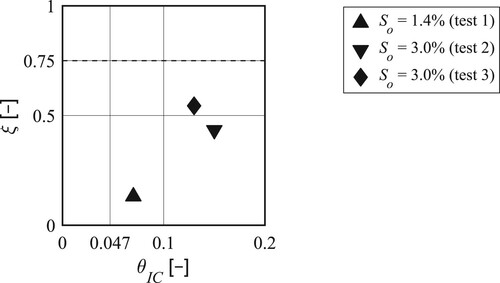
In Fig. , the relative sediment transport reduction factor ξ is plotted versus the initial non-dimensional bed shear stress θIC prior to LW addition for tests 1–3 (; initial flow depth is larger than the bottom clearance height). It can be noted that ξ increases with increasing θIC. Prior to LW addition, ξ = 0.13 for θIC = 0.07 (test 1) compared to ξ ≈ 0.50 for θIC ≈ 0.13 (test 3). The suggested threshold value of ξ ≥ 0.75 cannot be met for the tested conditions. Sediment transport is reduced, if the inclined bar screen alters the approach flow conditions. A submerged bar screen may lead to backwater rise, reducing upstream flow velocity and, hence, θ. The effect on sediment transport continuity then depends on the ratio of θIC/θcr. For θIC ≈ θcr, the sediment transport capacity and ξ will be more strongly affected by backwater rise due to bar screen submergence or subsequent wood blockage compared to θIC >> θcr. Additional model tests including the time-component, a hydrograph, and for the entire semi-permeable sediment trap system are required to study the implications of θIC/θcr during a flood.
Figure 2 Relative sediment transport reduction factor ξ versus initial non-dimensional bed shear stress θIC prior to LW addition (tests 1–3)
3.2 Effect of bar screen design
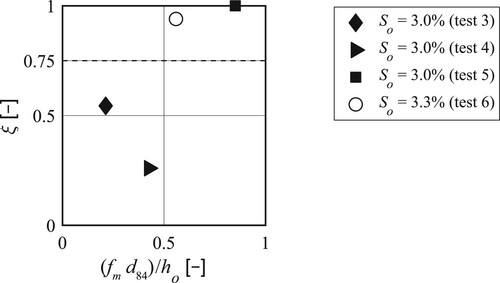
The bottom clearance height fm d84 was varied in tests 3–6 to fm d84 = 10, 20, 40 and 19 mm, respectively. Figure illustrates that ξ tends to increase with increasing relative bottom clearance height (fm d84)/ho prior to LW addition. Given (fm d84)/ho > 0.5, sediment transport is not affected with ξ >> 0.75. In contrast, (fm d84)/ho < 0.5 results in ξ < 0.75 and sediment transport is impaired even prior to LW addition. The flume experiments were conducted under steady-state conditions and represent a simplification. It can be hypothesized that given an unobstructed bottom clearance, deposited sediment may be flushed downstream during a flood, leading to an increase in ξ. No recommendations exist regarding an optimal range of (fm d84)/ho or critical bar screen blockage ratio including db.
Figure 3 Relative sediment transport reduction factor ξ versus relative bottom clearance height (fm d84)/ho prior to LW addition (tests 3–6)
3.3 Effect of wood volume
The effect of small wood volumes, Vs,rel ≤ 1, on sediment transport was investigated for tests 5–6 (), since for these tests the bar screen itself did not affect sediment transport. A photo series of the wood accumulation and resulting sediment deposition at the inclined bar screen is illustrated in Fig. for test 5 and in Fig. for test 6. In Fig. , ξ is plotted versus Vs,rel for tests 5–6.
Figure 4 LW accumulation and sediment deposition at the inclined bar screen for increasing Vs,rel: (a) prior to LW addition, (b) Vs,rel=0.12, (c) Vs,rel=0.22, and (d) Vs,rel=0.34 (test 5)
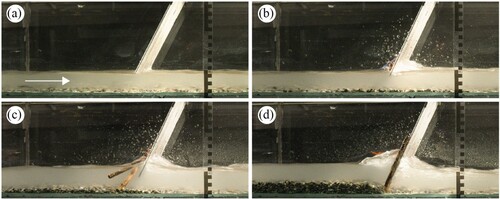
Figure 5 LW accumulation and sediment deposition at the inclined bar screen for increasing Vs,rel: (a) prior to LW addition, (b) Vs,rel=0.085, (c) Vs,rel=0.22 and (d) Vs,rel=0.44, (e) Vs,rel=0.67 and (f) Vs,rel=0.89 (test 6)
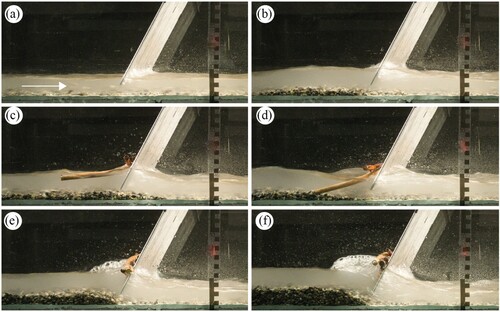
Figure 6 Relative sediment transport reduction factor ξ versus relative wood volume Vs,rel for tests 5 and 6
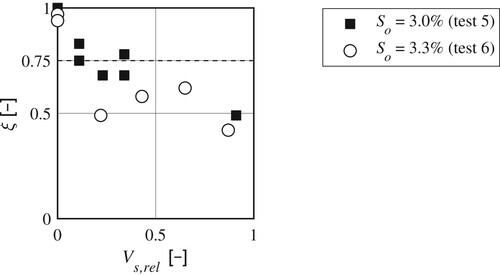
For test 5, the inclined bar screen was altered and with fm d84 = 40 mm it did not impair sediment transport prior to LW addition, resulting in ξ = 1.0 (Figs a and ). The first LW package with 3–5 logs and Vs,rel = 0.12 (Fig. b) hit the bar screen at water surface level. As it did not block the flow cross-section, it did not affect sediment transport. For Vs,rel > 0.22 (Fig. c and d) individual logs block the lower part of the bar screen, resulting in backwater rise and sediment deposition upstream of the bar screen with ξ ≈ 0.68–0.78 (Fig. ). The proposed threshold value ξ = 0.75 (Roth et al., Citation2018) is met for fm d84 = 40 mm and Vs,rel < 0.90. Given Vs,rel = 0.91, ξ is reduced to 0.49, thereby impairing sediment transport (Fig. ). We observed that log position altered throughout test duration. Therefore, the measurement of Gb,out and determination of ξ was repeated for selected Vs,rel (Fig. ). Based on this measurement repetition, we can derive that ξ deviates by ±10% and the individual log position significantly affects ξ.
According to Fig. a, the inclined bar screen with a bottom clearance height of fm d84 = 19 mm ((fm d84)/ho = 0.56; test 6) does not impair sediment transport as proposed by Roth et al. (Citation2018). Similar to test 5, the first added logs hit the bar screen at surface water level (Fig. b). For Vs,rel = 0.22 (2.80 m3 in prototype), logs block the flow cross-section and impair sediment transport with ξ = 0.50 (Figs c and ). The blocked flow cross-section increases with increasing LW volume, resulting in backwater rise and a reduction of flow velocity, which leads to a reduced sediment transport capacity (Fig. d–f). At test end and for Vs,rel = 0.89 (Figs f and ), sediment transport capacity is reduced to 42% compared to the condition without LW (Fig. a). The recommended threshold value of ξ ≥ 0.75 suggested by Roth et al. (Citation2018) is not met for Vs,rel ≥ 0.22.
Figure shows that ξ decreases with increasing Vs,rel. Comparably small wood volumes are sufficient to reduce sediment transport by 50%.
Based on our first results, an accumulation of only a few logs at an inclined bar screen may affect sediment transport. However, to derive a general relationship between ξ and Vs,rel, additional flume experiments are required.
4 Conclusions
We conducted a first set of flume experiments to study the effect of wood accumulations at an inclined bar screen on sediment transport. The inclined bar screen was designed based on recommendations by Schwindt et al. (Citation2018) and Roth et al. (Citation2018) for their novel concept of semi-permeable sediment traps. Based on this study, we can derive the following preliminary conclusions:
The smaller the initial non-dimensional bed shear stress θIC the stronger is the influence of the submerged bar screen on the relative sediment transport capacity reduction factor ξ without taking LW into account. With the given bar screen design, depending on the bottom clearance height, and prior to LW addition, ξ = 0.13 for θIC = 0.07 ((f d84)/ho = 0.17) compared to ξ ≈ 0.50 for θIC ≈ 0.13 ((f d84)/ho = 0.21). The relative bottom clearance height, defined as the ratio between the bottom clearance height (fm d84) and approach flow depth ho, affects the sediment transport continuity. Our results demonstrated that sediment transport is not affected given (fm d84)/ho > 0.5 (with the given bar screen blockage ratio and bottom slope). In contrast, (fm d84)/ho < 0.5 reduces sediment transport by 50% resulting in ξ ≤ 0.50 prior to LW addition.
ξ decreases with increasing relative wood volume Vs,rel. A wood volume blocking 20% of the flow cross-section or 3–5 logs with a length of ≈4 m in prototype (Vs,rel ≥ 0.22) are sufficient to reduce sediment transport by 50%. The effect of wood on sediment transport is evident, but additional flume experiments are required to derive a general relationship between ξ and Vs,rel.
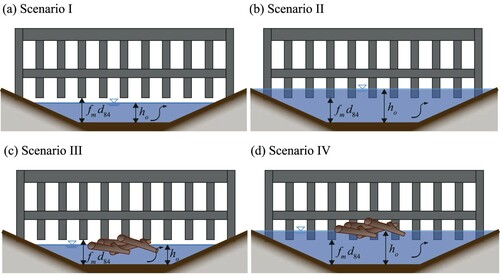
Sediment transport continuity is a function of (1) relative bottom clearance height (fm d84)/ho; (2) ratio between initial and critical non-dimensional bed shear stress θIC/θcr; and (3) relative LW volume Vs,rel. Based on the interaction of these parameters, we derived the following four scenarios (Fig. ; note that the scenarios may also be present during larger floods):
Scenario I (Fig. a): The bottom clearance height fm d84 is larger than the approach flow depth ho and assuming that the entrainment and deposition of wood can be neglected. The semi-permeable sediment trap is designed according to Schwindt et al. (Citation2018) and sediment transport continuity guaranteed up to the design discharge of the guiding channel, representing morphologically effective discharge during ordinary floods (e.g. HQ30).
Scenario II (Fig. b): The bottom clearance height fm d84 is smaller than ho, and wood can be neglected. Depending on both (fm d84)/ho and θIC/θcr, the inclined bar screen may affect the flow conditions and impair sediment transport.
Scenario III (Fig. c): The bottom clearance height fm d84 is larger than ho, and wood cannot be neglected. Depending on the expected wood dimensions and wood volume, sediment transport may be impaired or discontinued.
Scenario IV (Fig. d): The bottom clearance height fm d84 is smaller than ho, and wood cannot be neglected. Due to the small relative bottom clearance height, logs are more likely to block the open flow cross-section, leading to backwater rise, which can impair or discontinue sediment transport.
Figure 7 Different scenarios to evaluate wood retention and sediment transport at inclined bar screens
5 Recommendations for future research
The results of this present study allow for a first judgement regarding the efficacy of the inclined bar screen at semi-permeable sediment traps related to wood blockage. We provide future research ideas to enable the local separation of LW and sediment at sediment traps (mechanical and hydraulic barrier) by investigating the following parameters:
Wood characteristics
Log diameter: For this present study, the log diameter amounted to a constant value of dL = 10 mm. Considering a small amount of wood volume, the effect of LW on sediment transport may be governed by the ratio between dL and the bottom clearance height fm d84, deciding whether logs may pass the mechanical barrier or not.
Branches and leaves: According to Schalko et al. (Citation2018), branches and leaves in a wood accumulation increase backwater rise due to increased friction losses within the accumulation. Given an inclined bar screen designed according to Schwindt et al. (Citation2018) or Roth et al. (Citation2018), the open bar spacing b is significantly smaller compared to a common wood retention rack. Hence, branches and leaves are more likely to block the open flow cross-section at the inclined bar screen, leading to backwater rise, which results in a decrease in sediment transport.
Rootwads: Rootwads are characterized by larger dimensions compared to tree trunks and may block a larger cross-section, increasing backwater rise, and decreasing sediment transport.
Wood density: The model log density in this present study amounted to ρL = 500 kg m–3. According to Ruiz-Villanueva et al. (Citation2016), wood density can vary significantly. Denser logs may block lower parts of the bar screen, and, hence, affect sediment transport stronger compared to less dense logs.
Bed material
Grain size diameter: The characteristic grain size diameter d84 is the governing parameter for the inclined bar screen design as it defines both the bottom clearance height fm d84 and open bar spacing b. The design guidelines for the semi-permeable sediment trap have been derived based on two model d84, i.e. d84 ≈ 13.7 mm (Schwindt et al., Citation2018) and d84 ≈ 8 mm (Roth et al., Citation2018). The study by Roth et al. (Citation2018) demonstrated how smaller d84 affect the efficacy of the semi-permeable sediment trap, resulting in the adaption of the design recommendation for fm d84. Depending on the approach flow depth ho, the resulting fm d84 may already affect sediment transport during ordinary floods due to insufficient relative bottom clearance height. The first model tests of this study with d84 ≈ 6.0 mm highlighted the need to test additional d84. In general, the definition of the characteristic grain size diameter (d84 versus d90 or d95) is crucial for the design of the mechanical barrier (e.g. Shima et al., Citation2016).
Sediment mixture: Previous model tests were conducted with uniform grain size diameters or poorly graded sediment, i.e. sorting coefficient of grain size distribution σg < 1.5 (Roth et al., Citation2018; Schwindt et al., Citation2018). As sediment traps are located in channels with well graded sediment and as d84 is the governing design parameter for the mechanical barrier, the analysis of sediment mixture is deemed necessary.
Non-dimensional bed shear stress: The first results of this present study demonstrated that the effect of LW blockage on sediment transport depends on the non-dimensional bed shear stress θ. A given wood volume may alter the flow conditions upstream of the bar screen and, hence, decrease sediment transport. Whether this decrease in sediment transport capacity leads to sediment transport discontinuity depends on the ratio of the initial and critical non-dimensional bed shear stress θIC/θcr, which is not yet part of the design recommendations.
Flow conditions
Hydrograph: Schwindt et al. (Citation2018) and Roth et al. (Citation2018) investigated various hydrographs to improve the design of semi-permeable sediment traps. Ordinary floods (e.g. HQ30) affect the design of the guiding channel with the mechanical barrier, whereas large floods (e.g. HQ100) also govern the design of the hydraulic barrier (not studied here). The effect of wood has only been studied for selected steady-state discharges, focusing on ordinary floods, or for a specific case study (Piton et al., Citation2019). High flows with a special focus on sediment retention should be investigated in a hydraulic model, as opposed to the simplified test set-up of the present study. In addition, the effect of varying approach flow regimes should be studied. Recent floods (Ravazzolo et al., Citation2017; Ruiz-Villanueva et al., Citation2019) demonstrated that wood tends to be transported prior to the flood peak. Hence, the timing of wood addition should be varied during the experiments and studied in detail (prior to versus after flood peak). It can be hypothesized that the temporal flow and wood characteristics affect sediment transport continuity.
Bar screen (mechanical barrier)
Bottom clearance height and open bar spacing: The design of the bottom clearance height fm d84 and open bar spacing b depends solely on the characteristic grain size diameter d84 (Schwindt et al., Citation2018 and Roth et al., Citation2018). No recommendations exist regarding an optimal relative bottom clearance height or bar screen blockage ratio. Based on the results of this present study, small amounts of wood already decrease sediment transport capacity. Experiments are required to identify bar screen designs that prevent the clogging of individual logs during ordinary floods, retain logs during large floods, and safely guide logs downstream during extreme floods.
Bar screen inclination: For extreme floods with increased wood transport, it is recommended to design the bar screen with an inclination of 2:1 in order to allow for wood transport across the dam crest (hydraulic barrier). This recommendation is based on physical model tests for a specific field site (Lange & Bezzola, Citation2006) and a literature recommendation (Piton & Recking, Citation2016b; Schwindt et al., Citation2018). According to D’Agostino et al. (Citation2000) and Schalko (Citation2020), LW tends to block the upper part of an inclined rack. Additional model tests are required to derive the optimal bar screen inclination that enables the safe downstream guidance of wood during extreme floods.
The majority of the proposed parameters can be investigated with a simplified set-up in a rectangular flume. The effects of (1) hydrograph, (2) sediment transport conditions (θIC/θcr), and (3) bar screen inclination on the efficacy of a sediment trap, however, demand the construction of a physical model including both mechanical and hydraulic barrier.
Notation
| b | = | open bar spacing; here defined as 1.2 d84 (mm) |
| B | = | width (m) |
| di | = | grain size diameter at which i% of the sample is finer (mm) |
| db | = | model bar screen diameter (mm) |
| dL | = | log diameter (m) |
| dm | = | mean grain size diameter (mm) |
| fm | = | pre-factor for bottom clearance height (–) |
| fm d84 | = | bottom clearance height (mm) |
| F | = | flow Froude number (–) |
| g | = | gravitational acceleration (m s–2) |
| Gb,in | = | sediment input transport rate (g s–1) |
| Gb,out | = | sediment output transport rate (g s–1) |
| h | = | flow depth (m) |
| ho | = | approach flow depth (m) |
| LL | = | log length (m) |
| q | = | unit discharge (m2 s–1) |
| Q | = | discharge (m3 s–1) |
| So | = | bottom slope (–) |
| vo | = | approach flow velocity (m s–1) |
| Vs | = | solid large wood volume (m–3) |
| Vs,rel | = | relative solid large wood volume (–) |
| x | = | pre-factor to determine open bar spacing b (–) |
| Δh | = | backwater rise (m) |
| ξ | = | relative sediment transport reduction factor (–) |
| θ | = | non-dimensional bed shear stress (–) |
| θcr | = | critical non-dimensional bed shear stress (–) |
| θIC | = | initial non-dimensional bed shear stress (–) |
| λ | = | scale factor (–) |
| ρL | = | density of logs (kg m–3) |
| σg | = | sorting coefficient of grain size distribution (d84/d16)0.5 (–) |
Acknowledgements
Jule Holland is acknowledged for her excellent laboratory work during her Master thesis.
Additional information
Funding
References
- D’Agostino, V., Degetto, M., & Righetti, M. (2000). Experimental investigation on open check dam for coarse woody debris control. Dynamics of water and sediments in mountain basins, Quaderni di Idronomia Montana, 20, 201–212.
- Hassan, M. A., Brayshaw, D., Alila, Y., & Andrews, E. (2014). Effective discharge in small formerly glaciated mountain streams of British Columbia: Limitations and implications. Water Resources Research, 50(5), 4440–4458. https://doi.org/https://doi.org/10.1002/2013WR014529
- Keller, E. A., & Swanson, F. (1979). Effects of large organic material on channel form and fluvial processes. Earth Surface Processes, 4(4), 361–380. https://doi.org/https://doi.org/10.1002/esp.3290040406
- Lange, D., & Bezzola, G. R. (2006). Schwemmholz: Probleme und Lösungsansätze (Large wood: problems and countermeasures). VAW-Mitteilung 188 (H.-E. Minor, ed.). ETH Zurich, Switzerland (in German). https://ethz.ch/content/dam/ethz/special-interest/baug/vaw/vaw-dam/documents/das-institut/mitteilungen/2000-2009/188.pdf
- Meninno, S., Canelas, R. B., & Cardoso, A. H. (2019). Coupling check dams with large wood retention structures in clean water. Environmental Fluid Mechanics, https://doi.org/https://doi.org/10.1007/s10652-019-09711-y
- Meyer-Peter, E., & Müller, R. (1948). Formulas for bedload transport. Proc. 2nd IAHR Congress, Vol. A2, 1–26, IAHR. Delft, The Netherlands.
- Piton, G., Mano, V., Richard, D., Evin, G., Laigle, D., Tacnet, J., & Rielland, P. (2019). Design of a debris retention basin enabling sediment continuity for small events: The Combe de Lancey case study (France). In Proc. 7th Inter. Conf. on Debris-Flow Hazards Mitigation: Mechanics, Prediction, and Assessment, Golden, CO, USA.
- Piton, G., & Recking, A. (2016a). Design of sediment traps with open check dams. I: Hydraulic and deposition processes. Journal of Hydraulic Engineering, 142(2), 04015045. https://doi.org/https://doi.org/10.1061/(ASCE)HY.1943-7900.0001048
- Piton, G., & Recking, A. (2016b). Design of sediment traps with open check dams. II: Woody debris. Journal of Hydraulic Engineering, 142(2), 04015046. https://doi.org/https://doi.org/10.1061/(ASCE)HY.1943-7900.0001049
- Ravazzolo, D., Mao, L., Mazzorana, B., & Ruiz-Villanueva, V. (2017). Brief communication: The curious case of the large wood-laden flow event in the Pocuro stream (Chile). Natural Hazards and Earth System Sciences, 17(11), 2053–2058. https://doi.org/https://doi.org/10.5194/nhess-17-2053-2017
- Rickenmann, D. (1990). Bedload transport capacity of slurry flows at steep slopes [Doctoral dissertation]. ETH Zurich. https://ethz.ch/content/dam/ethz/special-interest/baug/vaw/vaw-dam/documents/das-institut/mitteilungen/1990-1999/103.pdf
- Rossi, G., & Armanini, A. (2019). Experimental analysis of open check dams and protection bars against debris flows and driftwood. Environmental Fluid Mechanics, https://doi.org/https://doi.org/10.1007/s10652-019-09714-9
- Roth, A., Jafarnejad, M., Schwindt, S., & Schleiss, A. (2018). Design optimization of permeable sediment traps for fluvial bed load transport. Proc. River Flow 2018, Lyon, France. https://doi.org/https://doi.org/10.1051/e3sconf/20184003009
- Ruiz-Villanueva, V., Piégay, H., Gaertner, V., Perret, F., & Stoffel, M. (2016). Wood density and moisture sorption and its influence on large wood mobility in rivers. Catena, 140, 182–194. https://doi.org/https://doi.org/10.1016/j.catena.2016.02.001
- Ruiz-Villanueva, V., Mazzorana, B., Bladé, E., Bürkli, L., Iribarren-Anacona, P., Mao, L., Nakamura, F, Ravazzolo, D, Rickenmann, D, Sanz-Ramos, M, Stoffel, M, & Wohl, E. (2019). Characterization of wood-laden flows in rivers: Wood-laden flows. Earth Surface Processes and Landforms, 44(9), 1694–1709.https://doi.org/https://doi.org/10.1002/esp.4603
- Schalko, I. (2020). Wood retention at inclined racks: Effects on flow and local bedload processes. Earth Surface Processes and Landforms, 45(9), 2036–2047. https://doi.org/https://doi.org/10.1002/esp.4864
- Schalko, I., Lageder, C., Schmocker, L., Weitbrecht, V., & Boes, R. M. (2019a). Laboratory flume experiments on the formation of spanwise large wood accumulations part I: Effect on backwater rise. Water Resources Research, 55(6), 4854–4870. https://doi.org/https://doi.org/10.1029/2018WR024649
- Schalko, I., Lageder, C., Schmocker, L., Weitbrecht, V., & Boes, R. M. (2019b). Laboratory flume experiments on the formation of spanwise large wood accumulations part II: Effect on local scour. Water Resources Research, 55(6), 4871–4885. https://doi.org/https://doi.org/10.1029/2019WR024789
- Schalko, I., Schmocker, L., Weitbrecht, V., & Boes, R. M. (2018). Backwater rise due to large wood accumulations. Journal of Hydraulic Engineering, 144(9), 04018056. https://doi.org/https://doi.org/10.1061/(ASCE)HY.1943-7900.0001501
- Schwindt, S. (2017). Hydro-morphological processes through permeable sediment traps at mountain rivers [Doctoral dissertation]. EPFL. https://infoscience.epfl.ch/record/229862/files/EPFL_TH7655.pdf?version=1
- Schwindt, S., Franca, M. J., Reffo, A., & Schleiss, A. J. (2018). Sediment traps with guiding channel and hybrid check dams improve controlled sediment retention. Natural Hazards and Earth System Sciences, 18(2), 647–668. https://doi.org/https://doi.org/10.5194/nhess-18-647-2018
- Shields, A. (1936). Anwendung der Aehnlichkeitsmechanik und der Turbulenzforschung auf die Geschiebebewegung (Application of similarity principles and turbulence research to bed-load movement) [Doctoral dissertation]. Technical University Berlin. (in German). http://www.ancientportsantiques.com/wp-content/uploads/Documents/ENGINEERING/Fluvial/Shields1936.pdf
- Shima, J., Moriyama, H., Kokuryo, H., Ishikawa, N., & Mizuyama, T. (2016). Prevention and mitigation of debris flow hazards by using steel open-type sabo dams. International Journal of Erosion Control Engineering, 9(3), 135–144. https://doi.org/https://doi.org/10.13101/ijece.9.135