
 ?Mathematical formulae have been encoded as MathML and are displayed in this HTML version using MathJax in order to improve their display. Uncheck the box to turn MathJax off. This feature requires Javascript. Click on a formula to zoom.
Abstract
The dependency of the friction factor on the flow direction was investigated experimentally in a milled scale model of an unlined rock blasted tunnel under pressurized flow conditions by reversing the flow direction. The experimental data were used to highlight the significance of anisotropic roughness structures and variations in the cross-sectional area on the flow resistance. It is hypothesized that local sudden expansions of the cross-sectional area, which are followed by gradual contractions, contribute significantly to the directional dependency of the friction factor due to potential flow separation. For the reversed case, i.e. when sudden large-scale contractions were followed by gradual expansions, 15% lower friction factors were observed. The results were also used to highlight the scale dependency of these topographical features, the dependency of the friction factor from the tunnel driving direction, and to show the need for the development of methods that can be used to parameterize the directional dependency of hydraulic roughness and friction factors.
1 Introduction
The roughness of alluvial streams and engineered waterways plays a key role in hydraulic and environmental engineering applications as it determines flow properties such as flow velocity distribution, turbulence characteristics, conveyance capacity and, hence, flow resistance. The dependency of flow resistance from roughness features has been a focus of research for a long time and has mainly been quantified by semi-empirical approaches based on roughness coefficients such as Manning’s n, or more theoretically justified by relating the Darcy–Weisbach friction factor f to the equivalent sand roughness ks in the transitionally or fully turbulent flow regime. However, the equivalent sand roughness represents a hydraulic roughness scale, which requires the existence of the logarithmic velocity distribution, and this is not necessarily the case in many applications (e.g. Chung et al., Citation2021; Nikora et al., Citation2019).
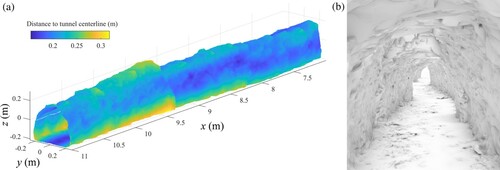
Figure 1 Visualization of surface and cross-sectional roughness patterns of the tunnel scale-model under investigation (cf. Section 2). (a) Tunnel geometry for 7.00 m ≤ x ≤ 11 m and (b) a view into the tunnel from x = 11 m in the direction of tunnel driving (towards the origin of the x-axis). The transition from one truncated cone to another is clearly visible in (a), e.g. at x ≈ 9.5 m and x ≈ 8.5 m. The centreline of the shown tunnel section corresponds to the main x-axis of the cylindrical coordinate system used for the analysis
The flow resistance for both open-channel flows and pressurized flows depends on a large number of parameters characterizing the flow (e.g. Reynolds number, non-uniformity, unsteadiness), subsurface characteristics (e.g. permeable/impermeable), characteristics of the wetted surface (e.g. vertical roughness height, frontal and plan solidity of the roughness elements, arrangement and shape of the roughness elements, composite roughness patterns), local cross-sectional geometry and the spatial variability thereof, topographical variations in longitudinal direction (e.g. bed forms, waviness), conduit plan-form (e.g. sinuosity) to name just a few (e.g. Chung et al., Citation2021; Ferguson et al., Citation2019; Moody, Citation1944; Nikora et al., Citation2019; Schlichting & Gersten, Citation2006; Yen, Citation2002). Due to the large number of parameters, it is not surprising that scientifically accepted methods to determine roughness coefficients from measurable topographical properties are still lacking (Chung et al., Citation2021; Flack, Citation2018; Nikora et al., Citation2019).
Moreover, there is still a debate on well-accepted metrics to determine the hydraulic roughness of anisotropic roughness patterns, i.e. to determine roughness coefficients for one and the same surface or conduit when they are exposed to different flow directions (e.g. Chung et al., Citation2021). This means that waterways characterized by identical surface and geometrical properties (e.g. vertical roughness height, frontal and plan solidity, plan form) may exert a different flow resistance when they are exposed to different flow directions (e.g. Chung et al., Citation2021; Navaratnam et al., Citation2018; Reinius, Citation1970).
This issue is in the scope of the present Technical Note (TN), in which we present a unique dataset for the dependency of the friction factor from the flow direction in a milled scale-model of an unlined rock blasted tunnel under pressurized flow conditions. Unlined rock blasted tunnels are impermeable man-made conduits that are used in hydropower schemes for conveying water to the powerhouse or for discharging excess water through spillways in mountainous areas. They are characterized by a highly heterogeneous, complex and scale dependent roughness structure, which is exemplarily visualized by a short reach of the tunnel investigated in this TN in .
The roughness of unlined rock blasted tunnels is characterized by different scales ranging from crystal roughness through surface roughness to cross-sectional roughness (e.g. Priha, Citation1969). The micro-scale crystal roughness depends on geological properties of the rocks, which are important for the excavation process and tunnel stability and, hence, may indirectly affect surface and cross-sectional roughness. The surface roughness depends on the unevenness of the fracture surface (b), and the cross-sectional roughness is associated with the large variation in size and shape from one cross-section to another, e.g. due to overbreak associated with the blasting (e.g. Colebrook et al., Citation1959; Rahm, Citation1953, Citation1958; cf. a). The dependency of the friction factor on the micro-scale crystal roughness can be assumed to be negligible compared to the effect of surface and cross-sectional roughness, which are typically considered as the main parameters for the energy losses in such conduits.
The cross-sectional variations of unlined rock blasted tunnels visualized in a are characterized by longitudinal serrations along the tunnel wall and roof resembling a series of truncated cones (Colebrook et al., Citation1959). The asymmetrical shape of the serrations depends on geological parameters (e.g. rock strength) and the blasting technique (e.g. Basnet & Panthi, Citation2018). Their typical shape may be characterized by gradual expansions alternating with sudden contractions (in the direction of driving) or sudden expansions alternating with gradual contractions in the opposite direction. In the discussion paper of Colebrook et al. (Citation1959), it was assumed that this pattern results in higher head losses for water flowing in the opposite direction of the tunnel driving, but this assumption has not yet been proven by experimental data from one and the same tunnel reach. Moreover, the directional dependency of the cross-sectional roughness has not been accounted for in existing approaches for the determination of friction factors or surrogate measures for the equivalent sand roughness ks from topographical data (e.g. Colebrook et al., Citation1959; Rahm, Citation1958; Reinius, Citation1970; Rønn & Skog, Citation1997; Watson & Marshall, Citation2018). It is worth mentioning that the horseshoe shape of the tunnel cross-section and the composite roughness pattern due to the different roughness of the tunnel walls and invert (cf. b) add an additional level of complexity to the determination of roughness coefficients for this conduit-type, so that all existing approaches need to be considered as purely empirical.
In this TN we present results of a unique experimental series, in which the friction factors were evaluated under pressurized flow conditions for the two possible flow directions in a milled model of an unlined rock blasted tunnel. Note that the evaluation of the performance of existing approaches for the determination of friction factors is beyond the scope of the present TN and will be presented in a follow up study together with data from three additional tunnels that were tested in the framework of the present research project. The manuscript is structured as follows: the experimental set-up and procedure are described in Section 2 and the results are presented and discussed in Section 3. Section 4 concludes the paper.
2 Experimental set-up and procedure
2.1 Scale model
The experiments were carried out in the hydraulic laboratory of the Leichtweiß-Institute for Hydraulic Engineering and Water Resources at the Technische Universität (TU) Braunschweig, Germany. A point cloud consisting of approximately 282 million points of a 178.57 m long unlined rock blasted tunnel reach belonging to the Evanger hydropower plant in Norway served as the basis for the construction of a 1:15 scale model (length 11.89 m, mean tunnel width and height 0.440 m and 0.406 m, respectively). The model was milled using the 5–axis CNC-controlled milling facility of the Digital Building Fabrication Laboratory at TU Braunschweig following the procedure described in Henry et al. (Citation2018) and Aberle et al. (Citation2021). In order to guarantee the manageability of the data for the milling process, the spatial resolution of the point cloud had to be reduced, so that a three-dimensional mesh consisting of 946,832 triangles was finally used as input for the milling and to determine the characteristic geometrical parameters of the tunnel. The comparison of the mesh used for the milling with a digital reproduction of the milled model obtained by Structure-from-Motion photogrammetry (not shown here) revealed that the mean deviation between the two digital tunnels corresponded to 0.1 mm and that the standard deviation of the cloud to cloud distance corresponded to 1.4 mm. Further information on the milling process and the accuracy of the constructed scale model can be found in Aberle et al. (Citation2021).
The tunnel model was connected to a water supply system consisting of a head tank and a pipe system, which was fed by the laboratory water circuit. The modification of the piping between head tank and the tunnel in- and outlet enabled the reversal of the flow direction in the tunnel model (cf. ). The transition from the circular pipe cross-section (pipe diameter d = 0.2 m) to the horseshoe shaped tunnel cross-section was achieved by two milled 0.95 m long transition sections. Flow straighteners consisting of small PVC-pipes with a diameter of 0.03 m were installed in the pipe system before the transition section to condition the flow.
Figure 2 Sketch of the scale model set-up for (a) forward flow direction and (b) reversed flow direction (not to scale). The tunnel driving direction is from right to left
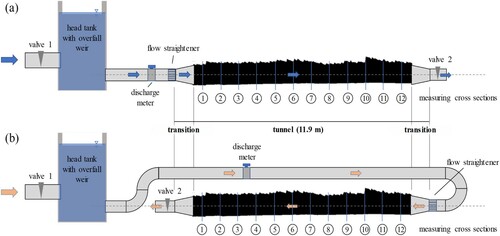
Two valves situated at the inlet of the head tank and at the outlet pipe of the tunnel, respectively, were used to achieve a constant water level in the head tank for all tested discharges. The discharge was measured in a straight section of the supply pipe with an inductive discharge meter (Krohne Optiflux 2000/IFC300, accuracy 0.2% of the measured value). Pressure measurements were carried out at 12 cross-sections along the tunnel which were separated by a distance of 1 m (). The first measurement cross-section (CS) was at 0.5 m and 0.4 m from the beginning of the tunnel for the forward and reversed direction, respectively. The mean static pressure in each cross-section was measured by Keller PR-25 pressure sensors (range 0–35,000 Pa, accuracy 0.2% of the full-scale pressure) for a duration of 2 min at a sampling frequency of 200 Hz. Each pressure sensor was connected to 16 pressure taps installed around the peripheral of each measuring cross-section to mimic the principle of a piezometer-ring (see also Aberle et al., Citation2020). The pressure sensors were calibrated at the beginning of each measurement day against known pressure heads. All experiments were carried out with steady flow conditions. The experiments for both the forward and reversed flow conditions started with a discharge of Q = 0.01 m³ s−1 which was increased by increments of ΔQ = 0.01 m³ s−1 to the maximum possible discharge (0.107 m³ s−1 and 0.093 m³ s−1 for the forward and reversed flow conditions, respectively). For the forward flow conditions, measurements were conducted twice at two consecutive days for all discharges and the reversed flow measurements were repeated three times. These measurements showed a high degree of reproducibility and averaged values from the repeated measurements were used for the data analyses. The results from the measurements for the smallest discharge of Q = 0.01 m³ s−1 are not reported, because the corresponding head losses were too small, and hence, within the range of the measurement accuracy.
2.2 Data analyses
The pressure measurements were used to determine the total head he at each measurement cross-section according to:
(1)
(1)
where pi is the measured pressure at cross-section i, ρ is the fluid density, g the acceleration due to gravity, Q the discharge, and Ai the cross-sectional area at cross-section i. The kinematic correction factor α was assumed to be equal to unity due to the unknown velocity distributions at the measurement cross-sections. Since we measured the mean pressure around the tunnel perimeter at the measurement cross-sections, we assumed a hydrostatic pressure distribution to apply Eq. (1). The friction factor f was determined between two cross-sections i and j from:
(2)
(2)
where Se,i-j denotes the energy slope which was determined from a linear regression analysis of the head losses hf between cross-sections i and j,
the mean hydraulic diameter, and Vm,i-j = Q
−1 the mean velocity in the reach between cross-sections i and j. Vm,i-j corresponds to a volume-averaged velocity as the mean cross-sectional area
between the cross-sections i and j and was calculated by dividing the volume of the considered tunnel section by its length. The mean hydraulic diameter
was also calculated using volume averaged quantities as
= 4
−1, where the mean wetted perimeter
was calculated by dividing the surface area of the considered tunnel section by its length. The required tunnel geometrical parameters were determined from the mesh that served as input for the milling.
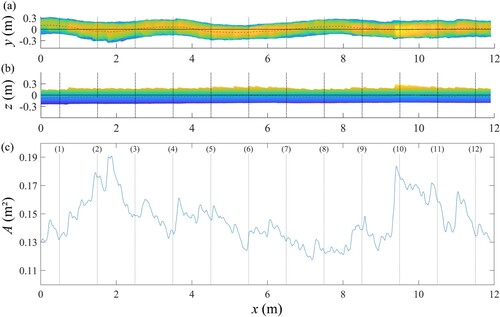
Owing to the horseshoe-shaped cross-sectional area of the tunnel, a cylindrical reference system, with the longitudinal coordinate as the reference direction for the main axis, was used for the determination of the geometrical parameters. For this purpose, the mesh was transformed into a digital elevation model in cylindrical coordinates (CDEM) and the longitudinal coordinate axis was aligned with the principal axis of the point cloud by considering the centroid of the point cloud and performing an eigendecomposition of the covariance matrix. a shows the orientation of the longitudinal coordinate axis in the plan view together with a projection of the line connecting the centroids of 2300 tunnel cross-sections (separated by Δx = 0.0052 m) that were defined by 300 points along the perimeter (i.e. by using 300 different angular coordinates; Δφ = 1.2°). The CDEM was also used to extract wall-profiles along the x-axis for constant angular coordinates φ. Each profile was linearly detrended before it was analysed further (cf. Section 3). b shows the side view of the tunnel and c the variation of the cross-sectional area along the tunnel.
Figure 3 (a) Top view of the investigated tunnel reach with the tunnel centreline (dashed red) and the main axis of the CDEM (solid black line); (b) side view of the tunnel along the main axis; and (c) variation of the cross-sectional area along the tunnel. The numbers in brackets indicate the position of the measurement cross-sections. The colours in figures (a) and (b) scale with the z-axis
The following analyses focus on the tunnel reach between CS2 (x2 = 1.5 m) and CS11 (x11 = 10.5 m). The pressure measurements from the first and last cross-section (CS1 and CS12) were neglected to minimize the impact of the in- and outflow section on the measurements. The distance from the first cross-section used for the analyses to the transition section corresponded to approximately four times the mean hydraulic diameter for both flow scenarios. This distance was assumed to be large enough due to the smooth transition of the cross-sectional area from the pipe to the tunnel and the highly heterogenous roughness pattern of the tunnel.
3 Results and discussion
3.1 Tunnel geometrical parameters
The composite roughness pattern of the tunnel becomes apparent from Figs. b and b that visualize the smooth invert and rough tunnel walls. The difference in roughness elevations between the invert and tunnel walls for the reach between CS2 and CS11 was quantified by the mean standard deviation of 50 longitudinal profiles along the invert (σ = 0.0047 m) and of 204 longitudinal profiles along the side walls and the roof (σ = 0.0455 m). Considering all 300 profiles that could be extracted from the CDEM, i.e. by including profiles that cover both the invert and the walls, the mean standard deviation was σ = 0.0377 m.
The side view of the tunnel (b) and the longitudinal variation of the cross-sectional areas, shown in c, visualize the cross-sectional roughness. The average cross-sectional area between CS2 and CS11 corresponded to = 0.146 m2, the minimum and maximum cross-sectional areas were Amin = 0.118 m2 (x = 7.19 m) and Amax = 0.191 m2 (x = 1.88 m), respectively, and the standard deviation of the cross-sectional areas was σA = 0.017 m2. The ratio AmaxAmin−1 = 1.62 and the coefficient of variation
= 11.4% reveal the variability of the cross-sectional areas. The mean hydraulic diameter
corresponded to 0.368 m.
The tunnel planform shown in a reveals five bends in the model section from x = 0 to x ≈ 9 m. The first two bends at x ≈ 0.5 m and 1.9 m were characterized by radii of r = 4.2 m, and the other bends at x ≈ 3.8 m, 5 m, and 7.8 m had radii of r = 9.3, 7.3 and 15.7 m, respectively. The ratio of the bend radius to mean hydraulic diameter ri−1 was larger than 10 for all bends. We, therefore, hypothesize that the head losses associated with these bends are of minor nature, especially when discussing the dependency of the tunnel roughness on the flow direction.
A relatively simple measure for the characterization of the directional dependency of the tunnel roughness may be derived from the analysis of surface inclinations using the aforementioned 204 wall and roof profiles. Local surface inclinations were defined by the angle α = tan−1((zi+τ − zi)l−1) between two points along a wall- or roof profile with a separation distance of l = xi+τ − xi, where the z-values represent the elevation of the corresponding detrended longitudinal profiles with zero mean, and the index τ indicates the spatial lag between the points. For the smallest spatial lag l = Δx (τ = 1), the mean angle corresponded to αm = −0.28° (median angle αmd = −1.64; αmax = 82.61° and αmin = −76.65) showing that the surface was, on average, slightly inclined towards the tunnel main axis in the forward direction. The number of negative angles was larger than the number of positive angles, and the positive inclinations were characterized by larger absolute values, which becomes also apparent from Figs. a and b. We note that a similar parameter, the effective slope, has been proposed in the literature to quantify the mean absolute streamwise gradient of a rough surface (Chung et al., Citation2021). This parameter, however, is based on absolute values of the gradients and is, hence, not suitable for the characterization of the directional dependency of the roughness.
Instead, we focused on the analysis of the inclination index I according to Smart et al. (Citation2004), which is defined as the difference between the number of positive and negative inclinations divided by the total number of inclinations at a given separation distance. The analysis revealed that I was negative for l < 1.22 m (i.e. 18.3 m in prototype scale) and it showed a local maximum at l ≈ 0.37 m, which corresponds to approximately 5.5 m in prototype conditions. Interestingly, this length scale was close to the blasting frequency, which we estimated to be at around 5 m from a visual inspection of the power spectra (not shown here). For the positive range of I, two local maxima were observed at l ≈ 1.80 m and l ≈ 3.42 m (i.e. 27 m and 51.3 m in prototype dimensions), which we associate with the influence of the slight tunnel curvature as we analysed longitudinal profiles extracted from the CDEM (cf. Section 2.2). The larger number of negative inclinations in forward direction associated with the length scale corresponding to the blasting frequency together with the shape of the serrations (cf. Figs. a and c) is a strong indicator that this flow direction corresponds to the opposite driving direction of the tunnel.
Figure 4 Head losses along the tunnel cross-sections in relation to the head at the second cross-section in flow direction for (a) the forward runs and (b) the reversed runs. The blue line indicates variation of the cross-sectional area along the tunnel (cf. c)
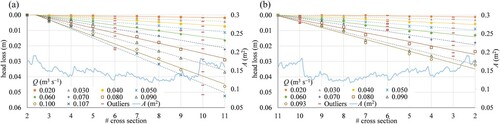
Table 1 Reynolds numbers, head losses and friction factors for the forward and reversed flow directions for the reach CS2–CS11
3.2 Head losses and friction factors
presents the cumulative head losses for the forward (a) and reversed (b) flow directions between CS2 and CS11, respectively. For the preparation of the figure, the head loss hf was set to zero at the first measurement cross-section and the subsequent values were determined from the differences in total head Δhe between two subsequent cross-sections. We identified outliers at CS6 and CS10 for both flow directions and all discharges, so that these data were discarded in our analyses. We hypothesize that the observed deviations were due to local peculiarities of the tunnel geometry at CS6 and CS10. Figures c and show that CS6 is located at a position which is characterized by a large absolute value of the gradient dA/dx, so that the pressure measurements may be biased by dynamic pressure and flow separation. A similar explanation may be given for the deviating head losses at CS10, as this cross-section was located in the vicinity of a sudden large-scale change in cross-sectional area (cf. Figs. c and ). We further note that the measurements at CS3 were omitted for the reversed flow direction, as the consideration of these values would have resulted in negative head losses for some discharges, which is physically not feasible. The reason for this remains unclear and we can only hypothesize that it was associated with the combined effect of variation in cross-sectional area and tunnel planform giving significant lateral pressure gradients.
Table 2 Mean cross-sectional area , ratio of maximum to minimum cross-sectional area AmaxAmin−1, coefficient of variation of the cross-sectional area Cv = σA
−1, mean hydraulic diameter
, and mean friction factors for the total and sub-reaches in forward (ff) and reversed (fr) flow direction for discharges Q > 0.03 m3 s−1, and ratio fr ff−1
The comparison of Figs. a and b shows that the head losses and, hence, the gradients Se and the friction factors f were larger for the forward than for the reversed flow direction for comparable discharges, confirming the assumption of Colebrook et al. (Citation1959) regarding the directional dependency of the head losses. The head losses between CS2 and CS11 are summarized in together with the Reynolds number Re = Vm,2–11 ν −1 (where ν denotes the kinematic viscosity) and the friction factors
and
for the forward and reversed flow direction, respectively. The Reynolds number ranged between 4.96 × 10⁴ ≤ Re≤ 2.71 × 10⁵ showing that turbulent conditions prevailed. The constant values of the friction factor for the forward (
≈ 0.079) and reversed flow conditions (
≈ 0.067), respectively, are a strong indicator for the fully turbulent flow regime. Moreover, the values reveal that the friction factors were about 15% smaller for the reversed flow conditions.
To investigate the observed difference between the friction factors for the forward and reversed flow direction in more detail, local friction factors were determined for three sub-reaches (CS2–CS5, CS4–CS9 and CS8–CS11). These were characterized by a different length (3, 5 and 3 m, respectively) and different cross-sectional roughness patterns (cf. ). summarizes the mean cross-sectional area , the ratio AmaxAmin−1, the coefficient of variation Cv = σA
−1 and the mean hydraulic diameter
for the sub-reaches together with the corresponding values for the total reach CS2–CS11. The sub-reach CS4–CS9 was characterized by the smallest values of
, AmaxAmin−1, Cv and
, which were even smaller than the values for the total reach. The low values of AmaxAmin−1 and Cv show that this sub-reach was more homogeneous in terms of cross-sectional roughness than the other reaches, i.e. that there were less large scale-variations in cross-sectional area (cf. Figs. c and ). The sub-reach CS2–CS5 was characterized by the largest mean cross-sectional area
and showed a larger variation in cross-sectional area between CS2 and CS3. The sub reach CS8–CS11 included a sudden large-scale change in cross-sectional area in the vicinity of CS10, being the reason for the largest values of AmaxAmin−1 and Cv for all sub-reaches. The determined friction factors for the sub-reaches were approximately constant for discharges Q > 0.03 m3 s−1 for the respective flow directions, so that only mean f-values are reported in . The values reported in the table reveal that f was again always smaller for the reversed flow direction (fr) compared to the forward direction (ff).
The smallest difference between the forward and reversed direction was observed for the most homogeneous sub-reach CS4–CS9. Large-scale variations in cross-sectional area, which may cause significant local losses, were not present in this sub-reach, so that we hypothesize that the observed difference in f depends on the directional dependency of the serrations, i.e. a gradual contraction (expansion) followed by a small-scale sudden expansion (contraction) in forward (reversed) direction, respectively. As mentioned before, this pattern may also be described by the inclination index I, which was negative for the forward and positive for the reversed direction for spatial scales corresponding to the blasting frequency. Moreover, ff and fr were in the same order of magnitude as for the total reach, which we associate with the smallest cross-sectional area and hydraulic diameter.
The difference between ff and fr was more pronounced for the sub-reaches CS2–CS5 and CS8–CS11, i.e. for sections that included a larger local variation in cross-sectional area between two subsequent measurement cross-sections. Although the friction factors for the sub-reach CS2–CS5 were smaller than the ones for the total reach, which may be associated with the largest cross-sectional area, they showed a larger directional dependency. A closer inspection of the cross-sectional areas in this region reveals that the variation in A between CS3 and CS5 resembles the one observed for the reach CS4–CS9 (cf. Figs. c and ). This leads to the hypothesis that the observed difference between ff and fr is due to the large-scale variation in A between CS2 and CS3. In the forward direction, this local reach is characterized by an expansion (associated with the maximum cross-sectional area Amax) which is followed by a gradual contraction; in reversed direction this corresponds to a gradual expansion followed by a contraction, i.e. it follows the aforementioned shape in regard to the driving direction of the tunnel.
The hypothesis about the effect of the shape of large-scale variations in cross-sectional area may be further substantiated by considering the results in the sub-reach CS8–CS11, which showed the largest difference between ff and fr. Compared to the local variation between CS2 and CS3, this sub-reach was characterized by a sudden local large-scale variation in A in the vicinity of CS10 (at x = 9.5 m; see also ). The pattern of this variation was similar to the one described before, i.e. a sudden expansion was followed by a gradual contraction of the cross-sectional area in forward direction. It is also interesting to note that ff for CS8–CS11 was larger than ff for the total reach but that fr was smaller than for the total reach.
Overall, the data reveal a systematic pattern regarding the dependency of the friction factor from the orientation of the serrations, which could be identified for the total reach as well as for three sub-reaches. In fact, larger friction factors were observed for the forward direction, for which both small- and large-scale geometrical variations may be characterized by sudden expansions along the tunnel walls and roof, which are followed by gradual contractions (i.e. the pattern corresponding to the opposite direction of the tunnel driving). We therefore hypothesize that the larger head losses are associated with flow separation at the expansions and that the order of magnitude of the head losses depends on the size of the expansions. In the reversed direction, the geometry of the serrations may be described by a gradual expansion followed by a sudden contraction (i.e. the pattern corresponding to the driving direction of the tunnel), and we hypothesize that flow separations due to sudden contractions are absent or less pronounced due to the overall structure of the serrations. This hypothesis is substantiated by the large ff and small fr values for the sub-reach CS8–CS11.
Although our results are confirmed by statements in the discussion paper of Colebrook et al. (Citation1959), they need to be discussed in light of some limitations. For example, the significance of the contraction/expansion ratio for the quantification of local head losses could not be addressed due to the experimental strategy and the rather heterogeneous geometry and structure of the serrations. We note again that it was not possible to unambiguously identify a characteristic serration length from the power-spectra of the longitudinal profiles, as the power spectra indicated self-similar patterns (not shown here), which may be investigated further in relation to rock and blasting characteristics in future studies. It was, however, possible to estimate the blasting frequency from the change in slope of the power spectra in log-log coordinates. Moreover, the heterogenous and composite roughness pattern of the investigated tunnel in combination with the horseshoe shaped tunnel geometry hampers the justification of the reported findings by knowledge on local losses in pipe flows (e.g. Rennels & Hudson, Citation2012) and the quantification of a single geometrical length scale such as the equivalent sand roughness ks to unambiguously parameterize the hydraulic roughness of such conduits.
The detailed flow pattern at locations of interest within the tunnel could not be measured experimentally due to the highly complex boundary conditions, but may be investigated in more detail using high-resolution CFD simulations (see also Aberle et al., Citation2020; Andersson et al., Citation2019, Citation2021). Finally, it is worth mentioning that our results confirm the assumptions of Colebrook et al. (Citation1959) but are contradictory to the results of Reinius (Citation1970) who based his observations on open-channel flow experiments in a flume with triangularly shaped wavy bottom geometries to simulate serrations. We associate these differences with differences between a pressurized flow field in a tunnel of irregular roughness (present study) and flume experiments with a triangularly shaped wavy bottom (Reinius, Citation1970).
4 Conclusions
This study investigated the directional dependency of the friction factor and head losses using experimental data from a milled scale model of an unlined rock blasted tunnel. The results of the study revealed that the orientation and structure of serrations associated with overbreak roughness had a major impact on the directional dependency of the friction factor. The data were used to highlight that local large-scale sudden expansions of the cross-sectional area, followed by gradual contractions, contributed most significantly to the directional dependency of the friction factor. For the reversed case, i.e. when sudden large-scale contractions were followed by gradual expansions, smaller friction factors were observed. The data were also used to highlight the scale dependency of these topographical features and, hence, revealed the dependency of the friction factor on the driving direction and the blasting pattern of the tunnel.
The results of this study are directly relevant for practical applications. For example, the efficiency of hydropower plants with unlined rock blasted tunnels can be improved by driving the tunnel towards the turbine if this is possible due to the local boundary conditions in the project area. Similarly, the results may be helpful for the construction of pressurized parts of unlined spillway tunnels and to assess the potential for upgrading existing hydropower plants with large reservoirs and unlined tunnel sections to pump storage plants, as currently planned in Norway (e.g. Pitorac et al., Citation2020). Moreover, the presented findings pave the way for further studies related to the hydraulic resistance of unlined rock blasted tunnels by showing the need to account for the directional dependency of such conduits in hydraulic scale models with simplified set-ups. Besides these hydropower related applications, the results may also be useful for further interdisciplinary applications such as the hydraulic resistance of subglacial conduits (e.g. Mankoff et al., Citation2017), or pave the way for further insights into the hydraulic resistance of flows with a free surface and varying flow directions such as tidal waterways.
Overall, the results demonstrate the need for further research to develop parameters describing the directionality of roughness for the determination of wall roughness coefficients of technical and natural waterways. As shown in this TN, this may be achieved by defining parameters derived from the statistical analysis of surface texture patterns using high-resolution topographical data.
Notation
| A | = | cross-sectional area (m2) |
| = | reach averaged cross-sectional area (m2) | |
| Cv | = | coefficient of variation (–) |
| D | = | hydraulic diameter (m) |
| = | reach averaged hydraulic diameter (m) | |
| f | = | friction factor |
| g | = | gravity acceleration (m s−2) |
| he | = | total head (m) |
| hf | = | head loss (m) |
| l | = | separation distance (m) |
| p | = | pressure (Pa) |
| Q | = | discharge (m s−3) |
| r | = | radius of bends (m) |
| Se | = | slope of the energy line (–) |
| Re | = | Reynolds number (–) |
| V | = | mean reach averaged velocity (m s−1) |
| Δx | = | sampling interval in x direction (m) |
| ρ | = | fluid density (kg m3 s−1) |
| σA | = | standard deviation of cross-sectional areas (m2) |
| φ | = | angular coordinate (°) |
Disclosure statement
No potential conflict of interest was reported by the authors.
Additional information
Funding
- Aberle, J., Eikenberg, R., Branß, T., & Henry, P.-Y. (2021). Technical note: On the production and accuracy of CNC-manufactured hydraulic scale models. Water, 13(7), 916. https://doi.org/https://doi.org/10.3390/w13070916
- Aberle, J., Henry, P.-Y., Kleischmann, F., Navaratnam, C. U., Vold, M., Eikenberg, R., & Olsen, N. R. B. (2020). Experimental and numerical determination of the head loss of a pressure driven flow through an unlined rock-blasted tunnel. Water, 12(12), 3492. https://doi.org/https://doi.org/10.3390/w12123492
- Andersson, L. R., Hellström, J. G. I., Andreasson, P., & Lundström, T. S. (2019). Numerical investigation of a hydropower tunnel: Estimating localised head-loss using the Manning equation. Water, 11(8), 1562. https://doi.org/https://doi.org/10.3390/w11081562
- Andersson, L. R., Larsson, I. A. S., Hellström, J. G. I., Burman, A. J., & Andreasson, P. (2021). Localized roughness effects in non-uniform hydraulic waterways. Journal of Hydraulic Research, 59(1), 100–108. https://doi.org/https://doi.org/10.1080/00221686.2020.1744744
- Basnet, C. B., & Panthi, K. K. (2018). Roughness evaluation in shotcrete-lined water tunnels with invert concrete based on cases from Nepal. Journal of Rock Mechanics and Geotechnical Engineering, 10(1), 42–59. https://doi.org/https://doi.org/10.1016/j.jrmge.2017.07.006
- Chung, D., Hutchins, N., Schultz, M. P., & Flack, K. A. (2021). Predicting the drag of rough surfaces. Annual Review of Fluid Mechanics, 53(1), 439–471. https://doi.org/https://doi.org/10.1146/annurev-fluid-062520-115127
- Colebrook, C. F., Lamont, P. A., Ackers, P., Rahm, L., Aitken, P. L., Roberts, C. M., Davis, C. V., Neilson, A. O. H., Lacey, G., Thinessard, G., Vail, A. J., Blackmore, W. E., Francis, J. R. D., Gerrard, R. T., Wolf, P. O., & Danel, P. (1959). Discussion. The flow of water in unlined, lined, and partly lined rock tunnels. Proceedings of the Institution of Civil Engineers, 12(4), 523–562. https://doi.org/https://doi.org/10.1680/iicep.1959.12106
- Ferguson, R. I., Hardy, R. J., & Hodge, R. A. (2019). Flow resistance and hydraulic geometry in bedrock rivers with multiple roughness length scales. Earth Surface Processes and Landforms, 44, 2437–2449. https://doi.org/https://doi.org/10.1002/esp.4673
- Flack, K. A. (2018). Moving beyond Moody. Journal of Fluid Mechanics, 842, 1–4. https://doi.org/https://doi.org/10.1017/jfm.2018.154
- Henry, P.-Y., Aberle, J., Navaratnam, C. U., & Rüther, N. (2018). Hydraulic physical model production with Computer Numerically Controlled (CNC) manufacturing techniques. E3S Web of Conferences, 40, 05065. https://doi.org/https://doi.org/10.1051/e3sconf/20184005065
- Mankoff, K. D., Gulley, J. D., Tulaczyk, S. M., Covington, M. D., Liu, X., Chen, Y., Benn, D. I., & Głowacki, P. S. (2017). Roughness of a subglacial conduit under Hansbreen, Svalbard. Journal of Glaciology, 63(239), 423–435. https://doi.org/https://doi.org/10.1017/jog.2016.134
- Moody, L. F. (1944). Friction factors for pipe flow. Transactions of the AMSE, 66(8), 671–684.
- Navaratnam, C. U., Aberle, J., Qin, J., & Henry, P.-Y. (2018). Influence of gravel-bed porosity and grain orientation on bulk flow resistance. Water, 10(5), 561. https://doi.org/https://doi.org/10.3390/w10050561
- Nikora, V. I., Stoesser, T., Cameron, S. M., Stewart, M., Papadopoulos, K., Ouro, P., McSherry, R., Zampiron, A., Marusic, I., & Falconer, R. A. (2019). Friction factor decomposition for rough-wall flows: theoretical background and application to open-channel flows. Journal of Fluid Mechanics, 872, 626–664. https://doi.org/https://doi.org/10.1017/jfm.2019.344
- Pitorac, L., Vereide, K., & Lia, L. (2020). Upgrading hydropower plants to pump storage plants: a hydraulic scale model of the tunnel system. Proceedings 8th IAHR international symposium on hydraulic structures ISHS2020, Santiago, Chile. https://doi.org/https://doi.org/10.14264/uql.2020.602
- Priha, S. (1969). Hydraulic properties of small unlined rock tunnels. Journal of the Hydraulics Division, 95(4), 1181–1210. https://doi.org/https://doi.org/10.1061/JYCEAJ.0002120
- Rahm, L. (1953). Flow problems with respect to intakes and tunnels of Swedish hydro-electric power plants. In Bulletin 36 (pp. 143–209). Institution of Hydraulics at the Royal Institute of Technology. Stockholm, Sweden Section 3.
- Rahm, L. (1958). Friction losses in Swedish rock tunnels. Water Power, 10, 457–464.
- Reinius, E. (1970). Head losses in unlined rock tunnels. Water Power, July/August 1970, 246–252.
- Rennels, D. C., & Hudson, H. M. (2012). Pipe flow: A practical and comprehensive guide. Wiley.
- Rønn, P.-E., & Skog, M. (1997). New method for estimation of head loss in unlined water tunnels. In E. Broch, D.K. Lysne, N. Flatabø, & E. Helland-Hansen (Eds.), Hydropower (pp. 675–682). Balkema.
- Schlichting, H., & Gersten, K. (2006). Grenzschicht-Theorie. 10. überarbeitete Auflage. Springer.
- Smart, G. M., Aberle, J., Duncan, M., & Walsh, J. (2004). Measurement and analysis of alluvial bed roughness. Journal of Hydraulic Research, 42(3), 227–237. https://doi.org/https://doi.org/10.1080/00221686.2004.9728388
- Watson, C., & Marshall, J. (2018). Estimating underground mine ventilation friction factors from low density 3D data acquired by a moving LiDAR. International Journal of Mining Science and Technology, 28(4), 657–662. https://doi.org/https://doi.org/10.1016/j.ijmst.2018.03.009
- Yen, B. C. (2002). Open channel flow resistance. Journal of Hydraulic Engineering, 128(1), 20–39. https://doi.org/https://doi.org/10.1061/(ASCE)0733-9429(2002)128:1(20)