ABSTRACT
Trade unions were important actors in the advanced capitalist countries until the late 1970s, but since the 1980s, union membership is declining. Whether this decline has been homogenous is crucial. Because unions may still have power and non-homogenous decline implies that some groups benefit from this power disproportionately. However, we don’t have instruments to scrutinize this dynamic properly. To fill the gap, this study develops a model that identifies privileged groups within trade unions by informing us about the relative strength of a group within trade unions, the ability of this group to use the union power, and the extent to which union members belonging to the group would advance the interests of the entire group by using this power.
Introduction
During the post–Second World War period until the late 1970s, trade unions were a key element in the “the standard model of democracy” prevailing in the OECD countries (Streeck, Citation2016, p. 21). They have been “one of the most important actors shaping our future” (Clegg, Citation1976, p. 1), and thus, it was not unusual for governments to take trade unions’ demands into account in determination of social and economic policies. However, since the 1980s, union membership started to decline almost everywhere (Gumbrell-McCormick & Hyman, Citation2013), and during the same period, advanced capitalist societies have undergone substantial political and economic changes that reshaped social stratification patterns: the rise of neoliberalism (Crouch, Citation2011, Harvey, Citation2005), decline of industry and rise of service sector (Checchi & Visser2005), privatization and decreasing public employment (Ebbinghaus & Visser, Citation1999, p. 141), expansion of non-standard and precarious work, emergence of international outsourcing as the dominant production paradigm (Barbieri, Citation2009; Kalleberg, Citation2000, Citation2009), and computerization of routine manual and cognitive tasks (Goos & Manning, Citation2007; Goos, Manning, & Salomons, Citation2009). The relationship between declining trade union membership and these transformations is an interesting topic. But within this context of societal change, it is also interesting to examine whether trade union decline has been a homogenous process affecting all segments of advanced capitalist societies in the same way. This is important because despite their declining membership, trade unions (may) still have some residual power either on their own right due to their reduced but still significant presence in society or because of peculiar functions they (still) fulfill in the institutional landscapes that usually change slower than the societies that they regulate.
Therefore, within the context of changing social stratification patterns resulting from deep transformations and declining trade union membership, it is useful to examine which groups retain or perhaps gain power due to their presence within unions. But, unfortunately, we don’t have proper analytical instruments for such an inquiry. Trade union density, the usual indicator of trade union strength, which equals to the proportion of union members to wage and salary earners (Visser, Citation1991), fails to inform us about three crucial things: the relative strength of any given group within unions, the ability of this group to use the trade union power, and the extent to which union members belonging to the group would advance the interests of the entire group by using this power. The purpose of this study is to develop a mathematical model that would enable us to observe these three things and thus enable us to see the extent to which any given social group obtains a privileged position within trade unions. The basic idea is to integrate two dynamics for the purpose of developing a two-dimensional model: (1) changing relative size of a given group within trade unions compared to the relative size of this group in society and (2) changing relative size of trade unions within any group compared to the relative size of trade unions in the entire society.
In the following pages, after pointing out the complex social and institutional factors that affect trade unions’ strength and the individual choice regarding whether or not to affiliate, I first provide a short overview of trade union density as an indicator to measure trade union strength and reveal its weaknesses. Then I introduce the elements of the model that I propose and define two new indicators: (relative) power and (relative) representation. After clarifying the basic features of these indicators, I show how they reveal privileged and underprivileged groups in terms of trade union representation and explore the conditions that induce union members from any given group to ignore the wider group interests as they try to use trade union power. As a final step in model building, I develop a visualization method that integrates all the insights captured by (relative) power and (relative) representation indicators. In the last section, I make an empirical inquiry by using the data provided by European Social Survey to illustrate how the tools that I propose may help our examination of trade unions. In this inquiry, I focus on the way in which three educational groups (people with low, middle, and tertiary education) are represented by trade unions through time (between 2002 and 2014) across four countries (Germany, the United Kingdom, Norway, and Spain). The paper ends with a short summary of the crucial findings and insights.
Setting the scene: measuring the strength through prevalence
The strength of trade unions, in the sense of the power an affiliated group can exert through trade unions in determination of social and economic dynamics, is not a simple thing to measure or observe. It is the outcome of parameters that are determined by the institutional structure (Checchi & Visser, Citation2005; Clegg, Citation1976; Kerr, Harbison, Dunlop, & Myers, Citation1960; Locke, Kochan, & Piore, Citation1995), economic circumstances (Freeman, Citation1990), political climate (Western, Citation1995), and the nature of production systems (Hyman, Citation1994, Citation2001; Streeck, Citation2016). But the expansiveness of trade union membership in general or within a given group is always an important element in this matrix of strength determination because exerting power is intimately related to legitimacy that, in the case of trade unions, emanates from their claim to be representative entities (Hyman, Citation2001; Koçer, Citation2007). Any interest representation organization with a very small membership would be on a precarious ground in terms of its legitimacy in the eyes of the larger society if it tries to influence policies that affect not only members but also non-members. Thus, prevalence of trade unions is an important element in their ability to affect societal affairs, and it is this aspect of strength that I would like to explore.
Obviously, the process through which individual employees affiliate with trade unions is of crucial significance for prevalence of unions in any democratic society (Visser, Citation2002, p. 406). Thus, before embarking upon the enterprise of developing analytical instruments for measuring trade unions’ prevalence, it is essential to shortly reflect on this underlying process of becoming a trade union member.
The decision about whether or not to affiliate with a trade union is not the outcome of a simple cost and benefit analysis. Although such calculations play a role because trade unions enable employees to act collectively so as to accomplish things that they individually cannot accomplish (Offe & Wiesenthal, Citation1980; Visser, Citation2002), trade unionism involves more than simple comparison of prospective gains and losses at the individual level for two reasons. Firstly, trade union membership unlike usual “rational-choice” schemes is not decided in a vacuum but within a social and institutional context that constrains and conditions individual choice rather strongly. The most obvious manifestation of this fact is that trade unions exist despite the great potential for free-riding, that is, often gains obtained by trade unions can be attained without active membership but nonetheless a remarkable number of people join the unions or retain their membership even during the periods of decline (Schnabel & Wagner, Citation2005, p. 4). Social custom, lack of choice, or selective incentives may explain this pattern. Usually in workplaces or even in industrial sectors, there is a social custom of union membership (Booth, Citation1985), and failure to conform to the custom may lead to loss of reputation as suggested by Akerlof (Citation1980). In fact, a new employee in a workplace with an established union would often (be made to) feel like a “parasite” (Visser, Citation2002, p. 406) for not sharing the burden while enjoying the benefits of having collective representation and would be compelled to affiliate with the union and pay the membership fee. The importance of this social pressure in union dynamics has been considered so important that there have been attempts to explain the union decline by appealing to the demise of social custom of membership (Visser, Citation2002). Affiliation with trade unions may also be de facto mandatory due to “closed-shop” type workplaces in which one of the conditions for being employed is trade union membership; this hints employer’s full recognition of the specific union at the workplace, and in turn, the lack of choice for new employees regarding affiliation. Selective incentives too may play a role. For instance, certain welfare benefits may be provided by trade unions as in the case of Ghent system that delegates the management of unemployment benefits to trade unions, which would create a strong incentive for membership (Scruggs, Citation2002, pp. 284–286). Thus, to reiterate the point, trade union membership, while in principle being an individual choice, is likely to be conditioned by social and institutional context.
Secondly, trade unions are not necessarily neutral/benign organizations that are blind to various forms of social differentiation. In its simplest form, trade union organizations often mirror the occupational lines, and thus, they de facto segregate workers in accordance with skill and/or educational backgrounds. More to the point perhaps is the fact that trade unions instead of offering universal membership to all those who need and demand collective representation may be quite selective in their inclusiveness reflecting segmentations based on gender, ethnicity, race, religion, or ideology (King, Citation1988; Koçer, Citation2007, pp. 5–6, Koçer & Hayter, Citation2011, pp. 14–16). Thus, affiliation with a trade union may not entirely depend on the decision of an individual worker. The worker’s social status (which often results from a combination of aspects that are based on ascription and achievement) would limit membership options that are practically “open” for the worker. In other words, membership process also involves the “decision” of trade union itself about whether or not a potential candidate belongs to the social strata from which union prefers to recruit its members. This shows once again that union membership is surrounded by complex and elusive societal dynamics.
What should be the methodological implications of these dynamics when it comes to measuring the prevalence of trade unions? Probably the best approach is to develop instruments that treat trade union membership as if it is the outcome of simple cost and benefit analyses made solely by individuals in a vacuum. Of course, the intention should be to use this “veil of ignorance” as an “ideal case” in Weberian sense so as to observe the extent to which reality deviates from the underlying assumption that union membership is based on individual rational choice that is divorced from any societal or institutional dimension. Thanks to this “veil of ignorance,” one would have two pictures of reality: the expected and observed pictures that would be identical only if the underlying assumption is correct. If it is not, then the instrument that is deliberately blinded to societal aspects of trade union membership would enable us to capture exactly the “social” nature of membership dynamics. For instance, proportion of all ethnicities in a country would be identical within entire population and among trade union members only if ethnicity does not factor into membership dynamics directly (due to trade unions’ “identity”) or indirectly (due to discriminations occurring in educational system and occupational recruitment practices). Of course, if we find, through our instrument operating behind “a veil of ignorance,” that the empirical picture deviates from this expected picture, then we would realize that ethnicity is a factor that affects the prevalence of trade unions because some ethnic groups would be more or less prevalent among union members than they are in the entire society.
Thus, against this background, in the following account, I develop a mathematical model that, while focusing only on the “prevalence” aspect of trade union strength, operates behind a veil of ignorance about all the complex societal and institutional dynamics surrounding the trade union membership. The goal of course, to reiterate the point, is exactly to capture these dynamics through the application of the model.
Examining the existing instrument: trade union density
Trade unions’ “strength” in the sense of prevalence is usually measured by a simple ratio known as “union density,” which is the proportion of union members to the relevant population (Visser, Citation1991). This indicator is obtained by dividing the number of trade union members by the number of people who are considered as potential candidates for union membership. The resulting figure informs us as to the extent to which union membership is prevalent in a given society. The usual summary index is national- or industry-level trade union density (Visser, Citation1991), but it is not uncommon to scrutinize densities within specific social groups such as youth or women (Gumbrell-McCormick & Hyman, Citation2013, p. 54)
Although union density may appear as an uncontroversial instrument, there is a considerable debate about how it is to be calculated. The first challenge of course is to determine which organizations should be considered as trade unions (ILO, Citation1997; OECD, Citation1991). Once this is settled, the discussion revolves around the components of the ratio: the exact contents of the nominator and denominator. Two questions seem to be important: who actually counts as an “active” member of trade unions and who should be considered a “potential” member (EIRO, Citation2009). As to the nominator, whether or not retired and/or unemployed union members should be included into or excluded from the total number of membership appears to be central issues. As to the denominator, besides the same concerns about the status of unemployed and retired people comes the debate about whether country-specific legal restrictions concerning the eligibility of people for membership should be taken into consideration in the calculation of the total number of potential members (see OECD, Citation1991, p. 98, Ishikawa & Lawrence, Citation2005, p. 4, Hayter & Stoevska, Citation2010; Ebbinghaus & Visser, Citation2000; Visser, Citation2016)
I argue that “trade union density,” regardless of how its constituting elements are defined, is not a suitable indicator to compare the intricacies and implications of trade union prevalence within and across societies that go through transformations that change patterns of social stratification and the relative sizes of various segments. This is because “density” fails to inform us about three crucial issues: (1) whether any given group is properly represented within trade unions compared to its size in society, (2) whether trade unions are sufficiently expanded within any given group compared to their expansion in entire society, and (3) whether, for any given group, “insiders” (those who belong to trade unions and the group simultaneously) are likely to use the union power in order to advance their own narrow interest rather than those of the entire group.
My goal in this study is to develop a mathematical model in order to help us to capture and compare all these dynamics at once. The basic premise is that “unions aggregate policy preferences of their members by some mechanism that resembles majority rule” (Becher & Pontusson, Citation2011, p. 183). However, before building this model, it would be useful to take a look at the hypothetical situation depicted in that would help us realize why these three dynamics are important. In this figure, on the left panel, there are two sets: one of them is a social group, and the other one is trade union members. In their intersection, there are m people who belong to the group and are affiliated with the union. Let’s assume that this m people always belong to the group and never leave the trade union. Two change sequences are depicted on the right side. In the upper panel, the trade union set remains intact while the group shrinks so that in the end only those people affiliated with trade union remain as group members. In this scenario of “resilience of a group within the trade union,” union density for the group would increase and, in the end, reach 100%. In the lower panel, we see the opposite sequence that may be called “resilience of the trade union within a group.” Here, while the group size is constant, trade union membership declines so that, at the end, only people that remain as union members are those who belong to the group. In this case, trade union density for the group does not change through the entire sequence. The meaning and implication of trade union membership would be quite different in these two scenarios.
Figure 1. Resilience of a group within trade unions and resilience of trade unions within a group.
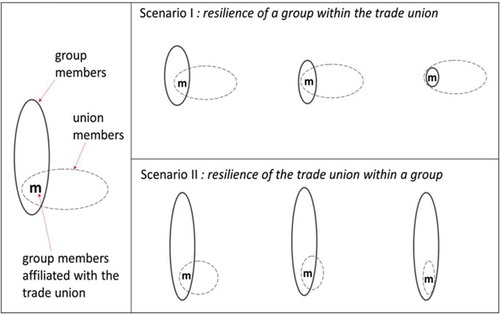
In scenario I, the relative size of the group within the trade union compared to its relative size in society constantly increases. This means that, for this group, trying to use the trade union in order to shape policies would be easier than doing the same by trying to influence the entire society, if we assume of course that the relative size of a subgroup within a larger group or society is crucial for advancing its interests. Moreover, again in scenario I for the trade union members who belong to the group (“insiders”), it would probably be increasingly easy to articulate, within the trade union, the interests of the entire group because those who are not affiliated with the union gradually disappear making those group members who are also union members first the majority and then they become the group itself. But neither the fact that the group is better represented within trade union than in entire society nor the relative easiness in determination of group interests to be articulated within the trade union means that the group interests would actually be taken seriously within the trade union. This is because the majority of union members does not belong to the group.
This shows that the relative size of the group within the trade union may be larger than its relative size in society, but this would not necessarily enable the group to actually use the trade union power because the relative size of the trade union within the group is also crucial. This is what scenario II reveals clearly. Here, trade union members who do not belong to the group gradually disappear, and in the end only those members who belong to the group remain in the trade union. This would, unlike in Scenario I, facilitate trade union power to be used to advance the interests articulated by the group members affiliated with the union. Because those people who belong to the group and the trade union at the same time first become the majority in the union and then they become the only union members, leaving “no need” for paying attention to union members from other groups. However, given that in scenario II union members within the given group (“insiders”) constitutes a minority in the entire group, one may not be sure which interests (those of the entire group or those of the trade union members) would be advanced through the use of union power.
Thus, these two scenarios reveal as ideal-types three distinct dimensions of “strength” that may be acquired by social groups through trade unions. Firstly, “Resilience of a group within the trade union” depicted in scenario I reveals that any given group may be “stronger” or “better represented” within trade unions than it is in the whole society: thus, the relative size of a group within the trade union is important. This may be called (relative) “power” dimension. “Resilience of the trade union within a group,” shown in scenario II, on the other hand, reveals that the actual use of trade union capacities to advance group interests is closely related to the relative size of the trade union within the group. If the relative size of trade unions in the group is larger than the relative size of trade unions in entire society, then trade unions may represent the group better. This may be called (relative) “representation” dimension. Finally, the very definition of interests to be advanced/represented by trade unions may be itself an issue. The size of insider group (those who belong to the union and the group at the same time) relative to the entire group and relative to the entire trade union membership appear crucial here: As in scenario I, if group is contained by the trade union, defining the group interests to be promoted within the trade union would be easier, but their “realization” through the use of union power may be difficult. As in scenario II, if the trade union is contained by group, the exact opposite is true: while defining group interests may be not easy, but the use of union power for their advancement would not be very difficult.
In short, reveals that in order to evaluate the way in which any given group benefits from trade unions, one needs to examine three issues in relation to this group: its relative power, its relative representation, and relative size of its insiders. However, the only instrument that we have, trade union density, in itself, is not capable of informing us about these dynamics. Against this background, my goal in this study is to develop some mathematical tools that would enable us to capture and compare these three dynamics simultaneously by using the two dimensions that I outlined: relative power and relative representation.
Analytical framework
Assume that in a society there is a single trade union that is capable of influencing economic and political developments. The affiliation is voluntary. Any individual from a particular group (for instance workers with secondary education, or women in a specific sweatshop) may choose to affiliate with the union, and some individuals belonging to this group may not do so. However, group members within the trade union may still try to advance the group’s interests in its entirety. But they may also use their position to advance their own narrow interests. To visualize the basic facts about such a setting, one may use the set theoretical view given in . Here, there is a group depicted by set A, the entire society is universal set W, and trade union members are all in set U (see also ).
Table 1. Symbols and annotations used in the text.
Intersection between A and U contains z elements. These are individuals who simultaneously belong to A and U. Or more informally, z people reside in the set of union members within A. In this picture, we need to identify the cardinality of three more subsets. The number of people who belong to A but not affiliated with the trade union is denoted by x, and there are y union members who do not belong to A. Finally, the number of individuals who are neither union members nor belong to A are depicted with r. In more formal terms, we can express all these subpopulations and their relationships to sets A, U, and W as follows.
In all figures, examples, and proofs in the remainder of this paper, I will use the terminology and annotations introduced in and outlined above. Therefore, for the sake of convenience, I summarize them in . The reader may need to consult this table in the following pages.
Now, in order to capture representation dynamics, let’s make three assumptions.
Firstly, assume that interest is linked to group membership. This means that all members of a given group have at least one common interest, but as soon as a new group is defined within this group, then the members of this new (sub)group too will have a new interest that is common to all subgroup members. This new interest may approximate or deviate from the larger group interest. If this subgrouping operation is taken to its limit, then every individual may have a potentially unique individual interest that can possibly be different from interests of all groups to which s/he belongs.
Secondly, assume that all sub-groups in a given society can affect political and economic decisions in proportion to their relative size. Therefore, the power of group A on the affairs of W may be quantified as
This also implies that the power of trade union members z belonging to A to affect trade union dynamics equals to
Finally, let’s assume that a particular subgroup may represent the entire group in any organization only in proportion to its relative size in the group. For example, the ability/willingness of trade union members to represent within trade union the interests of a group that they belong is proportional to their relative size within this group. Thus, one may argue that the ability/willingness of union members within A to represent entire A within the trade union would be
Similarly, the ability/willingness of the entire trade union membership to represent the whole society within the trade union would equal to
One may note that (8) actually equals to the usual national trade union density and (7) has the same logic and may be defined as the within-group trade union density.
Power and representation
Now, for A, the power to influence societal affairs would be as in (5), but the same group may also affect trade union decisions that in turn will be influential in determining societal affairs. This “within union” power of A can be quantified as in (6). Then the difference between Equations (6) and (5) would be crucial in determining to what extent trade union representation endows this group with more power than it can enjoy if power were to be measured by the relative group size. This notion may be clarified by imagining that there is a perfectly representative parliament in which all groups have power to influence policy decisions in proportion to their relative size in the population, but any such group, instead of using this within-parliament power, may also opt for using their power within trade union in order to attain the same goals if the latter offers more strength. Then the difference between the power of group A within the entire society and its power within the trade union would inform us whether or not this group has a privileged position in the trade union compared to its position in society. Let’s call this “power component” and define it formally as follows.
In plain language, P informs us whether the relative size of A within the trade union exceeds the relative size of A in the entire society. P shows the extent to which the power of A to influence societal affairs through the trade union differs from the power that emanates from its relative size in society. Thus, if P is positive, this implies that A in its entirety enjoys a privileged position due to its trade union affiliation because this endows the group with more power than they would have had there been a perfectly proportional representation mechanism for all groups.
However, it is also important to note that the trade union’s ability/willingness to represent the whole society as it tries to influence the critical dynamics equals to (8), and as it does this, its ability/willingness to reflect the interests of A would be given by (7). Now, the difference between these two equations would show the extent to which A is better off as a group as its interests are articulated by the trade union compared to the way in which the trade union represents the whole society. Let’s call this “representation component” and define it formally as follows.
Once again, in plain language, R informs us whether the relative size of the trade union within A exceeds the relative size of the trade union in the entire society. If R is positive, people of A may think that the trade union would represent their particular interests better than the way in which it represents the whole society. In more technical terms, this means that union density within A is higher than the union density in the whole society. This once again implies that A enjoys a privileged position in the trade union because the trade union would be more inclined to articulate the interests of A within the trade union if the measure of representation is the relative density of union members in the whole society. Admittedly, the representation component is just an elaborate version of the conventional trade union density indicator: it equals to the difference between the within-group and national union densities. What is novel, however, is the idea of using it together with the power component defined in (9).
Here, it is important to recognize the difference between privileges implied by positive P and R scores. The positive power component (P in Equation 9) assures people of A that, for them, the trade union offers more power in the determination of societal issues than even a perfectly proportional representation mechanism because they populate the trade union more than they populate the whole society. On the other hand, the positive representation component (R in Equation 10) implies that the trade union would advance the interests of A more than it would promote the interests of the whole society because the density of the trade union in A is higher than its density in the whole society. In other words, trade union populates A more than it populates the entire society. So essentially P shows the relative power of the trade union for A, while R reveals whether the trade union would provide relatively better service for A as it exercises this power.
From these two logics, it should be clear that a group would not be truly privileged in the trade union unless both P and R are positive. Being privileged in this sense implies that the group enjoys two advantages simultaneously: its relative size within the trade union is higher than its relative size in society, and the relative size of trade union within group is larger than the relative size of the trade union in the entire society. Because, when this basic condition is not satisfied, then people of A might find themselves in a situation (of negative P and positive R) in which a weak union (from their perspective) may try to advance A’s interests, or they may face a situation (of positive P and negative R) in which there is a strong union that is likely to neglect A’s interests at least in relative terms. Thus, people of A should be considered privileged in the trade union only if both P and R are positive. Actually, this is not a very demanding condition because P and R must always take the same sign; they will be simultaneously positive or negative. Let’s show this formally.
Theorem 1: P and R must always have the same sign.
Proof: Let’s define
Now with little algebra, one can express P and R as follows
then substituting this into the first expression in Equation (12) gives us
Given that multiplicative term in Equation (15) can never be negative, one can argue that P and R will always have the same sign, and q.e.d.
Privileged position and insider temptation
Now we should inquire as to the meanings of positive and negative (P,R) pairs. If this pair is negative, then people of A would be under-privileged within the trade union. Thus, had there been a perfectly proportional representation mechanism (for instance in the form of a parliament in which all groups were represented in proportion to their relative size in society), it would be better for people of A to articulate their demands in the parliament because not only in parliament would they have more power than they would have within the trade union but the representative capacity of the trade union for A would also be lower compared to its overall representation capacity. But under such circumstances what would the members of A who are affiliated with trade union do? They may become self-serving, and use the trade union for their own narrow interests, or, they may still try to use their presence within the trade union in favor of the entire A, at least occasionally. This may result from solidarity or from coincidence of interests between union members within A and the rest of this group.
What about the implications of positive (P,R) pair? In this case, the power of A within the trade union would be greater than their power in the entire society, and similarly, A would also enjoy a higher representation capacity within the trade union. This means that people of A would be privileged in the trade union. Thus, if they were to choose either the trade union or a perfectly representative parliament to advance their interest, they would opt for trade union representation. Under these conditions, one may expect union members within A to act on behalf of the entire group given that trade union would be the sole channel of representation for A, and thus, people of A would be keen on monitoring the attitude of union members within the group. For the sake of adding a flavor of realism into our model, we should acknowledge however that this would not entirely preclude self-serving attitudes among union members belonging to this group.
Of course, we must identify under which conditions union members of A may opt for acting on behalf of the entire A and when they would prefer to advance their own subgroup interests. To clarify these conditions, we must scrutinize the implications of the relative magnitudes of P and R. Let’s explore two possible contingencies through examples.
Example 1: Let’s assume that in a society of 1000 people there are only two trade union members, one of whom belongs to A that contains 200 people in total. This implies (in terms of the terminology introduced in and ) that
Under these circumstances, one can estimate that
Obviously, here the power component is 100 times larger than the representation component. Reflecting on the relative magnitude of z, and cardinalities of A and U, one may easily argue that under these circumstances, the single member of A in U, that is, z may be tempted to use P in order to advance his/her own interest rather than thinking of 199 other people in A. It would be very easy to agree with the other union member y to make use of their collective power for their own narrow interests compared to the difficult task of representing 199 people of A within this very small union environment. Such an attitude may be called “insider temptation.” This example allows us to articulate the following corollary.
Corollary 1: The inclination toward “insider temptation” that appears among union members when P is very large compared to R would always be present though in more subtle forms whenever P exceeds R even with a small margin.
Example 2: Let’s again imagine a society of 1000 people where there is a very small A consisting of only two people and relatively large union membership of 200 people. This picture would generate the following configuration (again in terms of the terminology introduced in and )
And the corresponding P and R scores would be
It is clear that now P is much smaller than R, but it is important to realize that even now, given that the pair is still positive, people of A are still privileged within the trade union. However, now “within union,” the power of A is quite limited; 1/200 (though, still greater than the power of 1/500 that they would have in a perfectly proportional representation mechanism that encompasses the whole society), but the sole union member of A, that is z, is more likely to represent the interest of A as a whole within the trade union because this amounts to agreement between just two people, and even without it, the likelihood of desiring the same things with this other A person would be higher compared to a situation in which A is populated by a larger group. So under these circumstances, one might expect the trade union member within A to use his/her power within the trade union to advance the interests of the whole A. From this observation, one can derive the following corollary.
Corollary 2: The tendency of solidarity resulting from huge difference between R and P should be present in more subtle forms whenever P is smaller than R. The magnitude of this tendency may be associated with the difference between R and P.
These considerations make it clear that the (common) sign of (P,R) pair and whether P is larger or smaller than R are two crucial attributes. The sign of the pair informs us about whether the given group is privileged in the trade union and the magnitude of the difference between P and R hints about the nature of union members’ attitude (whether or not to they would be inclined to use the union power for their narrow interests). However, although theorem 1 informs us that P and R must have the same sign, it does not reveal the conditions that would lead to positive and negative results, and it also does not exactly specify the conditions that would make P larger or smaller than R. The following theorems clarify these issues.
Theorem 2: The absolute value of P exceeds that of R if and only if x is larger than y. In other words, the power component of a given group will exceed its representation capacity, if the number of those people who belong to this group while not having trade union membership exceeds the number of trade union members who do not belong to this group. The opposite statement is also true.
Proof: assume that |P| > |R|
The joint implication of corollary 1 and theorem 2 is worthwhile reiterating: if the number of people belonging to A who are not union members is greater than the union members who are not member of A, then the members of A affiliated with the trade union would be more inclined to advance their own narrow interests by using their power in the union. This is because it is easier to come to an agreement within a small group than doing the same within a large group. Therefore, z people that belong to both the trade union and A simultaneously would compare the magnitude of x with that of y. If the former is greater than the latter, they would be more inclined to agree with the smaller group. Consequently, they would use their within-union power for their own peculiar interests that might be more in line with those of the other union members than those of non-union members of A. This is the logic of “insider temptation.” The following “attitude indicator,” which is scrutinized in example 1, and can be easily derived from theorem 2, outlines under which conditions this temptation might emerge
At this point, it is important to scrutinize whether the presence of insider temptation is in some way linked to the common sign of (P,R) pair. Of course, this is tantamount to asking whether insider temptation is related to whether or not a group enjoys a privileged position in the trade union. To answer this question, we first need to figure out what determines the sign of (P,R) pair.
Theorem 3: There is a boundary that must be exceeded by z for P and R to be positive. This boundary and the way in which it changes is entirely determined by the number of people outside A∩U, that is, this boundary is independent from the number of union members in A.
Proof: Equation (15) implies that P and R must have the same sign. They will either be both negative or both positive. Now in (12), which links P and R to each other, the only component that can take a negative sign is Ω. Therefore, the conditions that determine the (identical) sign of the power and representation components can be derived from this equation. Let’s scrutinize the conditions that would make this expression positive.
Thus, one may define the boundary condition for z that would make both P and R equal to zero as
If trade union representation is privileged for A, then z must exceed this “boundary,” which thus may be called “privilege condition.” The way in which this boundary will change in response to unit increases in its components can be found by taking relevant derivatives as follows.
One can see that all elements in Equation (28) and all derivatives in expression (29) are determined by sets outside the intersection of A and U and q.e.d.
Equation (28) gives us the condition that would give a group a privileged position in trade union, and Equation (25) informs us about the condition that would make trade union members more inclined to be self-serving. Now we are capable of scrutinizing whether or not these two conditions affect each other.
Theorem 4: Insider temptation may occur regardless of the common sign of (P,R) pair; therefore, whether or not a group is privileged within the trade union is not related to the presence or absence of insider temptation. And the opposite is also true: A group may be privileged within the trade union regardless of whether or not there is insider temptation among union members belonging to this group.
Proof: First, let’s show that changing the condition of insider temptation would not necessarily affect the privilege condition. Let’s assume that for a specific configuration x = x1, y = y1, r = r1 insider temptation is present. Thus, we can write
Under these conditions, the boundary that needs to be exceeded by z to make trade union representation privileged would be
Now, let’s create another configuration by switching the cardinalities of the non-union members of set A and the non-A members of U by assuming that x2 = y1, y2 = x1, and r2 = r1 . Now, due to (25) and the assumption in (30), insider temptation would not be present because
However, if we look at the new “privilege condition” now, we see that
This means that even if the condition for insider temptation is completely reversed, this does not affect the privileged position of the group within the trade union. This completes the first part of the proof. Now let’s show that changing “privileged condition” would not necessarily affect the presence or absence of insider temptation. Let’s assume that the condition in (30) is due to the fact that
Now, if non-union members of A start joining the union one by one (see ) the following successive configurations would emerge:
The “privilege condition” given in (28) for each of these configurations would be different: As we move from x2 to xk, the corresponding privilege conditions would decline. However, as this happens, the insider temptation would be constantly present until and including x(k-2) because as long as x values are larger than y values, the condition in (25) would be satisfied. Thus, despite the changing “privilege condition,” the insider temptation would remain constant and q.e.d.
Derivatives in (29) inform us about the pace of this decrease. They show the unit change in the privilege condition imposed by a unit change in x, y, and r, respectively. The first two equations clearly indicate that as long as r is very large, then increasing the number of non-union members of A or non-A members of U would have a rather small effect on the privilege condition. In other words, as long as r remains the same, attaining a privileged position in the trade union for any group would not change radically regardless of recruitments from A into A ∩ U or movements from U into A ∩ U However, the interesting thing is the unit change imposed on the boundary by a unit change in r. As depicted by the third equation in (29), this effect is non-linear, and its sign is the opposite of the direction of change in r. This opposite sign confirms once again that as the number of people outside A and U increases, then to attain a privileged position within the union would be easier for people A (boundary will decline). And the non-linear structure informs us that this happens rather rapidly at the beginning. The implication is an interesting corollary.
Corollary 3: Those groups with shrinking size would quickly obtain a privileged position within unions during the process of trade union decline. This is because gradually declining x and y values and increasing r would collectively generate smaller values for the boundary condition given in (28), and due to the non-linear structure of the third expression in (29), this would happen rather quickly.
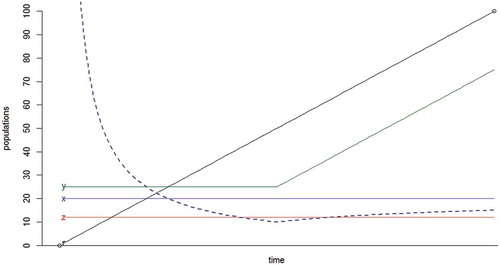
Here it is useful to reflect on an interesting possibility: As r increases, A would approach attaining a privileged position within trade union, but this may motivate more people from other groups to join trade unions (thus inflating y). The result would be an upward push in the privilege condition that in turn makes it difficult to attain a privileged position for the people of A. This is depicted by a simulation presented in . Here, a dynamic picture of population changes that occur in sets given in is drawn. The dashed line is β and the lines representing x, y, z, and r are all marked with respective letters (see as well). The movement of β is estimated from (28) in response to changes in other populations. The fast pace of decrease in the privilege condition (thus rapid approach of privileged position) is clearly visible. Soon after z exceeds β, people from other groups start joining the union, and this triggers an increase in privilege condition with the result that z once again goes below β . Thus, one may argue that imposing stringent conditions for union membership so as to keep trade unions. exclusive would be rational for those groups that benefit from union representation that, due to corollary 3, are likely to be those whose size rapidly shrinks.
Figure 2. Set theoretical view of trade union representation. See also
A: a set containing people belonging to a specific group; U: the set of all trade union members; W: the universal set containing the whole society; x: number of people belonging A but not affiliated with the trade union (see equation 2); y: number of trade union members who do not belong to A (see equation 3); z: number of trade union members who are belonging to A (see equation 1); r: number of people who neither belong to A nor affiliated with the trade union.
Figure 3. Changes in attractiveness of trade union representation — dotted line — as response to population changes: logic of exclusiveness. See also .
x: number of people belonging to a group A but not affiliated with the trade union (see equation 2); y: number of trade union members who do not belong to A (see equation 3); z: number of trade union members who are belonging to A (see equation 1); r: number of people who neither belong to A nor affiliated with the trade union.
Model
All the insights provided by the preceding theorems and corollaries may be succinctly expressed by a visual model as depicted in . This is a two-dimensional space generated by horizontal axis of P (power component given in Equation 9) and vertical axis of R (representation component given in Equation 10) . Due to theorem 1, P and R always take the same sign. Therefore, in the visualization space, there are only same-sign sections of the usual two-dimensional coordinate system. Any group in society will appear in this space as a single point in accordance with its P and R scores.
Figure 4. Visualization space.
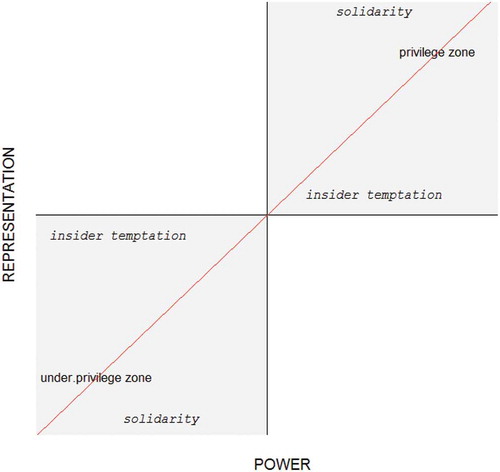
The Southwest region has a negative and Northeast region has a positive sign for the (P, R) pair. Thus, if for a given group the corresponding (P,R) pair appears in the Southwest region, this implies that this group, compared to its relative size in society, is both under represented and has relatively low power within the trade unions. Hence, the Southwest region is called “under privilege zone.” On the other hand, if for a given group the (P,R) pair appears in the Northeast region, then the group, again compared to its relative size in society, is over-represented and has relatively high power within the trade unions. Therefore, the Northeast region is called “privilege zone.”
Corollaries 1 and 2 together with theorem 2 inform us that the difference between the absolute magnitudes of P and R indicates whether one should expect union members in any given group to be inclined to act together with the other trade union members or with the rest of the group that they belong to. Accordingly, there is a 45-degree line crossing the entire representation space. If a group appears above this line in the Southwest region or below this line in the Northeast region, this implies that the absolute value of P is larger than R and thus one may expect the trade union members within the group to be inclined toward agreeing with the remaining trade union members instead of agreeing with the non-union members of the group to which they belong. This is likely to generate insider temptation. Thus, both above 45-degree line in the Southwest and below 45-degree line in the Northeast regions are marked with “insider temptation.” However, if a group emerges below 45-degree line in the Southwest and above this line in the Northeast regions, then we expect trade union members within this group to agree more with the rest of their group than with the remaining trade union members. This is likely to generate a solidaristic attitude. Thus, both below 45-degree line in the Southwest and above 45-degree line in the Northeast regions are marked with “solidarity.” The larger the vertical distance between a point and the 45-degree line, the more pronounced should be these tendencies of solidarity or insider temptation. Thus, in accordance with whether a group appears in Southwest or Northeast one may assess whether this group is privileged within the trade unions and, in accordance with whether a group appears above 45-degree line in the Southwest and below 45-degree line in the Northeast regions, one can guess that union members within the group would have insider temptation.
It is important to reflect on the features of two equilibrium places in the representation space: the origin and the 45-degree line.
The origin corresponds to the situation in which, for a given group, the trade union structure is the exact replica of the status of this group in the entire society so that there is no privilege or under privilege for the group within the unions. The magnitudes of representation and power that the group that emerges at the origin enjoys within the trade unions equals exactly the relative representation and power that this group would enjoy had there been a perfectly proportional representation mechanism in the society. Technically this means that z equals to the privilege condition xy/r (see 28).
The 45-degree line represents the situation in which the number of people who belong to a given group without having union affiliation equals to the number of union members who do not belong to the given group. Under such circumstances, we have an ambiguous situation as to the expected behavior of the union members belonging to the group; there is no insider temptation nor is there a solidaristic attitude. Technically, this refers to the situation that the condition x/y (see 25) equals to 1.
Now, in order to examine this model in detail, we first use a hypothetical example and then scrutinize real-world data.
Example 3: There is group A with 25 members in a society of 100 people. Although there are 10 trade union members in this society, none of them belongs to A. This implies the following configuration (in terms of the terminology introduced in and )
shows power and representation dynamics that would emerge if all members of A join the trade union one by one so as to lead to the following configuration in the end.
Figure 5. Gradual recruitment of trade union members from a single group. See also .
x: number of people belonging to a group A but not affiliated with the trade union (see equation 2); y: number of trade union members who do not belong to A (see equation 3); z: number of trade union members who are belonging to A (see equation 1); r: number of people who neither belong to A nor affiliated with the trade union.
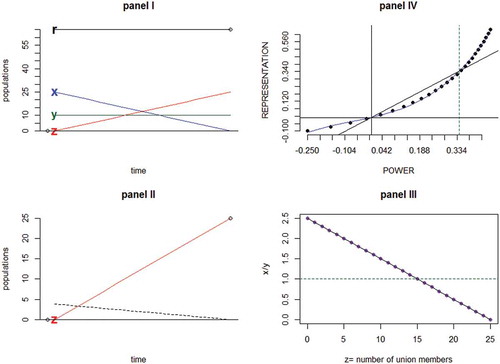
Let’s examine the four panels given in . Panel I shows the changes in the entire system: while y and r remain constant, people belong to A – (A∩U) (i.e., those people in A without union membership) gradually move into A∩U (and thus they become union members while belonging to A) leading to declining x and increasing z scores. The boundary condition (28) defined in theorem 3 that needs to be exceeded by z in order to create a privileged position within the trade union is depicted in panel II by a dashed line. In accordance with the derivatives given in (29), a unit decline in x leads to a decline in the privilege condition equaling to y/r. Panel III reveals the corresponding movement that occurs in the attitude indicator x/y defined in (25), that is, the proportion of non-union members of A to the union members that do not belong to A.
All these dynamics are neatly summarized in panel IV that shows joint movement of P and R scores in the form of a dotted PR-line. The initial points appear in the Southwest region hinting that in these points, the entire group is underprivileged in the trade union, and these points are all above the 45-degree line showing that the members within A are inclined to use their power to advance their own interests because x is larger than y (as depicted in panel I). As soon as z exceeds the boundary given in (28) as depicted in panel II, the PR line moves into Northeast region rendering the group privileged within the trade union. But initially the insider temptation (defined as the difference between P and R scores) increases as the PR line advances into this region because, as given in theorem 2, x remains larger than y and this, for those union members belonging to A, makes agreeing with the non-A members of the union easier than agreeing with the non-union members of A. But once inside the Northeast region as x drops to a value lower than y, then R exceeds P and the PR line moves above the 45-degree line and thus generates solidarity which keeps on increasing. This point is marked by a dashed vertical line. This change from insider temptation into solidary can be traced also in Panel III that depicts the way in which the attitude indicator x/y changes in response to decreasing x values. As mentioned in (25), as long as this proportion is larger than 1, one would expect insider temptation among union members of A prioritizing their narrow interests rather than those of the entire A. This attitude would change into solidarity with people of A who are not union members as soon as the proportion decreases below 1. This dynamic can be viewed by comparing panel III and panel IV, the point at which the PR line in the latter exceeds the 45 degree line corresponds to the point in the former where the proportion line goes below 1.
Application: education-based stratification and trade unions
Do trade unions provide a privileged position to those social groups that are structurally disadvantaged in the labor market? In this section, by scrutinizing this question, I illustrate how the instruments developed above may be empirically applied. I focus on the stratification generated by the education level. However, the analysis given below is meant to be illustrative rather than exhaustive, and thus I often opt for parsimonious rather than in-depth inquiries.
In any advanced capitalist country, the level of education would have a crucial influence on the labor market position of individuals (Barone & Van de Werfhorst, Citation2011). This impact is most visible in the relative income of individuals: ceteris paribus low education implies lower income, while higher education generates higher income (Koçer & Van de Werfhorst, Citation2012). But education also has a substantial effect on perceptions. It generates legitimacy for patterns of inequality on the basis of seemingly objective criteria and, in this way, makes it easier for people to consider their status in the labor market as fair (Meyer, Citation1977). Consequently, education not only affects the income level positively but it also affects people’s expectations. Thus, education level is quite a crucial factor of stratification. Against this background, one may argue that if trade unions provide a privileged position for low educated people, this may render this particular group capable of seeking some redress to compensate at least for their material disadvantages. However, if those people with higher education levels enjoy a privileged position, this would imply that trade unions actually enhance the existing pattern of stratification rather than rectifying it.
Against this background, I examine the relationship between education level and trade union membership in Germany, Norway, the United Kingdom, and Spain by using European Social Survey (ESS) and focusing only on people between 15 and 64 who are actively working as employees. For these countries, ESS provides information about respectively 12848, 9778, 8415 and 6523 individuals at 7 time points: 2002, 2004, 2006, 2008, 2010, 2012, and 2014 (details are given in the Appendices 2 and 3).
These countries represent four different political economy regimes (Germany: Continental/Conservative, Norway: Scandinavian/Nordic, UK: Liberal, Spain: Mediterranean) in each of which trade unions have a different degree of institutional power; probably in (temporally and spatially) relative terms, their power would be highest in the Nordic, lowest in the Mediterranean, and somewhere in between in the Continental and the Liberal regimes (see Esping-Andresen, 1990, Arts & Gelissen Citation2002; Hall & Soskice, Citation2001). Thus, a weak group that enjoys a privileged position within trade unions in any one of these regimes does not necessarily acquire additional power if the trade unions lack the capacity to influence the dynamics of the political economy. However, one might still consider having a privileged position within trade unions as, if not sufficient, at least a necessary condition for acquiring power through trade unions.
The labor market implications of different education levels would also vary across these regimes (Van de Werfhorst, Citation2011). However, I argue that the “low” and “high” education would generate similar lists of advantages and disadvantages in labor markets across these countries, if these definitions can be sufficiently generalized without losing their contextual meaning. It should be noted however that the most regime-specific education type, in the sense of labor market (dis)advantages, would probably be “secondary” education encompassing various forms of vocational/non-tertiary education levels. In some countries such as Germany and the Netherlands, having vocational/non-tertiary education may generate positive labor market outcomes in terms of employability and income at least under not very unfavorable economic conditions, while in others like the United Kingdom, the outcome under the same circumstances may be less accommodating (Breen, Citation2005; Müller & Gangl, Citation2003; Shavit & Muller, Citation1998). Thus, one should be cautious in attributing a generic labor market position to the secondary education. Having these points in mind, I use the model in order to examine the way in which trade union representation varies across education levels in these four countries so as to identify privileged groups.
In European Social Survey, educational level is recorded in two different ways: firstly, it is recorded in its native form that shows respondents’ country-specific educational qualifications, and secondly, the International Standard Classification Of Education (ISCED) equivalent of these codes in terms of five categories: “ISCED 0 and 1: Less than lower secondary education,” “ISCED 2: Lower secondary education completed,” “ ISCED 3: Upper secondary education completed,” “ISCED 4: Post-secondary non-tertiary education completed,” “ISCED 5 and 6: Tertiary education completed.” Analyzing the position of all these ISCED categories separately within the trade unions by referring to country-specific educational circumstances might be interesting. However, given that my goal is to illustrate the way in which the instruments developed above are to be used in practice, I opt for a more parsimonious inquiry and derive the following broader educational groups from ISCED categories: Low education (ISCED 0, 1, and 2), secondary education (ISCED 3 and 4), and tertiary education (ISCED 5 and 6). It is important to note that this categorization retains the links between educational situations and labor market circumstances of individualsFootnote1 by merging education levels that are quite similar in terms of their labor market implications as illustrated in detail by Baccaro et al. (Citation2016, pp. 830–834). Therefore, this categorization would, despite its parsimonious nature, help us to identify substantively interesting patterns across countries. ESS data allow us to identify trade union members in each category, and this enables us to obtain the basic ingredients of the model (see Appendices 2 and 3).
Let’s start the analysis with . Here, I depict the demographic changes relevant for low, secondary, and tertiary education groups in terms of the basic ingredients of the model in each of four countries separately. In each graph (in accordance with the terminology outlined in ) the following abbreviations are used: z: group size of union members belonging to the designated education level as the percentage of the examined sample, x: group size of people with the same education level but with no union membership as the percentage of the examined sample, y: group size of union members with a different educational level as the percentage of the examined sample, r: group size of people who are neither union members nor belonging to the designated education level as the percentage of the examined sample.
Figure 6. Four basic indicators of the model. See also .
x: number of people belonging to the designated educational group but not affiliated with trade unions (see equation 2); y: number of trade union members who do not belong to the designated educational group (see equation 3); z: number of trade union members who are belonging to the designated educational group (see equation 1); r: number of people who neither belong to the designated educational group nor affiliated with trade unions.
is essentially produced in order to reveal the difficulty of grasping and comparing all trends that are relevant for trade union representation. Here, one can see that the relative position of all four indicators remain stable in Germany and Spain, but there are remarkable changes in the United Kingdom and Norway. In all countries, the low education group has the smallest percentage of union members (z) compared to the union members from all other education groups (y), and similarly union members within the low education group also constitute a minority within this group (compare x with z) but, in its entirety (x + z), this group has a remarkable relative size in the United Kingdom and Spain, though in the former we observe a rapid decline. The position of union members belonging to the secondary education group changes notably across countries and through time. In Germany, they constitute through the whole period, the majority of union members (compare z with y), but in Norway, although they start with the same position, they lose this within-union majority rapidly. On the other hand, they are (z) the minority in trade unions both in the United Kingdom and Spain compared to other groups (y), but in the latter their relative size within unions increases after 2008. Finally, the tertiary education group occupies, compared to other groups, a large minority position within trade unions in all countries (compare z and y) and, except for Norway, everywhere that trade union members constitute a minority within the tertiary education group itself (compare z and x).
Now, what are the implications of these trends for education groups in terms of their position within trade unions? Which ones are privileged? And what should we expect from different education groups in terms of whether or not union members among them would be inclined to ignore the interests of the entire group that they belong to?
enables us to spot educational groups that enjoy a privileged position within trade unions immediately. Being privileged implies that the group enjoys two advantages simultaneously: its relative size within trade unions is higher than its relative size in society and the relative size of trade unions within the group is larger than the relative size of trade unions in the entire society. Theorem 3 above provides us with a simple instrument to detect privileged groups: the boundary given in (28), which equals to xy/r. If the size of union members within the group exceeds this boundary, then this implies that the group has a privileged position within trade unions.
Figure 7. Privilege condition (β) and union membership (z). See also , and Equations 1 and 28.
In , the privilege boundary xy/r for each education group is depicted with a dashed line (β) and the percentage of group members with union affiliation is superimposed on the graph with a black line (z). If the group line z is above the dashed boundary line β, then the educational group has a privileged position within trade unions, and if not, it has an underprivileged position. One can see that in all countries the low education group has an underprivileged position within trade unions through the entire period, while the tertiary education group enjoys privileged position everywhere and all the time. The situation of secondary education group is more interesting though. Except for Norway where this group remains underprivileged through the entire period, its privilege status changes in all other countries from being underprivileged to privileged. In other words, in Germany, the United Kingdom, and Spain, the secondary education group exceeds the privilege boundary. In Germany, this occurs only once (in 2004), and the group remains privileged afterward. But in the United Kingdom and Spain, the secondary education group goes above and below the boundary several times, but at the end of the period, it occupies a privileged position within trade unions in both countries.
As shown in theorem 4 above, whether or not union members in a given group may be inclined to ignore the interests of the entire group for the sake of their own narrow interests as they use their position within trade unions is a condition (“insider temptation”) that occurs independently from whether or not the group enjoys a privileged position within trade unions. Once again the model enables us to detect the presence of such a condition immediately by providing a proportion (“attitude indicator”) that is given in (25) and equals to α = x/y. If, for a given group this proportion is above 1, one might expect the group to be inclined to have “insider temptation,” and if not, one might expect a more solidaristic attitude. It is worthwhile remembering the underlying logic: for any group it easier to agree with a smaller fellow-group rather than a larger one. Thus, if the number of group members that are not affiliated with trade unions (x) is larger than the number of union members who do not belong the group (y), then it is easier for group members with union affiliation (z) to agree with union members who do not belong to the group (y).
In , I examine for which educational groups this condition is present. For each educational group, the horizontal dashed line marks the constant boundary of 1, and the black line shows the proportion α = x/y. Here, Norway and Spain appear as two opposites. In Norway all education groups remain or go under the boundary (in the case of secondary education group after 2004) through the examined period suggesting solidaristic attitude for all of them. In Spain we see the opposite: all groups are above the boundary all the time, which hints that they all may be inclined to have insider temptation. In Germany, on the other hand, while low education group remains under the boundary, which suggests solidaristic attitude, both secondary and tertiary education groups appear always above it and that suggests the possibility of insider temptation. The most interesting case, however, is UK. Here low and tertiary education groups both stay above the boundary in the entire period but secondary education group changes its position: before 2008 it is below the boundary implying solidaristic attitude but then it goes above it, and in this way, it becomes the only education group that changes its expected attitude from solidarity to insider temptation.
Figure 8. Movement of the attitude indicator (α) across groups and countries. See also and Equation 25.
As mentioned above, the dynamics of privilege and insider temptation operate independent from each other, and it is still not easy to combine all the insights that I have outlined so far. In fact, the instrument that I propose to use in order to grasp and compare the patterns of trade union affiliations within the context of profound social transformations is the two-dimensional model space that I outline above. This visualization instrument allows us to see “everything” that is discussed so far at one glance for all groups and across all countries.
is the application of this visualization tool to the case of educational groups. Here, in all graphs, the following abbreviations are used. L: low education group, S: secondary education group, T: tertiary education group. For each group, the abbreviation marks the point that is occupied in 2002 in terms of its scores of power (to what extent the relative size of a group within trade unions exceeds its relative size in the entire society) and representation (to what extent the relative size of the trade unions within a group exceeds the relative size of trade unions in the entire society) as defined respectively in (9) and (10). The arrow starting from this initial point ends at a location which shows the position occupied by the group in 2014 (the power and representation scores for all groups through the entire period are provided in Appendix 1). In this way, one can “summarize” the journey of the given group in the two-dimensional space in a time span of 12 years between 2002 and 2014.
Figure 9. Movements of educational groups in the visualization space.
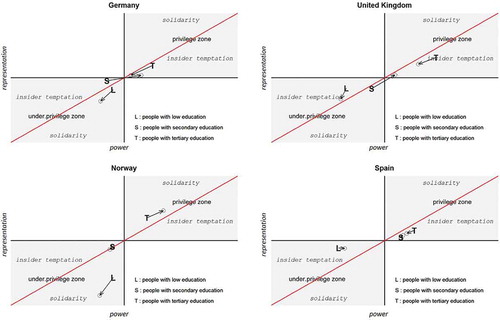
The four graphs given in not only summarizes everything that is pointed out in the preceding discussion but they also allow us to spot patterns common to all countries. The most striking thing is the common alignment of secondary and tertiary education groups in 2014 (the location where their arrows point out). Except for Norway, these two education groups are both residing in the privilege zone and in the region of insider temptation. Indeed, in these three countries, tertiary education group has been in that particular region already in 2002, and in the case of Spain, secondary education group was there as well since the beginning and it hardly moved after 12 years (except for one year: 2008). So the real pattern is that between 2002 and 2014, both Germany and the United Kingdom have resembled Spain in terms of the way in which their secondary and tertiary education groups are represented by trade unions. By translating the terms of the model into plain language, one can say this: by 2014 the relative size of these groups within trade unions is higher than their relative size in society, and the relative size of trade union members within these groups is larger than the relative size of trade union members in society. This double advantage makes them privileged. But the model tells us more. For each of these two groups, the number of people who belong to the group but are not affiliated with trade unions is larger than the number of union members that do not belong to the group. As long as reaching an agreement with a smaller fellow-group is easier, one expects both secondary and tertiary education groups to be inclined to ignore the interests of their fellows who are not affiliated with trade unions. It should be noted that the situation of the low education group is different. This group remained within the underprivileged zone through the entire period in all countries. In Germany and Norway, they moved within the underprivilege zone into the Southwest direction. This means that their relative size within trade unions declined further compared to their relative size in society, and this enhanced their underprivileged status. However, they stayed in the solidarity region because through the entire period, those people with low education and without union membership was a smaller group than those union members who had other educational levels. In the case of the United Kingdom and Spain as well, the low education group remained in the underprivilege zone but in the “insider temptation” region implying that the number of low educated people without union membership remained higher than union members with other educational levels. In the case of Norway, it is worthwhile to note that only the tertiary education group appeared privileged through the entire period but they remained in the solidarity region implying that union members without tertiary education was a majority compared to people with a tertiary education without union affiliation.
From the ongoing analysis, it is clear that all the information conveyed by previous graphs can be easily read in . Just by examining this figure one can identify those groups that enjoy a privileged position within trade unions and whether or not they are inclined to have insider temptation. Thus, this visualization method is the best way of operationalizing the mathematical tools developed above.
Now, having shown the empirical application of the model, I can answer the substantive question that I posed at the beginning of this section: Do trade unions provide a privileged position to those groups that are structurally weak? If we use education level as a factor of stratification, then the answer is “no.” The analysis shows that the most disadvantaged group, that is, the low education group, has an under-privileged position through the entire period in all countries. Thus, if the trade unions were able to affect labor market dynamics, then those people with low education are the least likely group to benefit from the resulting gains. Within this general pattern, however, one can observe a variation: in Germany and Norway, trade union members with low education are likely to show solidarity towards the rest of the low education group, while in Spain and the United Kingdom, the opposite is true.
On the other hand, if one includes those people with secondary education into the list of social segments with weak labor market status, then, in Germany and the United Kingdom, this particular group has moved from being underprivileged into the position of privilege within trade unions. In this new configuration, Germany and the United Kingdom resemble Spain. This fact may be linked to corollary 3 given above, that is, those groups with shrinking size would rapidly obtain a privileged position within unions during the process of trade union decline.
Summary and conclusion
Trade unions were once upon a time crucial actors in the political economy of advanced capitalist countries. However, since the 1980s, they have been gradually losing membership, and their ability to affect social and economic policies has been decreasing. The same period has also witnessed substantial transformations such as the decline of industry, expansion of international outsourcing, shrinking size of public employment, privatization, increasing female labor market participation, and computerization of production processes. In this context of change, the question of whether trade union decline has been a homogenous process affecting all social segments in the same way becomes quite interesting. Because trade unions despite their decline may still have some residual power and if the process of decline has not been homogenous across social segments, some groups may still acquire the capacity to affect policies due to their presence in trade unions. In this study, I try to develop some mathematical tools that would enable us to spot such privileged groups across countries and through time.
Under the assumption that trade unions opt for policies that reflect the preferences of the majority of their members, the model combines two dynamics: (1) the relative size of a given group within trade unions compared to the relative size of this group in society, and, (2) the relative size of trade unions within any group compared to the relative size of trade unions in entire society.
Of these two dynamics, the first one is utilized to see whether the relative power of a given group within unions would be higher compared to its power in society had there been a perfect representation mechanism endowing power to all groups in proportion to their sizes. And the second dynamic is operationalized to see whether or not relative power that a group acquires due to its higher proportion among trade union members compared to its actual size in society would actually be used to represent its interests by the unions. This relative representation dimension reflects whether or not the group constitutes a majority within trade unions. And assuming that it is easier to reach an agreement within a small group compared to a large group, I also defined another indicator, insider temptation, that hints whether those people belonging to a group and affiliated with trade unions at the same time would be more likely to use the power they acquire through trade unions in order to advance their narrow interests.
Against this background, three important results are presented and proved:
Relative power and relative representation must always have the same sign, and if they’re positive, they indicate privileged social groups within unions, and if negative, they indicate underprivileged social groups.
A given group attains a privileged position within unions if the number of union members within the group exceeds a specific boundary. To attain this boundary, one should first multiply the number of people belong to the group but not affiliated with unions by the number of union members who do not belong to the group. And then one should divide the outcome by the number of people who are neither union members nor belong to the group. The implication of this construction is that those groups with shrinking size would rapidly get privileged position within unions during the process of trade union decline as this would decrease the nominator and increase the denominator of the boundary condition.
If the absolute value of relative power is higher than that of relative representation, one may expect the group members affiliated with unions to ignore the interests of the group and instead try to advance their own narrow interests, and this may happen regardless of whether the group is privileged or not. The same thing may be expressed in more simple terms as follows: if the number of union members outside the group is smaller than the number of group members outside trade unions, this may imply at least the possibility of insider temptation.
As this summary shows in this study, I propose an alternative approach to the analysis of trade union strength that in my view provides proper instruments to understand the situation of various social groups within trade unions better within the context of trade union decline accompanied by substantial societal changes that alter the relative size of social groups. Indeed, the empirical application of these tools shows that they allow rather complicated dynamics to be captured, visualized, and compared across societies and through time quite succinctly. Therefore, I argue that a comprehensive analysis of existing trade union data by using the tools presented here may provide us with interesting insights that may hitherto be overlooked.
Acknowledgments
I thank Lucio Baccaro for the stimulating discussions about trade unions that motivated me to write this paper. I also thank the two anonymous reviewers of the journal for their comments and suggestions.
Notes
1 Baccaro et al (Citation2016, p. 802) assume that “occupations with statistically indistinguishable educational distributions require similar general skill sets.” They perform chi-square tests so as to merge occupations with statistically indistinguishable educational distributions (which refers to how people having the same ISCO single digit occupations are distributed over ISCED categories), and this allows them to generate four separate skill families, which they empirically show to be of crucial significance in labor market circumstances of employees. The educational categories that I use in this paper are in compliance with Baccaro et al’s skill classification in the sense that the way in which I merge ISCED categories does not mix skill categories that provide distinctive labor market chances.
References
- Akerlof, G. A. (1980). A theory of social custom, of which unemployment may be one consequence. The Quarterly Journal of Economics, 94(4), 749–775. doi:10.2307/1885667
- Arts, W., & Gelissen, J. (2002). Three worlds of welfare capitalism or more? A state-of-the-art report. Journal of European Social Policy, 12(2), 137–158. doi:10.1177/0952872002012002114
- Baccaro, L., Koçer, R. G., Galindo, J., & Pulignano, V. (2016). Determinants of indefinite contracts in Europe: The role of unemployment. Comparative Sociology, 15(6), 794–838.
- Barbieri, P. (2009). Flexible employment and inequality in Europe. European Sociological Review, 25(6), 621–628.
- Barone, C., & Van de Werfhorst, H. G. (2011). Education, cognitive skills and earnings in comparative perspective. International Sociology, 26(4), 483–502. doi:10.1177/0268580910393045
- Becher, M., & Pontusson, J. (2011). Whose interests do unions represent? Unionization by income in Western Europe. In D. Brady (ed.), Comparing European workers Part B: Policies and institutions (pp. 181–211). Emerald Group Publishing Limited.
- Booth, A. L. (1985). The free rider problem and a social custom model of trade union membership. The Quarterly Journal of Economics, 100(1), 253–261. doi:10.2307/1885744
- Breen, R. (2005). Explaining cross-national variation in youth unemployment: Market and institutional factors. European Sociological Review, 21(2), 125–134. doi:10.1093/esr/jci008
- Checchi, D., & Visser, J. (2005). Pattern persistence in European trade union density. A longitudinal analysis 1950–1996. European Sociological Review, 21(1), 1–21. doi:10.1093/esr/jci001
- Clegg, H. A. (1976). Trade unionism under collective bargaining: A theory based on comparisons of six countries. Oxford, UK: B. Blackwell.
- Crouch, C. (2011). The strange non-death of neo-liberalism. Cambridge, UK: Polity.
- Ebbinghaus, B., & Visser, J. (1999). When institutions matter: Union growth and decline in Western Europe, 1950-1995. European Sociological Review, 15, 135–158. doi:10.1093/oxfordjournals.esr.a018257
- Ebbinghaus, B., & Visser, J. (2000). Trade unions in Western Europe since 1945. London, UK: Macmillan Reference.
- EIRO. (2009). Trade Union membership 2003-2008. European Foundation for the Improvement of Living and Working Conditions, Dublin, Ireland.
- Esping-Andersen, G. (1989[2013]). The three worlds of welfare capitalism. Cambridge, UK: Polity Press.
- Freeman, R. (1990). On the divergence of unionism among developed countries. In R. Brunetta & C. Dell’aringa (eds.), Labour relations and economic performance (pp. 304–322). Palgrave Macmillan UK.
- Goos, M., & Manning, A. (2007). Lousy and lovely jobs: The rising polarization of work in Britain. The Review of Economics and Statistics, 89(1), 118–133. doi:10.1162/rest.89.1.118
- Goos, M., Manning, A., & Salomons, A. (2009). Job polarization in Europe. The American Economic Review, 99(2), 58–63. doi:10.1257/aer.99.2.58
- Gumbrell-McCormick, R., & Hyman, R. (2013). Trade unions in Western Europe: Hard times, hard choices. Oxford, UK: Oxford University Press.
- Hall, P. A., & Soskice, D. W. (Eds.). (2001). Varieties of capitalism: The institutional foundations of comparative advantage (Vol. 8, No. 3). Oxford, UK: Oxford University Press.
- Harvey, D. (2005). A brief history of neoliberalism. Oxford, UK: Oxford University Press.
- Hayter, S., & Stoevska, V. (2010). Social dialogue indicators: Trade union density and collective bargaining coverage: International statistical inquiry 2008-09. Geneva, Switzerland: ILO.
- Hyman, R. (1994). Theory and industrial relations. British Journal of Industrial Relations, 32(2), 165–180. doi:10.1111/bjir.1994.32.issue-2
- Hyman, R. (2001). Trade union research and cross-national comparison. European Journal of Industrial Relations, 7(2), 203–232. doi:10.1177/095968010172006
- ILO. (1997). World labour report. Geneva, Switzerland: International Labour Office.
- Ishikawa, J., & Lawrence, S. (2005). Social Dialogue Indicators: Trade union membership and collective bargaining coverage; statistical concepts, methods and findings. Geneva, Switzerland: Social Dialogue, Labour Law and Labour Administration Department, International Labour Office.
- Kalleberg, A. L. (2000). Nonstandard employment relations: Part-time, temporary and contract work. Annual Review of Sociology, 26(1), 341–365. doi:10.1146/annurev.soc.26.1.341
- Kalleberg, A. L. (2009). Precarious work, insecure workers: Employment relations in transition. American Sociological Review, 74(1), 1–22. doi:10.1177/000312240907400101
- Kerr, C., Harbison, F. H., Dunlop, J. T., & Myers, C. A. (1960). Industrialism and industrial man. Int’l Laboratory Reviews, 82, 236.
- King, D. K. (1988). Multiple jeopardy, multiple consciousness: The context of a Black feminist ideology. Signs: Journal of Women in Culture and Society, 14(1), 42–72. doi:10.1086/494491
- Koçer, R. G. (2007). Trade unions at whose service?” Coercive partnerships and partnership in coercion in Turkey’s metal sector. Industrielle Beziehungen/The German Journal of Industrial Relations, 14(3), 245–269.
- Koçer, R. G., & Hayter, S. (2011). Comparative study of labour relations in African countries. Amsterdam Institute for Advanced Labor Studies Working Paper (p. 116). Amsterdam, the Netherlands: Amsterdam Institute for Advanced Labour Studies.
- Koçer, R. G., & Van de Werfhorst, H. G. (2012). Does education affect opinions on economic inequality? A joint mean and dispersion analysis. Acta Sociologica, 55(3), 251–272. doi:10.1177/0001699312450591
- Locke, R. M., Kochan, T. A., & Piore, M. J. (1995). Employment relations in a changing world economy. Cambridge, MA: Mit Press.
- Meyer, J. W. (1977). The effects of education as an institution. American Journal of Sociology, 83(1), 55–77. doi:10.1086/226506
- Müller, W., & Gangl, M. (2003). Transitions from education to work in Europe: The integration of youth into EU labour markets. Oxford, UK: Oxford University Press on Demand.
- OECD. (1991). Employment Outlook of 1991. Paris, France: Organization for Economic Cooperation and Development Labour Market Statistics.
- Offe, C., & Wiesenthal, H. (1980). Two logics of collective action: Theoretical notes on social class and organizational form. Political Power and Social Theory, 1(1), 67–115.
- Schnabel, C., & Wagner, J. (2005). Determinants of trade union membership in West Germany: Evidence from micro data, 1980–2000. Socio-Economic Review, 3(1), 1–24. doi:10.1093/SER/mwh011
- Scruggs, L. (2002). The Ghent system and union membership in Europe, 1970-1996. Political Research Quarterly, 55(2), 275–297. doi:10.1177/106591290205500201
- Shavit, Y., & Muller, W. (1998). From school to work. A comparative study of educational qualifications and occupational destinations. 2001 Evans Road, Cary, NC 27513: Oxford University Press.
- Streeck, W. (2016). How will capitalism end? Essays on a failing system. London, UK: Verso Books.
- Van de Werfhorst, H. G. (2011). Skill and education effects on earnings in 18 countries: The role of national educational institutions. Social Science Research, 40(4), 1078–1090. doi:10.1016/j.ssresearch.2011.03.004
- Visser, J. (1991). Trends in trade union membership. Employment Outlook, (1991, 97–134.
- Visser, J. (2002). Why fewer workers join unions in Europe: A social custom explanation of membership trends. British Journal of Industrial Relations, 40(3), 403–430. doi:10.1111/bjir.2002.40.issue-3
- Visser, J. (2016). The ICTWSS database: ICTWSS: Database on institutional characteristics of trade unions, wage setting, state intervention and social pacts in 51 countries between 1960 and 2014. Amsterdam, the Netherlands: Amsterdam Institute for Advanced Labour Studies, University of Amsterdam.
- Western, B. (1995). A comparative study of working-class disorganization: Union decline in eighteen advanced capitalist countries. American Sociological Review, 60, 179–201. doi:10.2307/2096383
Appendix 1.
Evolution of power (P) and representation (R) trends, see also , and Equations 9 and 10