
 ?Mathematical formulae have been encoded as MathML and are displayed in this HTML version using MathJax in order to improve their display. Uncheck the box to turn MathJax off. This feature requires Javascript. Click on a formula to zoom.
Abstract
The principal eigenvector of the adjacency matrix is widely used to complement degree, betweenness and closeness measures of network centrality. Employing eigenvector centrality as an individual level metric underutilizes this measure. Here we demonstrate how eigenvector centralization, used as a network-level metric, models the potential, or limitation, for the diffusion of novel information within a network. We relate eigenvector centralization to assortativity and core – periphery and use simple simulations to demonstrate how eigenvector centralization is ideal for revealing the conditions under which network structure produces suboptimal utilization of available information. Our findings provide a structural explanation for the persistence of “out of touch” business and political leadership even when organizations implement protocols and interventions to improve leadership accessibility.
1. Introduction
High centrality scores in social networks are often correlated with leadership, and good communication among leaders is associated with efficiency. High network centralization associated with scale-free networks, measured as high variance among nodal degree centrality scores within a network, is generally associated with positive outcomes, including increased performance and the efficient diffusion of information through communication networks (for example, Barabasi Citation2002; Ahuja et al., Citation2003, Cross and Cummings, Citation2004, Tsai, Citation2001). Other research, however, has shown that network centralization can reduce group performance (Grund, Citation2012). Here we resolve the apparent contradiction in these results and demonstrate how network metrics, such as eigenvector centrality and centralization, assortativity, and indicators of high density within the core versus periphery of a network are better indicators of communication quality and efficiency than degree centralization. These metrics reveal the role that network structure plays in insolating leaders and thereby reducing the group’s ability to consolidate the opinions and knowledge resident throughout the network. Our approach focuses on structural features of the network as a complement to social psychological explanations for elite insolation and flawed decision-making, such as Groupthink (Janis, Citation1982).Footnote1
The main objective of this paper is to demonstrate how network structural properties can bias information diffusion and recommend metrics for identifying and quantifying these properties. The main implication of this paper is that groups or organizations with a central core of members with a strong tendency to interact with one another, and not with periphery members, create an impermeable or closed core that inhibits their effectiveness in consolidating the range of accessible information when the information available is equally reliable for each node. This is because by communicating more with one another they amplify each other’s messages, creating an echo chamber that biases the influence on the network consensus. That an organization’s vulnerability to the insularity of leaders can stem from the overall network structure rather than the personalities or dynamics resident among the leadership may help explain the pervasiveness of this problem despite awareness of the issue and organizational attempts at mitigation. Our mathematical and simulation models suggest that the insulation and isolation of elites is inevitable for some identifiable topologies. Specifically, we show how the principal eigenvector of the adjacency matrix of a graph, commonly used as a measure of centrality, but which is also interpretable in terms of the diffusion of communication in a network, is useful to identify network vulnerability to “out of touch” elites. We follow up by introducing two related metrics, the H matrix and K, a measure of salient network size, to quantify the inclination of a network’s topology to bias the dissemination of ideas and discuss how these concepts are related to the concepts of core/periphery and assortativity.
The sociological relevance of measures to identify the degree to which social network structures are vulnerable to insolated elites is illustrated by the frequent news reporting of employees or party members who feel ignored by their leadership. That elite decision-makers, in government, or organizations more generally, can become insolated, and tone deaf to the range of opinion resident in the network, to the detriment of the organization, is well known (Izzo, Citation2011; Kellerman, Citation2004; McVanel & Zalter-Minden, Citation2015). Research on this topic is largely focused on leadership style and the social psychology that limits good decision-making by those within the elite group (Leana, Citation1985; Turner & Prakanis, Citation1998). Solutions posed have focused on improving the group dynamics within the elite group and adjusting how members of the inner circle relate to leadership. Institutional remedies have also included policies to promote bottom-up communication of ideas or problems through suggestion boxes and whistleblower programs, which can dramatically improve performance. For instance, when American Airlines was on the verge of bankruptcy in 2004 a new CEO, Gerald Aprey instituted company-wide policies designed to elicit, and take seriously, ideas from the workforce. Aprey did this by changing the communication structure of the company by creating direct paths between all employees and leadership. These shortcuts (Watts, Citation1999) bypassed the managerial filters that would normally, censor, vet and extinguish these ideas before they would reach the C-suites. Employee suggested innovations implemented that year included reusing coffee makers from retired DC-10s, loading passengers in the back of the plane to increase lift and save on fuel, and changing the orientation of plane parts to make it easier for crews to make repairs. It was estimated that the implementation of these ideas saved the company over 100 million dollars in that first year. This fell short of what was required to avoid bankruptcy and Aprey was forced to resign. The company soon returned to their more traditional corporate communications model (Taminciologlu, Citation2004).
This example illustrates that structural factors can limit or facilitate the harvesting and utilizing of endogenous ideas. Structures that insolate leaders can hinder the free exchange of information thereby limiting innovation and efficiency in the organization. We seek to extend the research on the reasons, or causes, of insular leadership beyond the psychological focus on personality, or small group processes, to sociological factors focused on the structure of the organization. As a first step we introduce metrics for measuring structural propensity toward insularity. We assume that network structure is a fundamental factor in insolating organizational leadership and hypothesize that eigenvector centralization and related measures could be used to identify features of network structures that indicate vulnerability to insulated leadership.
2. Methods
We begin this section with a simple simulation of the phenomenon of interest, including the presentation of results because we use it as a foil to discuss the models and simulations that follow. Following the presentation of this simulation, we review eigenvector centrality emphasizing its relevance as a mathematical model of the information flow process that can reveal positional biases that impact the distribution of ideas within networks (Bonacich, Citation2007; Borgatti, Citation2005; Borgatti & Everett, Citation2006). We then introduce new metrics derived from eigenvector centrality such as the use of a Gini coefficient as a measure of eigenvector centralization, and an original K measure of salient network size, to identify structures at risk. After introducing these new metrics, we describe the mechanics of a series of simulations showing how the problem of insular leaders relates to network structure including degree centrality (centralization), assortativity, core periphery, eigenvector centrality and the eigenvector centralization derived metrics introduced in the previous section.
2.1. A simple example illustrating a structural cause of information bias
To demonstrate that network topology is sufficient to create an information diffusion bias within a network, and that analytical approaches that rely on degree and betweenness centrality and centralization are not appropriate for modeling this phenomenon, we present the results of a simple simulation. The motivating scenario for this simulation is that of a group effort to consolidate information to inform a decision. Information can represent valid pro or con arguments for a course of action or tidbits of information that when properly combined can reveal an answer (Bonacich, Citation1990). For this illustration, the group goal is to share information to arrive at a collective decision. All actors have equally valuable bits of information, which if weighted equally would form an accurate assessment.
To isolate the effect of network structural properties on the pervasiveness of a message we introduce an information transmission model that only considers source and is agnostic to message content. In this model, actors lack strategy, memory, or intent. This is by design in order to isolate the impact of structural properties. The model works as follows: newly acquired information, defined as “message packets received on the previous round” can be passed to any or all adjacent nodes on the subsequent round. The focus here is on the acquisition of packets of information, not the uniqueness of the message. Using this very simple communications model, we reveal what might plausibly happen to opinions initiated by actors in a network, by tracing messages from different origins through the network over time.
Consider the small network (). Adjacency indicates pairs of actors can directly communicate with each other. Upon receiving new information, each actor may or may not transmit the information to adjacent others. For simplicity, for this illustration all messages were passed and the process repeats for 14 iterations. At each iteration, because the p value was set to 1, information would flow to all adjacent nodes. At the culmination of the simulation the pervasiveness of messages is evaluated as a tally of the number of times the packet of information was transmitted. Information repeated more frequently over the course of the simulation will have more weight in determining the final consensus. Informational packets are identified and distinguished only by their point of origin at the first iteration. In this manner, we can compare the pervasiveness, or persuasiveness, of messages as a function of their origin with regard to network position only.
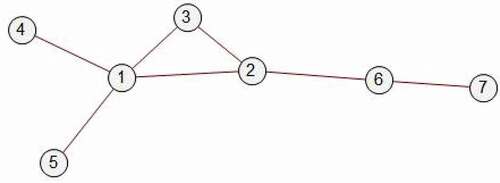
A comparison of the pervasiveness of a message originating at position 3 versus position 6 over 14 iterations for one simulation run is presented in . The rows correspond to the iteration number and columns to the seven network positions as the message traverses the network. The left half of the table presents the trajectory of the message that originated at position 3. The first row indicates the origin of the message. The second row reveals the outcome of the first iteration of the model: transmission of the message to positions 1 and 2. During each subsequent iteration, each position that receives the message may or may not communicate this “fact” or “opinion” to adjacent nodes. At the end, summing all the numbers in the table, the message originating at position 3 was repeated 313 times (including the initial transmission). Contrast this with the message initiated by actor 6 on the left side of the table: after 14 iterations, the information that originated at position 3 was repeated only about half as often, 162 times. Although no more valuable or accurate, the information that originate with position 3 will have a disproportionate effect on the group’s final consensus.
Table 1. Comparison of the diffusion of messages initiated in Positions 3 and 6 as they traverses the network ()
presents conventional centrality scores for this network. The difference in outcome is not directly attributable to the number of direct connections or degree centrality: both positions have two direct ties and position 6 is advantaged over position 3 with regard to betweenness centrality. Position 3 does score slightly higher with regard to closeness, but the main advantage for position 3 is that his two connections are to other high degree centrality nodes: positions 1 and 2. This is reflected in the eigenvector centrality scores. Together, positions 1 through 3 function like an echo chamber, repeating and amplifying each other’s messages over and over through time and drowning out the signal that originated from other nodes. The relationship between eigenvector centrality and the distribution of packets is not accidental, the simulation was purposely designed to illustrate the process that is eigenvector centrality.
Table 2. Centrality measures for network depicted in
2.2. Eigenvector centrality and the H matrix as descriptions of communication patterns in networks
The eigenvector is best known within network analysis as a measure of network centrality:
λ is the principle eigenvalue for an adjacency matrix A, and x is the eigenvector associated with the eigenvalue. This eigenvector is interpretable as a measure of centrality. Intuitively, a position is central, with respect to eigenvector centrality, if it is connected to other positions which have many connections. It turns out that these are the very conditions under which an actor will have a large influence on the communications network. More importantly for this paper, the eigenvector is also part of a family of measures describing communication patterns in networks (Bonacich, Citation1972; Bonacich, Citation2007; Bonacich & Lloyd, Citation2001; Katz, Citation1953). Here we show that the eigenvector is more than just a means to rank order centrality among nodes; it is a structural measure that computes ranking as a function of direct connection to ties and proximity to nodes with high degree of centrality throughout the network. EquationEquation (2)(2)
(2) represents the model (Bonacich & Lloyd, Citation2001; Katz, Citation1953), where the parameter α is positive and less than the reciprocal of the largest eigenvector of A and u is a column vector of ones.
These equations represent the implicit communication model of the scenario presented in the illustrative example above and operates as follows: adjacent nodes transmit information and when a node receives a signal, it has an independent probability α of transmitting this signal to each of its contacts. More specifically, if a position receiving a signal has two contacts, the probability that it transmits this signal to both contacts is α2, to neither contact is (1-α)2, and just one of the two is 2α(1-α). The parameter α is assumed to be the same for every vertex in the network. The vector y then has a simple interpretation: For actor i the value yi, is the expected number of signals directly or indirectly generated by i’s initial signal as it reverberates throughout the network before the signal dies out.
The last series converges at |α| < 1/λ, the reciprocal of the largest eigenvalue. The relation between the two models (1) and (2) is that as α approaches, but does not reach, 1/λ in Equationequation (2)(2)
(2) , y becomes more and more proportional to an eigenvector x of the largest eigenvalue in Equationequation (1)
(1)
(1) . We can therefore use x and y interchangeably for large values of α. The vector x is the maximum information flow described in the communication process of Equationequation (2)
(2)
(2) .
The matrix H gives the expected number of information transfers of the row actor’s information to the column actor before transmission dies out. The value hij is the expected number of times actor i’s information is transmitted to actor j. The columns of H give the sources of the information to each actor. Relating this to the simulation in the previous section, is the H matrix for the network in , the cells represent the expected number of transfers between the row and column position and Hu represents the expected sum of transfers over the duration of the simulation.
Table 3. H matrix for network
The matrix H differs from the adjacency matrix although both can be expressed as a weighted sum of the eigenvectors (normalized to have length 1).
The eigenvector coefficients for H, , places a much greater weight on the eigenvector of the largest eigenvalue than do the coefficients for A particularly as α approaches the reciprocal of the largest eigenvalue. Let λ1 be the largest eigenvalue and λ2 be any other (necessarily smaller) eigenvalue.
This means that is increasingly proportional to H as α approaches its maximum value:
Looking at Equationequation (7)(7)
(7) , every column of H tends to be proportional in the limit to the eigenvector of the largest eigenvalue, which is the eigenvector measure of centrality. The interpretation is that the individual with the highest eigenvector centrality will dominate the information received by every group member.
3. Measures of the distribution of influence
The matrix H as a metric is limited, mainly because it produces “too much information.” It provides information about transfers between all pairs, from which an analyst can gain a deep understanding of the structure of opportunity for transmitting information through a network. More tractable would be simple metric to provide an analyst with an easily interpretable summary statistic that characterizes the network as a whole and would allow researchers to compare networks. In this section, we introduce two simple and intuitive measures of the distribution of the “propensity to be heard” in a network. First, we introduce an original metric, K, a measure of salient network size. Second, we advocate for the use of a Gini coefficient as a measure of eigenvector centralization.
The vector p (Equationequation (8)(8).
(8). ) normalizes the eigenvector of the largest eigenvalue so that its sum is 1.00. The values of p reflect the limiting proportion of information received from every network node by every node as information flow, α approaches its maximum.
Assume that the e vector in Equationequation (3)(3)
(3) consists of a sample of independent observations from the same population with variance σ2. Each individual has an equally valid but incomplete bit of information to contribute and the amalgam of all bits of information is more valid. The best amalgam of available information would weight each source equally; the more unequal these weights the more unreliable the amalgam will be. In this model, the values of the vector p will all be close to the eigenvector centrality scores of the nodes. The variance of these weights for actor i will be at the limit,
which takes its minimum value of σ2/n only when all the values in a column are equal: in other words, all positions are equal in eigenvector centrality. It will take its maximum value of σ2 when all i’s information comes from one source.Footnote2 The smaller the measure, the better, because a small value means that individuals have equal access to the information from all other nodes. The higher the eigenvector centralization in a network, the more disproportionate the influence of the highly central members. This metric represents the process by which the pattern of relations among well-connected (high degree) nodes, in addition to their separate dominant positions in the network, greatly impacts outcomes. When these highly central actors preferentially attach, their influence is amplified beyond their additive influence, in a manner that can be detrimental to the structure as a whole.
A small modification of Equationequation (9)(9)
(9) provides a more interpretable and intuitive metric. Let K be the number of equally weighted information sources from which an individual is effectively receiving information
K can vary from 1 to n, the number of nodes in the network. If K = 1 each individual in the network is functionally receiving information from just one source, in other words, only one source of information is salient. If K = n the network is optimally structured so each individual is receiving information equally from all other nodes. K can be interpreted as the number of nodes in a network that impact the outcome, or the size of the salient network.Footnote3
The alternative approach to presenting this information is to report the variance of the eigenvector as a centralization metric. This could be done in many ways. One convention in network analysis is to consider range, or deviation from the maximum, as a measure of centralization (Freeman, Citation1978). A second is to use the standard deviation. Here, we recommend the use of a Gini coefficient (Massey and Denton 1988) of eigenvector centrality as a measure of equality with regard to an ability to transmit a message. The advantage of the Gini coefficient to other centralization measures is that in its computation all values are directly compared to all other values rather than indirectly through a measure of central tendency for the standard deviation, or maximum value for a Freeman centralization. The result is a single metric that ranges from 0 to 1 regardless of the size of the network: 0 revealing that all nodes have equal opportunity to communicate their messages; 1 revealing the dominance of a single dominant node. The advantage of the Gini coefficient to the K metric is its interpretability for comparing networks of different sizes.
3.1. Assortativity and core periphery
Now that we have introduced the H matrix, K and the use of the Gini coefficient, we will revisit the illustrative example in . For , positions 1, 2, and 3 gain their disproportionate influence not only because they are well connected, with regard to degree centrality (Freeman, Citation1978), but because they are also connected to each other. This example, which is a computational model of mechanics for deriving or computing eigenvector centrality, captures a consequence of graph assortativity (Newman, Citation2002), the correlation between the degree centrality of connected nodes in a graph, or homophily with regard to degree distribution. When assortativity is zero there is no association between degree centrality for adjacent nodes. When assortativity is high, high degree nodes are disproportionately connected to each other. When assortativity is negative there is a tendency for high and low degree nodes to be connected to each other.
Assortativity is important because it is the network structural feature that distinguishes degree centrality and centralization from eigenvector centrality and centralization. Eigenvector centralization is high when positions with high degree centrality are connected to each other, whereas the interconnections among high degree nodes plays no role in degree centralization. The following pseudo equation represents this conceptual relationship:
Assortativity, in turn, is related to the concept of core-periphery (Borgatti & Everett, Citation2000; König et al., Citation2010, Citation2014). The structure presented in , is an example of a simple core – periphery network: positions 1, 2 and 3 make up the core, and the remainder of nodes are in the periphery. High assortativity can result from structural or social causes. For instance, a purely structural rule such as the type of preferential attachment that generates scale free networks tends toward producing high assortativity networks, as high degree nodes, like other nodes, are more likely to attach to one another than to low degree nodes. In an organization the level of assortativity can vary as a function of organizational structure and rules. In an informal network (i.e. high school social hierarchy), assortativity results as popular people seek out others of their own, or higher, status. Regardless, of mechanism, for all structures, as high degree nodes become attached to one another they form a core.
The computational model presented earlier illustrates that structure can determine which ideas dominate based on the position of introduction. Regardless of the value, beauty, efficacy, or usefulness of an idea, those that originate within a core have a higher likelihood to resonate that those that originate in the periphery. The implication of this is that, regardless of the value, beauty, efficacy, or usefulness of an idea, those that originate in the periphery are likely to be overlooked or ignored. The example also reveals that neither degree nor betweenness centralization distinguished well positioned from poorly positioned nodes.
3.2. Computational model of structural features of insular leadership
Simple simulations are used to illustrate the structural impact of assortativity on the diffusion of ideas through networks. For each simulation, we begin with a single component, random (Erdös-Rényi) networks and vary assortativity for these networks by holding the degree distribution constant and rewiring pairs of edges connecting higher degree nodes to one another. Three simulations are presented. The first simulation generated two small (10 node networks) to be compared to illustrate the importance of assortativity and to demonstrate how to interpret the Gini coefficient of Eigenvector centrality and the K metric. The remaining simulations output network metrics for single component, random (Erdös-Rényi) networks of 100 vertices and 150 edgesFootnote4 as node networks as assortativity increased.Footnote5
4. Results
Results from our first simulation reveals the relationship between assortativity and eigenvector centralization. presents two ten node networks with identical degree distributions. ), the low assortativity graph was randomly generated. ) was constructed from ) by computationally rewiring 12 edges to increase assortativity without altering nodal degree. A visual comparison of the structure of ) the low assortativity graph, with ) reveals a dense cluster (or core) of high degree vertices (3, 5, 6, 9 & 10). Degree centrality, presented in , cannot distinguish members of the core and periphery. More important, for this paper, degree centralization, whether calculated as Freeman (Citation1978) recommends or as a Gini coefficient, is obviously identical for both structures and is thus not able to reveal any difference between the two structures. In contrast, eigenvector centralization measures for these networks are different. What is important is not that nodes that are part of the core have higher eigenvector centrality scores than the peripheral nodes. The same five nodes also have higher degree centrality scores than the others, and those same nodes also had the five highest eigenvector centrality scores in the low assortativity network. What eigenvector centralization metrics reveal is how the two networks differ. A comparison of the distribution of the eigenvector centrality scores for the two networks using the Gini coefficient reveals that the network in ) has less variance, or less differentiation among nodes than the second structure, 0.26 for ) and 0.40 for ). The interpretation of the K value for the two networks reveals that although both have 10 vertices, in the low assortativity network information that originates in 8 of the 10 nodes is sustained, as compared to the high assortativity network, with a K value of 6.55.
Table 4. Degree and eigenvector centrality for networks depicted in
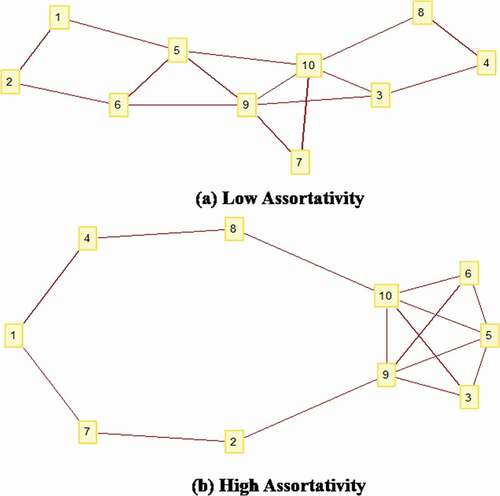
Eigenvector centrality is increased by connections to high degree neighbors, so when high degree nodes are preferentially directly connected to one another, and low degree nodes are preferentially connected to one another, eigenvector centralization is high. In other words, increases in assortativity are reflected in increases in eigenvector centralization.
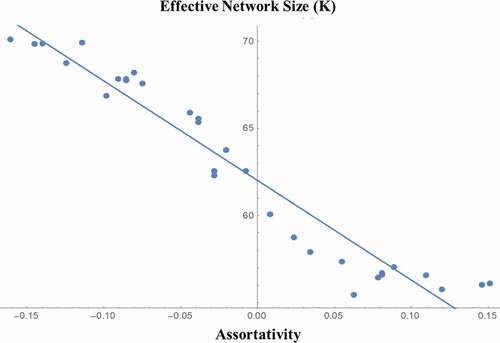
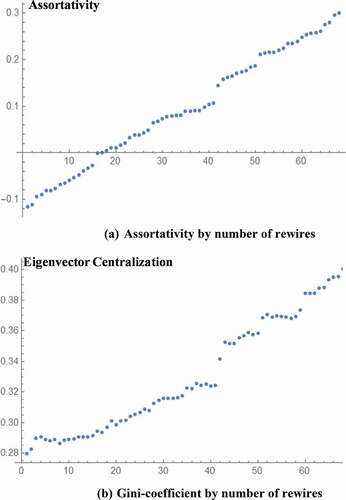
To illustrate how network structure can bias the distribution of information we compared simulated networks with varying assortativity, holding degree distribution constant. Increasing assortativity changed the structure of the networks consistently. Connectivity among nodes with high degree of centrality generated core-periphery structures. As assortativity increased the cores of the network became more and more dense. Initially, these cores were permeable: information originating outside the core maintained influence, but as assortativity increases the cores became closed. In other words, as assortativity increased, K, the number of nodes that influenced the outcome, was reduced, as the information from peripheral nodes was excluded and lost.Footnote6 illustrates the reduction in the functional size of the network as assortativity increases.
As expected, as assortativity increased () the Gini-coefficient for eigenvector centrality () increases: as nodes preferentially attach to nodes with similar degree centrality patterns emerge that produce an over-representation of the messages originating in high degree nodes. The distribution of information within networks with a core/periphery pattern that has a large Gini-coefficient for eigenvector centrality will be dominated by the information that originated in the core, as densely connected cores produce an echo effect which amplifies its messages. Internal connections among core members can matter as much as the individual prominence of core members.
6. Discussion
The primary goal of this paper was to introduce an approach to measure organizational network structure to reveal a propensity toward out of touch leadership. We demonstrate that to do this requires network analyses focused on metrics beyond degree centrality and centralization and show that assortativity, eigenvector centrality and core versus periphery density adds nuance to our understanding of network function. One interesting insight is that the closure of the core was not necessarily a function of a leadership decision to be exclusive, as previous work on the breakdown of leadership assumes, but a consequence of the network structure.
It is important to note that this paper does not contradict research indicating that networks with high degree centralization are efficient (Barabasi, Citation2002; Yamaguchi, Citation2000; Buskens and Yamagishi, Citation1999). Networks with high degree centralization are optimal for transmitting a single message through a network. This paper focuses on a slightly different question: the efficient consolidation or consideration of the variety of opinions resident in the network. The issue we highlight is model specification. If the question is only of the efficient diffusion of an idea or solution, then degree centrality and centralization is an appropriate model. If, however, the question regards finding the best solution resident among members of a network, then the use of this alternative metrics is recommended. In fact, this analysis suggests that those network structures that are optimal for diffusing messages may handicap an organization’s ability to optimally formulate that message. One organizational objective seeks uniformity, the second diversity.
It also is important to distinguish the finding presented here from the well-developed and validated Friedkin and Johnsen (Citation2011) model of network attitude influence in groups. The Friedkin – Johnsen model, based on an earlier model by DeGroot (Citation1974) formalizes the idea that individuals update their opinions to be in accord with the attitudes of those who influence them. The process that Friedkin and Johnsen describe is quite different from the one presented in this paper, although the eigenvector is key to both. In the Friedkin and Johnsen model each node communicates its attitudes to each adjacent node and then reformulates its attitudes as a weighted average (not necessarily equal) of the attitudes of its contacts based on the information received. In our simpler model, rather than attitudes, information is flowing through the network, and individuals are not explicitly altering their beliefs, but rather simply redistributing information. This simpler focus draws attention to assortativity as an important structural feature of a network and demonstrates how the eigenvector and eigenvalue reveals how high assortativity insolates core nodes in a network. Importantly, the focus of our model is not on which nodes have influence, but on the magnitude or inevitability of that influence.
There are circumstances in which an unequal weighting of the nodes is desirable. Suppose positions vary in the reliability of their information. EquationEquation (9)(9)
(9) should then be replaced by the more general Equationequation (11)
(11)
(11) .
The optimal weighting of each node is inversely proportional to the inverse of the reliability of the information provided by each node.
The eigenvector weighting is non-optimal if the information available to the core nodes is particularly reliable, in which case the core nodes should have a greater weight than their centrality. In such cases, for example, if specialized expertise is necessary when considering solution options, higher degree differences or a closed core may be better.
Notes
1 Groupthink research has operationalized cohesiveness as mutual attraction (Leana, Citation1985) and social identity maintenance (Turner & Prakanis, Citation1998) with limited success. We propose a structural explanation in place of the conventional social psychological explanation.
2 Note that this amalgamation issue in networks is different from the classic much studied problem of how information becomes more and more distorted as it passes through a network.
3 Jia et al. (Citation2015) also explore the conditions for equality in decision-making but they use the particular parameters of the Friedkin-Johnsen model to vary the degree of democratic decision-making, not the exclusiveness of the core.
4 We also looked at networks with a power law distribution of degree generated by preferential attachment. The results were essentially the same. Although the power law networks have a stronger core-periphery pattern, we decided to use Erdös-Rényi random graphs because their properties are better known.
5 Mathematica version 11 was used to generate simulated networks.
6 The relationship between centralization and assortativity may be different for different measures of centrality: betweenness, closeness, etc. Kang (Citation2007) has found a negative relationship between centralization and assortativity but his analysis is based entirely on degree centrality, not eigenvector centrality. In eigenvector centrality centralization increases as central members connect to one another.
References
- Ahuja, k., Galletta, K. F., & Carley, K. M. (2003). Individual centrality and performance in virtual R&D groups: An empirical study. Management Science, 49(1), 21–38. https://doi.org/https://doi.org/10.1287/mnsc.49.1.21.12756
- Barabási, A. L. (2002). Linked: The New Science of Networks. Plume.
- Bonacich, P. (1972). Factoring and weighting approaches to status scores and clique Identification. Journal of Mathematical Sociology, 2(1), 113–120. https://doi.org/https://doi.org/10.1080/0022250X.1972.9989806
- Bonacich, P. (1990). Communication dilemmas in social networks: An experimental study. American Sociological Review, 448–459.
- Bonacich, P. (2007). Some unique properties of eigenvector centrality. Social Networks, 29(4), 555–564. https://doi.org/https://doi.org/10.1016/j.socnet.2007.04.002
- Bonacich, P., & Lloyd, P. (2001). Eigenvector-like measures of centrality for asymmetric relations. Social Networks, 23(3), 191–201. https://doi.org/https://doi.org/10.1016/S0378-8733(01)00038-7
- Borgatti, S. P. (2005). Centrality and network flow. Social Networks, 27(1), 55–71. https://doi.org/https://doi.org/10.1016/j.socnet.2004.11.008
- Borgatti, S. P., & Everett, M. G. (2000). Models of core/periphery structures. Social Networks, 21(4), 375–395. https://doi.org/https://doi.org/10.1016/S0378-8733(99)00019-2
- Borgatti, S. P., & Everett, M. G. (2006). A graph-theoretic perspective on centrality. Social Networks, 28(4), 466–484. https://doi.org/https://doi.org/10.1016/j.socnet.2005.11.005
- Buskens, V., & Yamaguchi, K. (1999). 9. A New Model for Information Diffusion in Heterogeneous Social Networks. Sociological methodology, 29(1), 281–325. https://doi.org/https://doi.org/10.1111/0081-1750.00067
- Cross, R., & Cummings, J. N. (2004). Tie and network correlates of individual performance in knowledge-intensive work. The Academy of Management Journal, 47, 928–937. https://doi.org/https://doi.org/10.5465/20159632
- DeGroot, M. H. (1974). Reaching a consensus. Journal of the American Statistical Association, 69(345), 118–121. https://doi.org/https://doi.org/10.1080/01621459.1974.10480137
- Freeman, L. C. (1978). Centrality in social networks conceptual clarification. Social Networks, 1.3(3), 215–239. https://doi.org/https://doi.org/10.1016/0378-8733(78)90021-7
- Friedkin, N. E., & Johnsen, E. C. (2011). Social influence network theory. Cambridge University Press.
- Janis, I. L. (1982). Groupthink: Psychological studies of policy decisions and fiascoes. Houghton Mifflin.
- Grund, T. U. (2012). Network structure and team performance: The case of English Premier League soccer teams. Social Networks, 34(4), 682–690. https://doi.org/https://doi.org/10.1016/j.socnet.2012.08.004
- Izzo, J. (2011). Stepping up: How taking responsibility changes everything. Berrett-Koehler Publishers.
- Jia, P., et al. (2015). Opinion dynamics and the evolution of social power in influence networks. Siam Review, 57(3), 367–397. https://doi.org/https://doi.org/10.1137/130913250
- Kang, S. K. (2007). Equicentrality and network centralization: A micro-macro linkage. Social Networks, 29(4), 585–601. https://doi.org/https://doi.org/10.1016/j.socnet.2007.07.004
- Katz, L. (1953). A new status index derived from sociometric analysis. Psychometrika, 18(1), 39–43. https://doi.org/https://doi.org/10.1007/BF02289026
- Kellerman, B. (2004). Bad leadership: What it is, how it happens, why it matters. Harvard Business Press.
- König, M. D., Tessone, C. J., & Zenou, Y. (2010). From assortative to dissortative networks: The role of capacity constraints. Advances in Complex Systems, 13(4), 483–499. https://doi.org/https://doi.org/10.1142/S0219525910002700
- König, M. D., Tessone, C. J., & Zenou, Y. (2014). Nestedness in networks: A theoretical model and some applications. Theoretical Economics, 9(3), 695–752. https://doi.org/https://doi.org/10.3982/TE1348
- Leana, C. R. (1985). A partial test of Janis’ groupthink model: Effects of group cohesiveness and leader behavior on defective decision making. Small Group Research, 23, 427–458.
- McVanel, S., & Zalter-Minden, B. (2015). Forever Recognize Others’ Greatness: Solution-Focused Strategies for Satisfied Staff, High-Performing Teams, and Healthy Bottom Lines. BPS Books. https://books.google.com/books?hl=en&lr=&id=LUMiCwAAQBAJ&oi=fnd&pg=PP9&ots=EfMjUXWOT4&sig=E2SaIqh9l-1kI2q5NsUoScOveXw#v=onepage&q&f=false.
- Massey, D. S., & Denton, N. A. (1988). The dimensions of residential segregation. Social Forces, 67(2), 281–315.https://doi.org/10.1093/sf/67.2.281
- Minc, H. (1988). Nonnegative matrices. John Wiley & Sons.
- Newman, M. E. (2002). Assortative mixing in networks. Physical Review Letters, 89(20), 208701. https://doi.org/https://doi.org/10.1103/PhysRevLett.89.208701
- Taminciologlu, E., (2004). Back from the Brink. Workforce Management, December 2004 pp. 32-37. http://www.workforce.com/news/back-from-the-bri
- Tsai, W. (2001). Knowledge transfer in intraorganizational networks: Effects of network position and absorptive capacity on business unit innovation and performance. Academy of Management Journal, 44, 996–1004.
- Turner, M. E., & Prakanis, A. R. (1998). A social identity model of groupthink. Organizational Behavior and Human Decision Processes, 73(2–3), 210–235. https://doi.org/https://doi.org/10.1006/obhd.1998.2757
- Watts, D. J. (1999). Networks, dynamics, and the small-world phenomenon. American Journal of Sociology, 105(2), 493–527. https://doi.org/https://doi.org/10.1086/210318
- Yamaguchi, K. (2000, May). Power in mixed exchange networks: A rational choice model. Social Networks, 22(2), 93–121. https://doi.org/https://doi.org/10.1016/S0378-8733(00)00016-2