
ABSTRACT
What endogenous factors contribute to minority (Red Queen) or majority (Red King) domination under conditions of coercive bargaining? We build on previous work demonstrating minority disadvantage in non-coercive bargaining games to show that under neutral initial conditions, majorities are advantaged in high conflict situations, and minorities are advantaged in low conflict games. These effects are a function of the relationship between (1) relative proportions of the majority and minority groups and (2) costs of conflict. Although both Red King and Red Queen effects can occur, we further show that agents’ increased initial propensity toward conflict advantages majorities.
1. Introduction
Systemic patterns of discrimination characterize many populations with majority and minority groups. We can ask what endogenous features of interactions between these two groups contribute to the larger or smaller cohort being advantaged? Relevant characteristics of interactions are the costs of conflict and the relative proportions of the small and large groups.
Agent-based modeling of how these discriminatory norms arise and are sustained remains underdeveloped. James M. Sakoda (Citation1971) and Thomas C. Schelling (Citation1971) provided an early example of the power of such models to show how prejudicial outcomes can arise from individuals’ actions without any intended prejudice on the part of constituents. This model, called the checkerboard model of segregation, shows how agents’ slight preference to live by like neighbors results in a global pattern of segregation. Schelling’s approach exemplifies studying micro-motives to understand macro patterns of organization (Schelling, Citation1978; Epstein & Axtell, Citation1997).
Over the last decade, social scientists have adopted the Red King and Red Queen concepts from biology to analyze cultural patterns of discrimination. Replicator dynamics studies from evolutionary biology show that slower evolving species can gain advantage over faster evolving species in mutualistic encounters because they are slow to adapt (Bergstrom & Lachmann, Citation2003). Thus, the slower evolving species acts like a resolute bargainer who does not yield their position. Recently Cailin O’Connor (Citation2017, Citation2019) and Justin P. Bruner (Citation2019) used these results to develop an analogous thesis that a majority acts like a slower adapting species in a resource sharing game. The rationale is that members of the majority group have lower rates of exposure to interactions with minority group members, and hence more slowly learn effective responses. Minority individuals must adapt to the inertia of the majority and accordingly adjust their actions.
Evolutionary games and agent-based models are standard tools social scientists use to explain possible mechanisms by which norms and institutions arise (Axelrod, Citation1984, Citation1997; Sugden, Citation1986; Sugden, Citation1989; Gintis, Citation2007; Binmore, Citation2005; Skyrms, Citation1996; Guala, Citation2016). Yet until O’Connor’s (Citation2017), these models have focused on populations with one type of actor to draw wide-ranging conclusions about social conventions including social contracts. Developing a simulation with a Nash Demand game, O’Connor’s (Citation2017) goes beyond earlier research in concurring with the biological Red King effect to conclude that majorities gain the advantage in many everyday bargaining contexts. She further discovers that the Red King (majority domination) effect can shift to a Red Queen effect (minority domination) when the ratio of the low and high demands is large.
O’Connor’s (Citation2017) sets the stage for our investigation of majority versus minority domination under conditions of coercive bargaining characterizing a Hawk Dove game. Among mutualistic games with an element of conflict, Hawk Dove is favored among evolutionary game theorists to study two population dynamics (Bergstrom & Lachmann, Citation2003; Gao et al., Citation2015; Gokhale Chaitanya & Traulsen, Citation2012; Veller et al., Citation2017). Yet so far, two-population Hawk-Dove games have not been subject to agent-based modeling.
This paper develops an agent-based simulation to systematically analyze the endogenous conditions under which the Red King or Red Queen effects result. We consider coercive bargaining contexts in which the costs of conflict range from benign to extreme, and the relative proportions of the minority and majority groups range from equal to very unequal. Our simulations are designed to reveal the interdependence of the relative size of groups and the costs of conflict. Additionally we test for the sensitivity of models to the initializing conditions informing agents’ choices.
Our contribution is to provide a comprehensive mapping of when majorities and minorities tend to dominate under conditions of coercive bargaining as a function of (1) population proportions, (2) costs of conflict, and (3) the entire range of possible initialization conditions. We build on O’Connor (Citation2017, p. 4) which shows “why minority groups tend to be disadvantaged by norms and conventions of bargaining in many societies” to analyze the role that threats of harm can play in two-group populations, and the conditions under which minorities or majorities can be advantaged.
Section 2 provides a critical synopsis of previous pertinent results on the biological and cultural Red King-Red Queen effects. This motivates the development of our Hawk Dove Binary model with varying costs of conflict as opposed to the varying ratios of high and low demands analyzed by O’Connor (Citation2017). Section 3 describes the setup of the model and the outcomes of its simulations. Section 4 places these findings within the larger context of research on cultural evolution and discriminatory norms. Understanding the relationship between the costs of conflict, and whether minorities or majorities are likely to dominate, may offer us a critical tool for studying cultural evolution in settings from colonialism and apartheid to gender-based discrimination.
2. Motivation: previous research
Our research builds on existing literature to analyze the conditions under which majorities or minorities may gain the advantage. Bergstrom and Lachmann (Citation2003) pioneered using evolutionary replicator dynamics to study whether faster or slower evolving species may gain the advantage in mixed-motive games with the forms Nash mini-demand, Battle of the Sexes, and Hawk Dove. They countered the then-conventional wisdom in evolutionary biology that rapid adaptation provides an advantage. They conclude that, “contrary to the Red Queen hypothesis, slow evolution may actually lead to favorable outcomes” (Bergstrom & Lachmann, Citation2003, p. 597). Their reasoning is that the slower evolving species mimics the effects of “‘having one’s hands tied’ during the bargaining process” (Bergstrom & Lachmann Citation2003, p. 598).
Whereas researchers of biological evolution studying Red King effects with replicator dynamics have used Hawk Dove models (Bergstrom & Lachmann, Citation2003), Justin P. Bruner’s (Citation2019) and O’Connor’s (Citation2017) recent work on cultural evolution uses the Nash Demand game. Both games are characterized by multiple asymmetric equilibria in which one or the other player is advantaged. The two-person, two-strategy payoff matrix in represents a generalized mixed motive game (Bergstrom & Lachmann, Citation2003; O’Connor, Citation2017). For the case of 1 < x < 2 the payoff matrix represents a Hawk Dove game. When x = 1 this is a mini Nash Demand game. When x < 1, this is a coordination game.
Table 1. Payoff table for a two-player, two-strategy, mixed-motive game.
Table 2. Nash Demand Game.
Replicator dynamics models have been developed to simulate cultural systems of evolution by correlating faster evolution with a minority group and slower evolution with the majority group. This treatment follows because members of a minority group will on average have many more encounters with majority group members, thus adapting more quickly to their actions. Bruner (Citation2019) builds on work completed by Skyrms (Citation1996) and Skyrms and Zollman (Citation1996) using a mini-Nash Demand game to show that two-group populations end up at one of the possible asymmetric equilibria. In these games, agents achieve efficient, although inequitable outcomes, when they play against outgroup members. Bruner constructs models using replicator dynamics to test whether majorities or minorities have the advantage in the mini-Nash Demand game. He finds that neither group is systematically advantaged when population sizes are equal, but that when one group is a minority, members of that group tend to be disadvantaged. This disadvantage grows as the relative size of the minority decreases (Bruner Citation2019, 419).
Seconding Bergstrom and Lachmann (Citation2003), Bruner concludes that in this cultural evolution setting, in which minority status is analogous to the faster evolving group, “this ‘cultural red king effect’ tilts the scales in favor of the majority by pushing play toward the minority disadvantage equilibrium” (Citation2019, 420). Bruner tests the robustness of his result using a best-response dynamics simulation. He found no Red King or Red Queen effect because in this simulation, individuals’ strategies were best-responses to the average of outgroup play in every round (Citation2019, 423), which conveyed no advantage to either group.
O’Connor (Citation2017) tests the robustness of Bruner (Citation2019) by adopting Axtell et al.’s (Citation2001) agent-based model design using the Nash Demand game. O’Connor adds to Axtell’s experimental design by simulating bargaining among majority and minority groups. Axtell et al.’s (Citation2001) showed how given Nash demand offers of 4, 5, or 6, over repeating reactions among outgroup members, one of three states emerges: an asymmetric equilibrium, a fair division equilibrium, or a fractious state in which offers are mismatched (Axtell et al., Citation2001 p. 198. They conclude that, “various kinds of social orders – including segregated, discriminatory, and class systems – can also arise through the decentralized interactions of many agents” (Axtell et al., Citation2001, p. 205). Asymmetric norms signify that discriminatory treatment results in outcomes favoring members of one group.
O’Connor brings to Axtell et al.’s framework the consideration of shifting the relative size of the majority and minority groups to assess whether the Red King or Red Queen effects are observed in the Nash Demand game (). Her population size, N is 10, 20, or 100. The proportion of the majority spans n1/N = 0.5, 0.6, 0.7, 0.8, 0.9. She considers a broad set of Nash demand offers with a Low offer of L = 1, 2, 3, 4, and 4.5, with the Low and High offer such that L + H = 10. The agents have memory lengths varying from m = 2, 5, 7, 10, or 20. Each specific simulation was run for 2000 times, with each run resulting in one of both groups always demanding 5, or one demanding High and the other demanding Low (O’Connor, Citation2017, p. 11).
O’Connor tests for robustness against varying memory length and a nonnegligible error parameter. Her contribution is to show that while the Red King effect holds for low offers of 3 and 4, the Red Queen effect takes over for low offers of 1 and 2. She varies the parameters of game structure, memory rate, error, and the proportion of the minority versus majority ranging through 0.1 to 0.9. She concludes that “the results described in previous replicator dynamics models are robust across the modeling changes made” in her simulations (O’Connor, Citation2017, p. 13). Whereas Bruner’s replicator dynamics simulation aggregates outcomes given a random sample of initial first moves,Footnote1 in her agent-based model, O’Connor identifies a coin toss (O’Connor, Citation2017, pp. 10–11, fn 12).Footnote2 O’Connor tests additional initial conditions likely to impact whether Red King or Red Queen effects result (O’Connor, Citation2017, pp. 16–19). She has actors play High (as opposed to Low) with a probability of α in their first outgroup encounter. O’Connor’s baseline model shows that a shift occurs with Red Queen holding for offers of Low equal to 1 or 2, and Red King holding for Low offers of 3 and above. She finds that raising actors’ propensity to play High advantages the majority. She also tests for the impact of introducing a discriminatory norm at the onset, leading actors to initially play High against outgroup actors. Overall these findings indicate that minorities are systematically disadvantaged, aside from in Nash Demand games with a very low value for Low.
, below, specifies the progressive development of replicator dynamics and agent-based models to study the outcomes of multi-agent interactions in Prisoner’s Dilemma (PD), Nash Demand, and Hawk Dove. The table shows that PD and Nash Demand have received focused attention from modelers using both replicator dynamics and agent-based modeling, while Hawk Dove has been simulated using only the former. Research using PD has shown how cooperative play can emerge (Axelrod, Citation1984), and also how systemic discrimination can emerge in two group populations (Hammond & Axelrod, Citation2006). Mutualism among species, modeled with mixed-motive games including Hawk Dove, has received an abundance of attention (Bergstrom & Lachmann, Citation2003; more recently Veller et al., Citation2017). With respect to analyzing cultural evolution using agent-based modeling, research studying mechanisms of discrimination has mainly used the Nash Demand game (Axtell et al. Citation2001; Bruner, Citation2019; O’Connor, Citation2017). Bruner and O’Connor compare their replicator dynamics models with agent-based models to test for the robustness of the results.
Table 3. Development of Prisoner’s Dilemma, versus Two Population Nash Demand and Hawk Dove Games.
Our research using agent-based models of the Hawk Dove game enables us to develop tools to further understand the cultural evolution of discriminatory norms under conditions of coercive bargaining with various threat points. We use the variable payoff matrix in (below) where V is the value of some resource available, and shared between two players when they cooperate (both play “Dove”). C is the cost of conflict they jointly incur when they both play “Hawk.” The ratio of the reward to cost (V/C) defines the Mixed Strategy Nash Equilibrium (MSNE) of each game and specifies the probability of Hawk play (p) and Dove play (1-p) for the mixed strategy equilibrium. This means that for an agent with expectation p that their outgroup opponent will play “Hawk,” the best response is “Hawk” if p < V/C, and “Dove” if p > V/C. If p = V/C, the agent will choose between moves randomly, and play “Hawk” with probability 0.5. We test the model’s sensitivity to agents’ initial decision rules with both illustrative cases and by comprehensive tests.
Our paper investigates the Red King and Red Queen effects for two populations playing Hawk Dove integrating the factors considered by Bruner (Citation2019) and O’Connor (Citation2017) in our model: varying population ratios, and varying initial decision rules for first contact with outgroup actors. Where Bruner and O’Connor vary the degree of asymmetry of the potential conventions by considering a range of Low and High demands, we instead maintain the same asymmetric payoffs of V, 0 for Hawk Dove play throughout our simulations and instead vary the costs of conflict when both actors play Hawk. We seek to understand the conditions under which minorities and majorities are systematically advantaged or disadvantaged by providing a comprehensive analysis of this modeling environment, including evaluating the impact of the entire field of potential decision rules for agents’ initial outgroup encounters.
3. Hawk-Dove Binary Model and Results
Here we describe an agent-based model designed to investigate factors behind the emergence of social discrimination. For the reasons given above, we focus on the Hawk-Dove Binary game (HDB), where previous contributions have employed the Nash Demand game (Axtell et al., Citation2001; Bruner (Citation2019); O’Connor, Citation2017) and Mutualism (Bergstrom & Lachmann, Citation2003), and our agents adapt by a form of belief learning (Axtell et al., Citation2001; Brown, Citation1951; Fudenberg & Levine, Citation1998), rather than being subject to evolution by a genetic algorithm. We have a finite number of agents, using stochastic processes to determine pairings for social encounters, and best-response rationality in a coercive bargaining setting with varying costs of conflict and varying relative group size. All experiments are dedicated to understanding the conditions under which minority or majority dominance is likely to occur.
Section 3.1 describes our experimental set up. Section 3.2 reports our findings for our baseline game, where actors on their first encounter with an outgroup actor play the MSNE, and thereafter, for later outgroup encounters, play their best response given the expectations derived from their memories of outgroup opponents’ play. Both O’Connor (Citation2017) and Bruner (Citation2019) present different mechanisms for determining actors’ initial outgroup moves, and so we investigate theirs and several alternatives. Section 3.3 reports our findings for an exploratory set of other initial conditions. Section 3.4 extends this examination across the whole parameter space. For each method for opening outgroup play, we can give a different reason for thinking it a plausible representation of real human micro-level behavior. Some of these methods then lead to similar outcomes, but others do not. We conclude by spelling out what this might mean for explaining social discrimination using agent-based models.
3.1. Hawk Dove Binary Model (HDB) of Discriminatory Conventions
Axtell et al. (Citation2001) established the benchmark model presented in “The Emergence of Classes in a Multi-Agent Bargaining Model.” This research builds on Young (Citation1993a) and his evolutionary bargaining model (Young, Citation1993b). Its method of determining agents’ behavior, by playing a best-response to their expectations based on past memories of opponents’ moves, is also found in Fudenberg and Levine (Citation1998), and known as belief learning, or “fictitious play” (Berger, Citation2007; Brown, Citation1951). Since we focus on the binary (two-group) game of Hawk Dove, we will denote each version of our model by HDB.
In our model, social interaction events are represented as one-round matches of the Hawk Dove Binary (HDB) game. A population of agent players is divided into two groups, Blues and Reds, of variable relative sizes, n1 and n2, with the population size fixed at N = n1 + n2 = 200 agents. The percentage of agents in the Reds group, PR = 100 * n2/N, will become an experimental factor and define the extent to which the Reds group is a majority or a minority. Opportunity for the emergence of discrimination is provided by a given number of time steps, T. In each time step, all players are put into random pairs to play exactly one match each. For each agent participating in a match, their opponent will either be from the same group as them (an ingroup opponent), or from their outgroup.Footnote3 Both participants know each other’s group color, and hence whether this is an ingroup or outgroup interaction. They can thus use this information in determining how they then behave in the match, and they add memories of each outgroup match at the end of every round of interaction to calculate their later behavior.
Agents use best-reply calculations based on their memories of the frequency with which outgroup agents played Hawk to determine whether playing Hawk or Dove offers the highest expected payoff. If an agent’s possible moves share the same expected payoff, making the agent indifferent between “Hawk” and “Dove,” the actual move is randomly sampled with even chances (“coin flipping”).Footnote4
For each Hawk-Dove game experiment we test the outcome as a function of varying population proportions, with PR ranging from 10% to 90% by 10% intervals. We ran all experiments for the range of Hawk Dove games represented by very high to very low cost of conflict, C, while holding constant the value of cooperation, V. We defined these games according to their reward to cost ratio (V/C), which for the Hawk-Dove game is the mixed strategy Nash equilibrium (MSNE). This was altered by 0.1 intervals from MSNE = V/C = 0.1 to V/C = 0.9.Footnote5
Agents begin the simulation with no memories of past outgroup matches to draw upon for their expectations. This raises the question, how should model agents determine their opening play in an outgroup match, when they have no expectations to respond to? In our first experiment (HDB-1), we assumed such empty-memory agents played the MSNE, i.e. they randomly sampled their move, playing Hawk with probability = MSNE = V/C, and Dove otherwise. When both participants play this, it gives neither initiator nor opponent an advantage, and thus represents initial neutrality on the part of agents toward their as yet unknown opponents’ behavior.Footnote6 We used this as our baseline experiment to map the entire field of high to low-cost games simulated with the entire range of PR, the percentage of the population in the Red group. Sections 3.3–3.4 test sensitivity of model outcomes to alternative mixed strategies of play in the empty-memory, initial outgroup moves.
For our first experiment, we simulated a population of N= 200 agents interacting for T= 2000 rounds (time steps), or less if the population had already converged on a dominance outcome. We varied the proportion of agents in the Red group, PR, between the values 10% to 90%, in 10% steps. For the payoffs table, we fixed the Value parameter, V, to 10, and varied the ratio between Value and Cost of Conflict, C, from 0.1 to 0.9 in steps of 0.1. Thus, we test 9 * 9 = 81 combinations of these parameters. For the simulations in 3.2 and 3.3 we used 2000 runs for each experiment. However, patterns in model outcomes were apparent from far fewer numbers of runs. Hence, for the simulations in 3.4 (HDB-6,-7,-8), where we explore a further 11 * 11 initial outgroup mixed strategy parameter combinations, we used 100 runs for each unique test configuration in order to achieve our comprehensive results.
An exact method for identifying whether a simulation run has converged on one group dominating the other is to test whether all players in one group have expectations of Hawk play < MSNE = V/C, while all players in the other group have expectations > MSNE. When this arises in a round, the players in the former group will all play “Hawk,” while those in the latter group all play “Dove.” Thus both groups confirm their opponents’ beliefs. With no noise to disrupt their playing of best responses, their respective beliefs will now no longer be capable of re-crossing the V/C divide which would permit a reverse in which group dominates. The former group’s dominance over the latter is now permanent. This method then is definitive. In experiments with 200 agents, most simulation runs took less than 500 runs to meet this definition. See Appendix A for an example parameter combination. However, in practice we found two heuristic methods that yielded reasonably accurate predictions from a much smaller number of rounds, as also detailed in this appendix.
To obtain robust statistics from experiments we tried averaging 2000 repeated runs for each parameter combination. However, the main patterns we identify in the results below were all apparent after 100 runs.Footnote7
summarizes the parameters of the model. Experiments will vary the relative proportions of the groups, the cost of conflict, and the methods used for the opening, empty-memory outgroup moves.
Table 4. Hawk Dove game with variable rewards V and cost C.
Table 5. The main parameters of the model.
Table 6. Decision Rules.
3.2. Results: Baseline model with MSNE Best Reply Initialization (HDB-1)
We began testing our model described in section 3.1 with the MSNE best-reply initialization. That is, in their first outgroup matches, when they lack memories of past interactions to determine their best reply, agents play the MSNE: they play “Hawk” with probability MSNE = V/C, and “Dove” otherwise. , below, is a heat map of the whole field of data reflecting the relative frequencies of the Red group dominating during 2000 simulation runs for each of 81 parameter combinations.
Figure 1. Heat map of HDB-1, MSNE initialization.
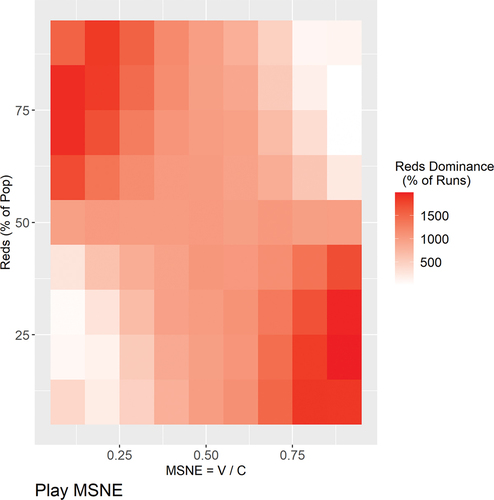
The horizontal axis represents the MSNE defining a specific measure of costs for each game setup. The MSNE, V/C, ranges from 0.1 to 0.9 in steps of 0.1. Given that V = 10, when C = 20, the MSNE is 0.5, the midpoint of this axis. Note that the MSNE increases as the cost of conflict, C, decreases. So, e.g., C = 11.11 for MSNE = 0.9 probability of initial Hawk play. The vertical axis represents PR, the percentage of the population which are in the Red group, with the percentages tested ranging from PR = 10%, 20% …, 90%. So Reds are in the majority for the upper rows, in the minority for the lower rows, and neither majority nor minority when PR = 50%. Each tile in the shows the proportion of simulation runs in which Red group came to dominate by playing “Hawk” against the Blues’ “Dove” (represented by the color coding of red for Red dominance, and white for Blue dominance). Appendix B contains pie shop charts from the same experiment, but records the relative percentages of Red dominance (labeled red), Blue dominance (labeled blue), and no convergence within the first 250 rounds (colored green).
The heat map for HDB-1 () concurs with intuition in two ways, and the pie shop chart (Appendix B) concurs with an additional insight.
First, for all MSNE or V/C values, when the majority and minority ratio was 50% N, it was equally likely that Reds or Blues dominated. When there is no difference in group size between the two populations, no parameter in our model conveyed an advantage to either group (which is true for our simulations HDB2-7 below).
Second, for values of MSNE = 0.5, there is also an even likelihood of Red or Blue dominating for all population proportions from PR = 10% to 90%. This is intuitively plausible because, in about 50% of simulation runs, the faster-adapting group will experience, completely by chance, “Hawk” in slightly more than 50% of the initial moves, and in the other runs it will experience slightly fewer than 50% “Hawk.”
Third, for the MSNE = 0.9 probability of Hawk play when V/C = 0.9, it takes longer for either group to dominate, whereas for all other V/C levels, dominance is virtually guaranteed to occur with 250 runs. This can be viewed in the Pie Shop chart for HDB-1 in Appendix B. This lack of convergence within 250 rounds intuitively follows because as the Hawk Dove game tends toward Prisoner’s Dilemma (with no costs of conflict), we expect all actors to play Hawk, and no group to dominate the other. Costs are low and hence repeating rounds of play do not accrue statistically decisive advantage or disadvantage for risking conflict. With more rounds per simulation run, we found that even in the case of MSNE = 0.9 Hawk, eventually an asymmetric equilibrium arose in all cases.
In analyzing the data, other properties of the set of functional relationships, between relative population proportions and the intensity of conflict, become apparent. The Red King effect is evident for higher costs of conflict. In the left-most column, representing the MSNE = 0.1 probability of Hawk play, it can be very costly to play Hawk, with a value of 100 cost for conflict. Here the MSNE initialization means playing Dove with p = 0.9. In this case the minority actors quickly adjust and learn to play submissively against the majority. The Red King effect holds systematically, until the costs of conflict tend toward a MSNE defining the game of a probability of Hawk play of 0.4, and a cost of conflict of 25. Still here the majority is more likely to dominate, but not with certainty.
We see that there is an inflection point in the heat map HDB-4 along the vertical column defined by V/C = 0.5 which separates the Red King and Red Queen effects. Also, in HDB-1 () we see that only the corners reflecting relatively smaller minorities and bigger majorities, as well as very high- and low-cost games, decisively demonstrate the Red King and Red Queen effects. For this MSNE initialization, the Red King effect reflects that majorities dominate for high-cost games, and the Red Queen effect reflects that minorities dominate for low-cost games, with the single inflection point at the center point of a value of 20 for costs. This vertical inflection axis at V/C = 0.5 is an important feature of this functional space because it shows that for this ratio of reward (V) to costs of conflict (C), neither the majority nor the minority is advantaged.
3.3 Results: HDB-2, HDB-3, HDB-4 with expect all Dove, expect all Hawk, and 0.5 Hawk initialization; HDB-5 expect 0.5 Hawk
We next ran our experiment for numerous distinct initialization conditions to test the sensitivity of our model to agents’ choice of first moves against outgroup members. HDB-2 and HDB-3 are extreme cases in which in the first, all agents expect outgroup members to play Dove, and thus themselves play Hawk. In the second, all agents expect outgroup members to play Hawk, and thus play Dove. These cases can be thought of in analogy to the corner cases in replicator dynamics experiments in which all agents play Hawk in one corner, and all agents play Dove in the other corner (Clark, Citation2017). After discussing this case we present the results of HDB-4 and HDB-5. In HDB-4 agents play Hawk with 0.5 probability in their first move with outgroup agents, the initialization most resembling the baseline neutral initialization of O’Connor (Citation2017). In HDB-5, agents react to the expectation that the outgroup actor will play Hawk with a probability of 0.5. It was motivated to understand the impact on Red Queen/Red King effects resulting from playing with even odds of Hawk and Dove, and reacting to this expectation. See, for decision rules.
We present the heat maps for HDB-2 and HDB-3, react to the expectation of all Hawk and all Dove below in and .
Figure 2. Heat map of HDB-2, expect dove initialization.
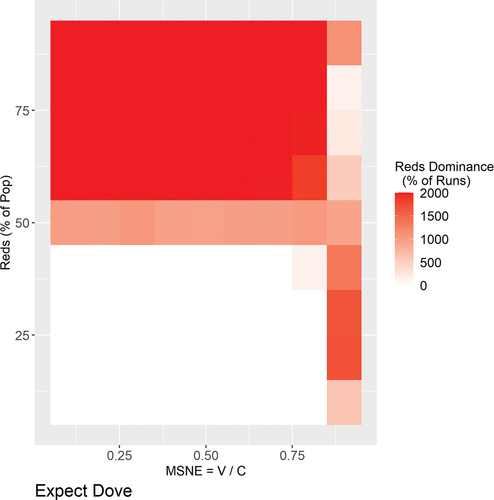
Figure 3. Heat map of HDB-3, expect Hawk initialization.
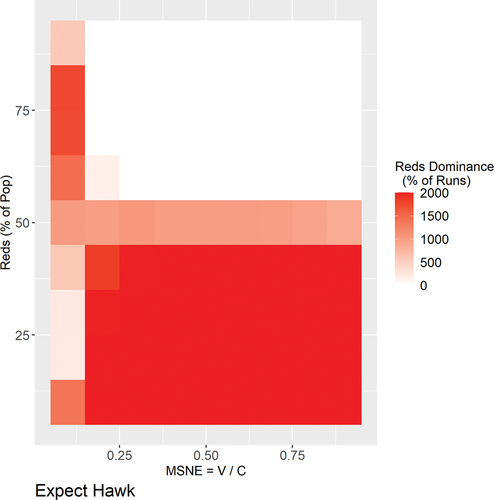
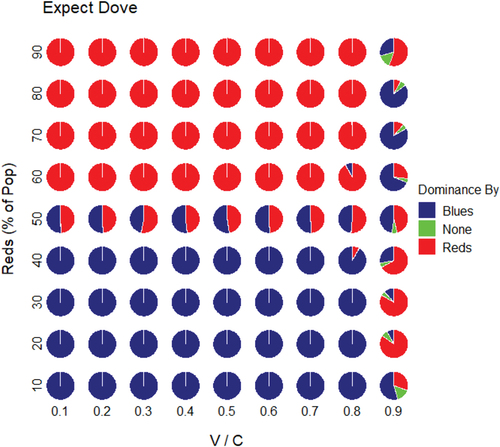
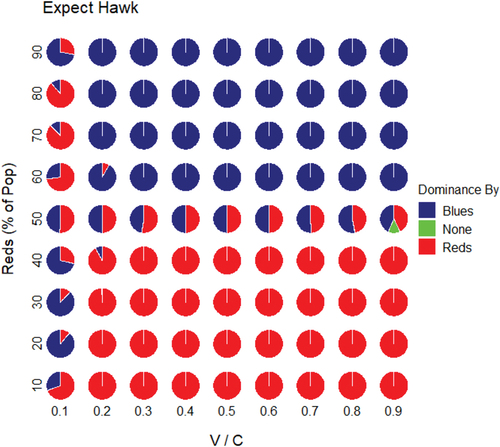
On visual inspection of and , it is immediately apparent that the two heat maps are rotated by 180 degrees from each other. Interpreting HDB-2 first, when all actors play strategically against expected Dove play and hence engage members of the other group aggressively, the clear result is for majority dominance, except for in the case of extremely low-cost games of C = 11.11 and the MSNE probability of Hawk play is 0.9. In HDB-3, when all actors expect aggressive play and hence first engage members of the other group cooperatively, the clear result is for minority dominance, except for in the case of extremely high-cost games of C = 100 and the MSNE of Hawk play is 0.1. In this case the majority dominates. When we incorporate the consideration of the percentage of runs that did not converge within 250 rounds of play, we can see in the Appendix B, the pie shop charts for HDB-2 and HDB-3 show that convergence to either Red or Blue dominance was consistently achieved except for in the former with V/C = 0.9.
These two experimental runs provide several insights. First, we can make an analogy to initiating play in one of the two corners of all-Hawk play and all-Dove play in replicator dynamics. In that case, all-Hawk play leads to the favorable equilibrium for the slowly evolving species (Red King), and all-Dove play leads to the favorable equilibrium for the rapidly evolving species (Red Queen). For all experimental configurations, except for the high-cost games in HDB-2 and the low-cost games in HDB-3, the initialization resulted in the same tendency, but in these two exceptional cases the majority benefited from an all-Hawk first act in expectation of Dove (HDB-3), and the minority from all-Dove first move in the expectation of Hawk (HDB-2). The differing results for the high-cost game in HDB-2 and low cost in HDB-3 are striking. We can see that not only the varying population proportions tested against the range of costs of conflict are important for the outcome of these simulations.
Additionally, the initialization condition specifying the rule for agents’ first moves is also a crucial factor in the outcome of which group is more likely to dominate. This can also relate to actual first encounters among members of differing populations, whether they begin on a cooperative or hostile note. Since we can deduce that beginning any game with all the members of group 1 playing Hawk and all the members of group 2 playing Dove will perpetuate into a lasting asymmetric equilibrium favoring group 1, it is interesting to note how other rules for initiating contact besides those studied in HDB-2 and HDB-3 result in different outcomes for whether majorities or minorities tend to dominate (see HDB-7, below).
We next examine the results form HDB-4 and HDB-5. These also result in dramatically different patterns of dominance. The heat maps are below in . HDB-4 initiates with randomized choice with 0.5 probability of Hawk play for all configurations of the experimental set up.Footnote8 This set of simulations resulted in the most distinct pattern with symmetrical lines of inflection at the mid-point defined on both the horizontal and the vertical axis. In this case majorities decisively dominated for high-cost games (V/C < 0.5), and minorities for low cost games (V/C > 0.5). We can interpret these results to show that for high cost games, playing Hawk with 50% chance is an overly aggressive strategy, and it makes sense that it resembles the left half of HDB-2 in which the majority dominates when it plays aggressively. For low cost games, playing Hawk with 50% chance is an overly dovish strategy. This portion of the heat map for V/C > 0.5 resembles the right half of HDB-3, expect all-Hawk. In these cases minorities dominate when the first rule of contact for all actors errs on the side of being overly cooperative. In fact, in HDB-4, 0.5 Hawk initialization it is striking that playing Hawk and Dove with equal likelihood is sufficient to reflect a pattern as definitive as that resulting for all Hawk or all Dove play in HDB-2 and 3, whereas for the MSNE initialization in HDB-1 , the dominance outcomes show a less pure pattern of results.
Figure 4. Heat map of HDB-4, play Hawk with 0.5 probability initialization.
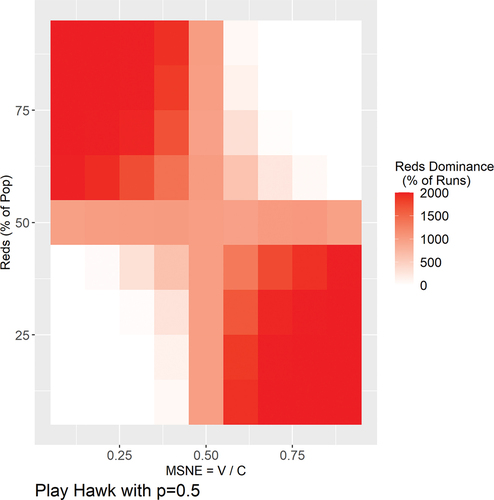
Figure 5. Heat map of HDB-5, react to probability of 0.5 Hawk initialization.
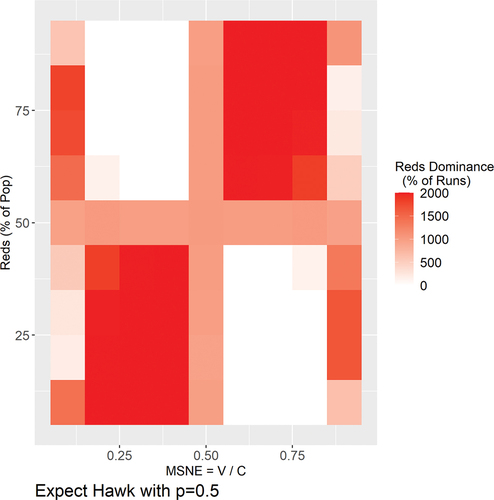
Our final test simulation in this series had the initializing rule of reacting to the expectation of 0.5 probability of Hawk play (see, ). Reacting to these probabilities reverses the overly aggressive and cooperative play characterized by the decision rule in HDB-4. We see that the Red King and Red Queen effects are similarly inverted across the horizontal line reflecting group 1 and group 2 both being 50% of the total population. Here there is a decisive Red Queen effect for high-cost games of the MSNE = 0.2 to 0.4. As well, there is a decisive Red King effect for low-cost games of the MSNE = 0.6 to 0.8. For the extremely high- and low-cost games of C = 100 and C = 11.11, the pattern resembles the “react to all Hawks” (HDB-3) for the high-cost games, and “react to all Doves” (HDB-2) for the low-cost games. We see a further analogous pattern to HDB-2 and HDB-3. We can see that best-reply dynamics reflecting a cultural expectation of the outgroup’s first move leads to minority dominating for high-cost games and vice versa. The explanation is that anticipating neutral play in high-cost games results in a cautious and cooperative best-response favorable to minority actors in high-cost games, and the opposite in low-cost games.
3.4. Why initial play matters
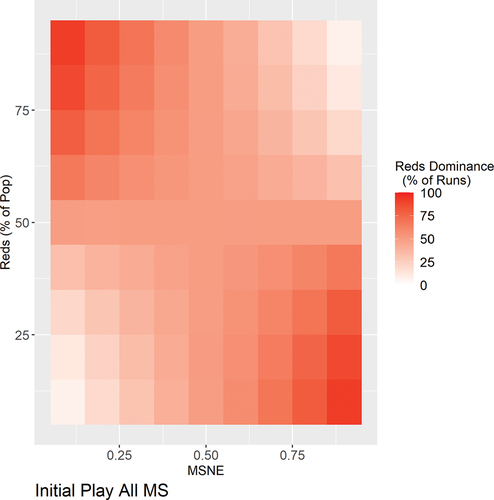
Here the two sets of simulations (HDB-6 and 7) are designed to reflect Bruner (Citation2019) and O’Connor (Citation2017) with respect to the former’s random sampling of all points on the replication dynamics simplex of initialization conditions, and the latter’s simulations assessing the impact of increasing agents’ propensity for aggressive High demands. In the heat map for HDB-6 (), each tile on the 9 × 9 matrix represents the aggregated outcome for the specified V/C value reflecting initial Hawk play on the horizontal axis, and the populations of Red (population 2) actors on the vertical axis. For their replicator dynamics models, Bruner (Citation2019) and Cochran & O’Connor (Citation2019) randomly sample initial proportions uniformly across the whole simplex of possible values. To ensure even distribution of proportions while keeping low the number of simulation repetitions required, we instead ran 100 simulation runs (for up to 2000 rounds each) for each proportion in {0, 0.1, …, 1}. The % Red and the MSNE were varied as in previous experiments. shows the results by % Red and MSNE, aggregated over the various initial mixed strategy proportions. The same patterns of majority and minority dominance appear as before (HDB-1), though away from the center and the four corner cells, the exact frequency of Red dominance varies slightly from previous figures. What this implies is that someone may be uniformly uncertain about the two groups’ initial mixed strategies, and yet expect the same majority or minority dominance outcomes as are expected to result from initial MSNE play. More generally here, as in HDB-4 (play Hawk with p = 0.5), Red King occurs for high-cost games and Red Queen for low-cost games. However, the pattern in is less stark, and more resembles the MSNE initialization.
Figure 6. HDB-6: Aggregated results from running simulation with various initialization mixed strategies, HDB-6.
Our next series of simulations, HDB-7, is presented below. In this series we experimented with Blue and Red actors playing their own ratio of mixed strategies. Here each grid on the map represents the likelihood of Hawk play with Population 1 (Blue) on the horizontal axis and Population 2, Red, on the vertical axis. There are a total of 5 × 5 individual heat maps with the encompassing horizontal axis representing the MSNE (V/C) for each sub-simulation, and the encompassing vertical axis representing the proportion of Red actors, PR, and b representing the likelihood that Blue players on average play Hawk, and r representing the likelihood that Red players on average play Hawk. The heat map for (b = 0.5, r = 0.5) is familiar to us already from HDB-4 with 50% randomization, with its clear pattern of majority dominance for high-cost games and vice versa. We recognize HDB-2, expect all Dove, and all actors play Hawk in the top right corner with the majority dominating; and we recognize HDB-3, expect all Hawk and all actors play Dove in the bottom right corner with the minority dominating. But the symmetries disappear from the heat maps as we consider cases in which Blue and Red actors play different mixed strategies. The top left corner represents Red always playing Hawk and Blue always playing Dove with Red automatically dominating (and vice versa for the bottom right corner).
appears to convey that minorities and majorities have an equal likelihood of dominating. This is relevant considering the diagonal line from the bottom left corner, representing that the minority dominates when all begin playing cooperatively, and the top right corner, representing that the majority dominates when all play aggressively. However, our next depiction of our comprehensive data in shows how both minorities and majorities are advantaged by increasing the aggressiveness of initial contact. This is presented in .
Figure 7. HDB-7: Each heat map in the grid results from groups playing a different mixed strategy, with b the mixed strategy played by Blues, and r that by Reds.
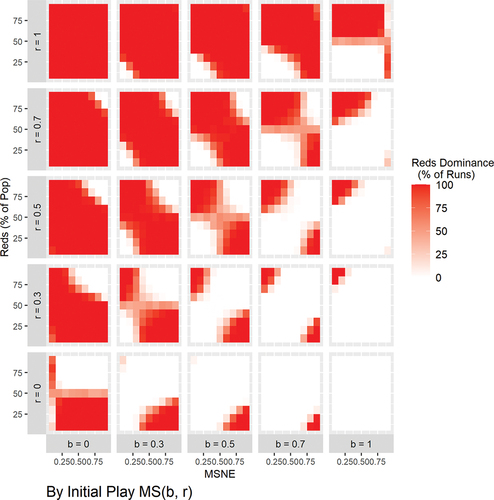
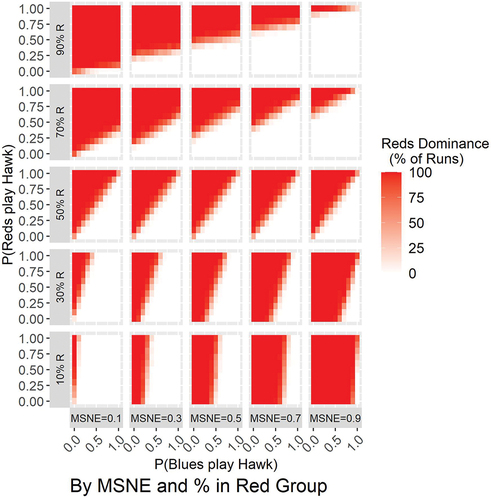
Figure 8. The same data as is redisplayed in an alternative grid of heat maps. Mixed strategy proportions b and r become the x and y values within each heat map, while MSNE and % in Red Group become the grid’s horizontal and vertical headings.
Consider the overall implications of our findings. We have assumed our players are rational decision makers, but so highly myopic that they cannot calculate beyond the best response for their next interaction. However, by this stage of this paper, regardless of the epistemic uncertainty for individual agents of how best to initiate contact against outgroup actions, we have provided the characteristics of dominance outcomes as a function of costs of conflict, population proportions, and initial decision rules. Hence, there is an ontological reality of how minority and majority dominance follows from particular values of MSNE and relative group size, as a function of varying initial decision rules. What follows from this God’s eye knowledge?
re-displays our experiment data set in an alternative grid of heat maps. This time the mixed strategy proportions b and r become the x and y values within each heat map, while the MSNE and % in Red Group become the grid column and row headings respectively. It is clear that, in every heat map, the line dividing the block of Red-dominance cells from the block of Blue-dominance cells (i.e. white cells) is always positive in slope. This means that irrespective of the MSNE (V/C) or the proportion in the Red Group (PR), the Red group could always have had a better outcome if it had started more aggressively, i.e. have had a higher value of r. Parallel reasoning applies to the Blue group. Hence, whether they are minority or majority actors encountering outgroup actors, all groups would have benefited from initiating contact with outsiders more aggressively. Finally, consider the slopes of the dividing lines, and when they are less than or greater than 1. If both groups increase their initial hawkishness by the same amount, the Majority group tends to benefit most.
4. Discussion
Economic theories of discrimination (e.g., Becker, Citation1957) argue that market efficiencies will equalize opportunities in the job market as employers find it cost-effective to hire underpaid minorities. However so far free market societies still exhibit discriminatory patterns based on ethnicity and gender. Alternative theories of discrimination point to outgroup prejudices to explain systemic patterns of differential treatment and disadvantage (Leonardelli & Brewer, Citation2001). Policy remedies look to countering implicit biases and negative stereotypes, yet discriminatory patterns remain recalcitrant. It remains unclear that these explanations and remedies are sufficient to understand and address systemic discrimination.
We expand the results of O’Connor (Citation2017) and Bruner (Citation2019) who show how (a) demarcation into two groups with associated memories, (b) best-response action, and (c) minority status, together are sufficient conditions to give rise to discrimination under conditions of normative bargaining. We focus on situations of winner-take-all conflict in which resulting unequal conventions strip disadvantaged groups of bargaining power and burden them with costs for challenging the status quo. These situations are relevant to societies with apartheid conditions, or cultural norms banishing members of one group from practices such as education or property rights. We show how the costs of conflict, whether negligible or extreme, establish conditions under which we can predict majority or minority advantage as a function of initial contact rules: Red King occurs under conditions of high cost of conflict situations and Red Queen with low cost of conflict situations, if actors adopt neutral initial action rules.
Our simulations show that minorities can in some circumstances obtain the advantage, however they are dependent on majorities initially playing either neutrally or cooperatively. We further show that actors in both groups, minorities or majorities, benefit from hawkish initial play. However, aggression most benefits majorities who can secure the advantage both from hawkish initial encounters, and from elevated costs of conflict. Our stochastic rational-response model of discrimination shows why aggressive outgroup norms could have been historically rewarded over millennia of cultural evolution. We also show why countering discrimination may require addressing the fact that given efficient yet asymmetric coordination, most often majorities can reap considerable resource advantages through these microlevel patterns of conflict-acceptant interaction.

Acknowledgement
The authors wish to thank David Plotke, Peter Galison, Shaun Hargreaves Heap, Margaret Levi and Cailin O’Connor for abiding support of this research, as well as the participants in seminars held by the Centre for Philosophy of Social Science (TINT), University of Helsinki; CASBS, Stanford University; Berggruen Institute; Dept. of Communications and Networking, Aalto University; and Centre for Research in the Arts, Social Sciences and Humanities (CRASSH), University of Cambridge, for their contributions to this research.
Disclosure statement
No potential conflict of interest was reported by the authors.
Additional information
Funding
Notes
1 Bruner runs his simulation 2000 times to test outcomes based on sampling randomized initial strategies played by each group in the population. Thus Bruner’s result assumes epistemic uncertainty of what the population’s initial proportion of moves (Low, Medium, High) will be, and provides an aggregated result of whether Red King or Red Queen effects occur as a function of sampling initial moves over the entire simplex.
2 We were unsure whether this “coin toss” referred to having agents play High with p = 0.5 and Low with p = 0.5, or whether there was an evenly split likelihood that agents play High, Medium or Low in their first move against an outgroup actor.
3 Since our interest is in actors’ tendency to discriminate against outgroup actors, and following the literature, we only represent outgroup interactions. Ingroup interactions are assumed to play no role in discriminatory outcomes, and do not affect model output metrics.
4 We also tested resolving ties by playing the MSNE instead of a mixed strategy with parameter = 0.5. Recall that if the two moves offer the same expected payoff, then all mixed strategies do too, but they differ in the rates at which they input “Hawk” and “Dove” events into players’ memories. In the experiments that follow, resolving ties with MSNE instead of unbiased coin flipping made no discernible different to the output.
5 For comparison with O’Connor (Citation2017), she varied the population of the majority from 50% to 90% of N by 10% intervals; and her simulations tested for rewards to Low demands of L = 1, 2, 3, 4, and 4.5, while holding constant the total reward value of L + H = 10. A three-option Nash Demand game does not have a single-parameter MSNE, but its binary version, which omits the Medium demand move, would have an MSNE = 1 – L/H probability to play High.
6 Note the difference here from replicator dynamics models in which playing the MSNE is a point attractor and therefore in a deterministic, equation-based model, there will no convergence to either group dominating.
7 For a further indication of the reliability of our experimental results, the model was implemented three times, each time in a different programming environment. The first version was developed, by a commercial programmer to a specification by S. M. Amadae following Axtell et al. (Citation2001) and O’Connor (Citation2017), in the functional programming language, F#. A second version was developed independently by C. J. Watts using Axtell et al. (Citation2001) and Bergstrom and Lachmann (Citation2003) as its primary sources, in the agent-based modeling package, NetLogo 6.1.1. To verify this NetLogo version, a third, small-scale (10 agents) version was made as an Excel spreadsheet by C. J. Watts. Codes for the three models have been published on the website github.com. The F# version is at https://github.com/flowa/amadae-hawk-dove-binary-model. This version can be run from a web browser by going to https://flowa.github.io/amadae-hawk-dove-binary-model/The NetLogo and Excel versions, and data analyses from experiments are at https://github.com/innovative-simulator/Evolving-Game-Players.
8 This experimental set up is analogous to O’Connor (Citation2017) in that our model randomizes initial Hawk and Dove Play evenly with 50:50 odds, and O’Connor samples according to an even random selection among the three options of Nash Demand (determined from an inspection of her programming code).
References
- Axelrod, R. M. (1997). The complexity of cooperation : agent-based models of competition and collaboration. Princeton UP.
- Axelrod, R. (1984). The Evolution of Cooperation. Basic Books.
- Axtell, R. L., Epstein, J. M., & Peyton Young, H. (2001). The emergence of classes in a multiagent bargaining model. In S. N. Durlauf and H. P. Young, (Ed.), Social Dynamics, 27, 191–211.MIT Press.
- Becker, G. S. (1957). The Economics of Discrimination. University of Chicago Press.
- Berger, U. (2007). Brown’s original fictitious play. Journal of Economic Theory, 135(1), 572–578. https://doi.org/10.1016/j.jet.2005.12.010
- Bergstrom, C. T., & Lachmann, M. (2003). The Red King effect: When the slowest runner wins the coevolutionary race. PNAS, 100(2), 593–598. https://doi.org/10.1073/pnas.0134966100
- Binmore, K. (2005). Natural Justice. Oxford University Press.
- Brown, G. W. (1951). Iterative Solutions of Games by Fictitious Play. In T. C. Koopmans (Ed.), Activity Analysis of Production and Allocation, 374–384. Wiley.
- Bruner, J. P. (2019). Minority Disadvantage in Population Games. Synthese, 196(1), 413–427. https://doi.org/10.1007/s11229-017-1487-8
- Clark, J. (2017). Red Queen vs. Red King: When the Slowest Runner Wins the Race. SSRN Electronic Journal. https://doi.org/10.2139/ssrn.2985320
- Cochran, C., & O’Connor, C. (2019). Inequality and Inequity in the Emergence of Conventions. Politics, Philosophy and Economics, 18(3), 269–281. https://doi.org/10.1177/1470594X19828371
- Dawkins, R. (1976). Selfish Gene. Oxford UP.
- Epstein, J. M., & Axtell, R. (1996). Growing Artificial Societies: Social Science from the Bottom Up. Brookings Institution Press.
- Fudenberg, D., & Levine, D. K. (1998). The Theory of Learning in Games. MIT Press.
- Gao, L., Yao-Tang, L., & Wang, R.-W. (2015). The shift between the red queen and the red king effects in mutualisms. Scientific Reports, 5(1), 8237. https://doi.org/10.1038/srep08237
- Gintis, H. (2007). The Evolution of Private Property. Journal of Economic Behavior and Organization, 64(1), 1–16. https://doi.org/10.1016/j.jebo.2006.02.002
- Gokhale Chaitanya, S., & Traulsen, A. 2012. “Mutualism and evolutionary multiplayer games: Revisiting the red king.” Proceedings of the Royal Society of London B: Biological Sciences, 279 ( 1747):4611–4616.
- Guala, F. (2016). Understanding Institutions: The Art and Science of Living Together. Princeton University Press.
- Hammond, R. A., & Axelrod, R. (2006). Evolution of Ethnocentrism. Journal of Conflict Resolution, 50(6), 926–936. https://doi.org/10.1177/0022002706293470
- Leonardelli, G. J., & Brewer, M. B. (2001). Minority and majority discrimination: When and why. Journal of Experimental Social Psychology, 37(6), 468–485. https://doi.org/10.1006/jesp.2001.1475
- Maynard Smith, J. (1982). Evolution and the Theory of Games. Cambridge University Press.
- O’Connor, C. (2017). The Cultural Red King Effect. The Journal of Mathematical Sociology, 41(3), 155–171. https://doi.org/10.1080/0022250X.2017.1335723
- O’Connor, C. (2019). The Origins of Unfairness: Social Categories and Cultural Evolution. Oxford UP.
- Sakoda, J. M. (1971). The checkerboard model of social interaction. The Journal of Mathematical Sociology, 1(1), 119–132. https://doi.org/10.1080/0022250X.1971.9989791
- Schelling, T. C. (1971). Dynamic models of segregation. Journal of Mathematical Sociology, 1(2), 143–186. https://doi.org/10.1080/0022250X.1971.9989794
- Schelling, T. (1978). Micromotives and Macrobehavior. Norton.
- Skyrms, B., & Zollman, K. J. S. (1996). Evolutionary considerations in the framing of social norms. Politics, Philosophy & Economics, 9(3), 265–273. https://doi.org/10.1177/1470594X09339744
- Skyrms, B. (1996). Evolution of the social contract. Cambridge University Press.
- Sugden, R. (1986). The Economics of Rights, Welfare and Co-operation. Blackwell.
- Sugden, R. (1989). Spontaneous order. The Journal of Economic Perspectives, 3(4), 85–97. https://doi.org/10.1257/jep.3.4.85
- Trivers, R. (1971). The evolution of reciprocal altruism. Quarterly Review of Biology, 46(1), 35–37. https://doi.org/10.1086/406755
- Veller, C., Hayward, L.K., Hilbe, C., & Nowak, M. A. 2017. “The Red Queen and King in Finite Populations.” PNAS, June 19, 2017; https://doi.org/10.1073/pnas.1702020114. 114 27 E5396–E5405
- Young, H. P. (1993a). The evolution of conventions. Econometrica: Journal of the Econometric Society, 61(1), 57–84. https://doi.org/10.2307/2951778
- Young, H. P. (1993b). An evolutionary model of bargaining. Journal of Economic Theory, 59(1), 145–168. https://doi.org/10.1006/jeth.1993.1009
Appendix A
Chart, with caption below explaining it.
Appendix A, Figure I
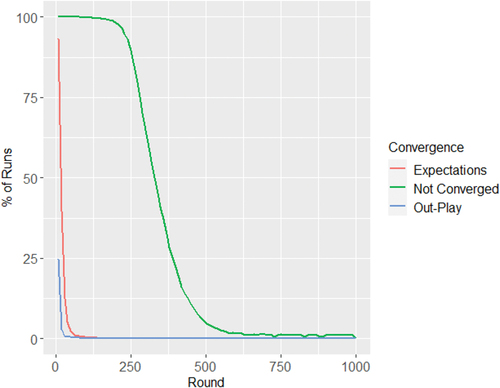
The figure compares two heuristic methods for identifying convergence to dominance with the definitive method described in section 3.1. Also shown is the % of runs that have yet to converge by the definitive criterion after each number of rounds. Method 1 (“the out-play method”) involves testing in each round whether every outgroup interaction in that round has involved members of one group playing “Hawk,” and members of the other group “Dove.” Method 2 (“the expectations method”) involves testing in each round whether the mean expectation in one group is less than the mean expectation in the other group. We report for each simulation run, whether a round met the criterion being used, and if so, which was the first such round, and was the final round run such a round. Neither heuristic method is guaranteed to classify a run correctly within a particular number of rounds, but comparing with the definitive method showed error rates from 250 rounds no worse than 0.5% for any parameter combination.
As more rounds are run, the % of runs that have yet to converge on one group dominating the other (green line) falls to zero, with the vast majority having converged before round 500. However, the two heuristic methods for predicting convergence, using comparisons of groups’ mean expectations (red line) and comparisons of groups’ play in outgroup interactions (blue line), show sharply falling error rates well before this. The scenario shown here, with PR=80%, V/C=0.9, and empty-memory rule MSNE, was one of the slowest to reach total convergence. Nonetheless, we see that a good prediction can be obtained well before 250 rounds. Indeed, for no parameter combination did using Expectations as the method for deciding dominance after 250 rounds generate no more than 8 errors in 2000 runs. Hence, we can conclude that 250 rounds are more than adequate for generating robust minority/majority dominance statistics, despite the fact that many runs have not converged by round 250.
Appendix B
Pie shop charts for HDB-1 through HDB-5
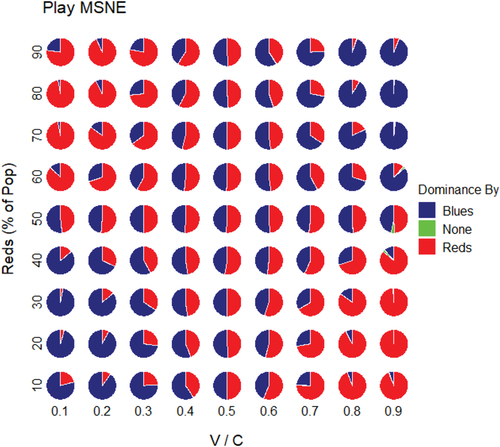
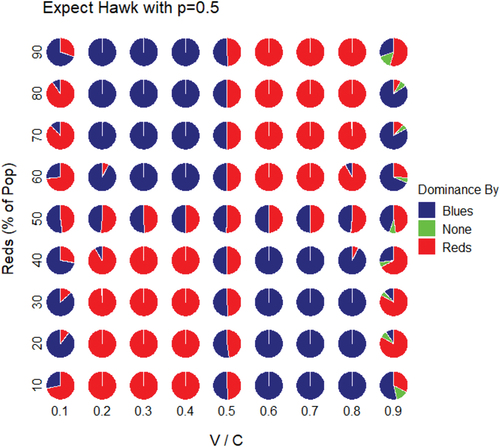
Pie Shop diagrams for Dominant Group after 250 rounds, 2000 runs
Each pie represents the percentage of Red and Blue dominance for each configuration of our simulation as a function of the initialization conditions; green represents the percentage resulting in no dominance within 250 runs. In most cases the lack of dominance within 250 runs does not occur, and even when it does for cases of low-cost games with V/C = 0.9 (see, e.g., HDB-5 below), this lack of convergence is almost insignificant for our overall results.
HDB-1, MSNE Initialization
HDB-2, Expect Dove Initialization
HDB-3, Expect Hawk Initialization
HDB-5, Play Hawk with p = .5 initialization
HDB-5, Expect Hawk with p = .5 initialization