
ABSTRACT
Driver behavior and vehicle-road kinematics have been shown to change over prolonged periods of driving; however, the interaction between these two indices has not been examined. Here we develop a measure that examines how drivers turn the steering wheel relative to heading error velocity, which the authors call the relative steering wheel compensation (RSWC). The RSWC transiently changes on a short time scale coincident with a verbal query embedded within the study paradigm. In contrast, more traditional variables are dynamic over longer time scales consistent with previous research. The results suggest drivers alter their behavioral output (steering wheel correction) relative to sensory input (vehicle heading error velocity) on a distinct temporal scale and may reflect an interaction of alerting and control.
Extended driving times, such as cross-country trips or long daily commutes, may cause significant decrements in driving performance and increased accident rates as the individual continues to drive (C. C. Liu, Hosking, & Lenné, Citation2009; Otmani, Pebayle, Roge, & Muzet, Citation2005; Ting, Hwang, Doong, & Jeng, Citation2008). The effects of time on driver performance have been investigated from two general perspectives: (a) vehicle-environment kinematics and (b) driver behavior. The former, encompass measures such as vehicle lane position, time to contact a road edge, vehicle heading, and speed among many others that are direct measures of vehicle kinematics relative to the road or external environment. Driver behaviors, on the other hand, are measures such as steering wheel movements, accelerator and brake pedal engagement, and gear shifting, which convey information about the driver's explicit interactions with the vehicle (Desmond & Matthews, Citation1997; Forsman, Vila, Short, Mott, & Van Dongen, Citation2013; Otmani et al., Citation2005; Sandberg, Akerstedt, Anund, Kecklund, & Wahde, Citation2011; Thiffault & Bergeron, Citation2003; for a thorough review of driver measures including physiological measures, see Dong, Hu, Uchimura, & Murayama, Citation2011). One or more of these indices (vehicle-environment kinematics or driver behaviors) are often used to make inferences about driving performance decrements as a function of time on task, although no single measure can be considered a gold standard for measuring driving performance due to a large number of interacting factors and individual differences across subjects (Balkin et al., Citation2011; Di Milia et al., Citation2011). Novel measures, or transformations of existing ones, that can improve the sensitivity, specificity, reliability, validity, and robustness of measures indexing driver performance decrements are needed and remains an active area of research (Forsman et al., Citation2013; Sandberg et al., Citation2011).
Time-on-task studies are abundant and findings from this literature are variable with effects observed within just a few minutes to being delayed for up to several hours to not observed at all (Gillberg & Åkerstedt, Citation1998). It is likely, then, that fluctuations in vigilant attention and performance occur across multiple time scales. Several investigators have developed models of attention and vigilance that predict these differences in temporal dynamics. For example, mindlessness models posit that levels of internally versus externally directed attention fluctuate during an overlearned task and therefore would predict transient changes in behavior (Smallwood et al., Citation2004). Alternatively, resource depletion models would suggest that over time attentional resources are diminished and predict decrements over a longer time scale (Grier et al., Citation2003). It is possible that both types of models contribute to time-on-task effects and may affect different behavioral indices. While the underlying mechanisms of these considerations are unclear, comparing novel and traditional measures of driving behavior on various time scales may provide additional insight.
The purpose of this study was to investigate a specific relationship between vehicle-environment dynamics and driver behavior based and whether this relationship changes over a prolonged period of driving. In other words, is there a constant relationship between drivers’ responses and vehicle-road kinematics, or is it changing over time? Given the previously cited results that vehicle kinematics and driving behavior change over the course of a prolonged drive, we hypothesized that our new measure would also demonstrate significant changes over time.
To establish the appropriate metric we adapted a relationship discovered by Hildreth, Beusmans, Boer, and Royden (2000), wherein they examined the relation between corrective steering wheel maneuvers and the vehicle's heading with respect to the road. Their observation was that the steering wheel response magnitude (SWRM) was related to the vehicle's heading error (HE). In this context, the SWRM was measured in degrees and represents the difference between the peak of the steering wheel response from the starting position of the steering wheel. The HE was measured as the angle between a straight line parallel to the road edge and the vehicle's current heading. Subsequent studies have further confirmed the importance of visually derived estimates of heading to impart adequate control of the vehicle (Cloete & Wallis, Citation2009; Li & Cheng, 2011; Macuga, Beall, Kelly, Smith, & Loomis, 2006; Wallis, Chatziastros, & Bülthoff, 2002). However, unlike those methods employed by Hildreth et al., where a constant heading error was used to relate the steering wheel response, in our experiment, participants were subjected to dynamic heading errors as a result of a more naturalistic driving task. Therefore, we tested whether the heading error itself, or the temporal derivative of heading error (dHE), was more highly related to the SWRM. Indeed, we confirmed a stronger correlation between dHE and SWRM than between HE and SWRM. We then defined a simple linear relationship that predicted the SWRM as a function of the dHE. The slope of this relationship served as a dependent variable reflecting the interaction between vehicle-environment kinematics and driver behavior. We call this new measure the relative steering wheel compensation (RSWC) as it represents the amount of steering wheel compensation (behavioral output) expected for a given heading error velocity, dHE (sensory input). Finally, to determine the time scale over which the RSWC and other independent measures of behavior and vehicle kinematics, we examined these variables on 5-, 15-, and 45-min time scales.
Our primary interest was to examine whether or not our new measure, RSWC, as an index of the relationship between vehicle kinematics and driver behavior is dynamic over the course a prolonged drive, and, if so, to expose the temporal dynamics of these changes in comparison to previously established indices of performance. We confirm our hypothesis that the RSWC would be dynamic and further demonstrate that it changes on a much shorter time scale than independent measures of driver behavior and vehicle kinematics. Based on additional analysis described in greater detail subsequently, we suggest that our observations may be secondary to distinct processes that impart differential, quantifiable effects on separable indices of behavior, which may be used to gain better insight into the state of the driver.
Method
Subjects and Apparati
The participants were neurologically intact and otherwise healthy, adult right-handed and right-eye-dominant males (N = 12; age range = 27–39 years). The voluntary, fully informed consent of the participants was obtained following U.S. Army human use regulations approved by the Army Research Laboratory Institutional Review Board, which adheres to the Declaration of Helsinki (http://www.wma.net/en/10home/index.html). Each subject was brought to the laboratory and outfitted with a 64-channel BioSemi electroencephalogram (EEG) headcap (Amsterdam, the Netherlands). In addition to driving and EEG data, eye-tracking data were collected using a SensoMotoric Instruments (Teltow, Germany) module that uses an infrared camera to track pupil position. However, for the purpose of this manuscript, only behavioral driving data will be reported and discussed. After application of the EEG cap, subjects were asked to enter the recording chamber where they were seated at a desk, on which a computer monitor displayed a simulated four-lane highway (see Driving Task section for details). Subjects controlled the simulated vehicle using the accelerator, brake pedals, and steering wheel. All subjects were licensed drivers and had been driving for at least 10 years.
Driving Task
The participants were allowed approximately 10–15 min practice to become acclimated to the simulation environment and driving controls (SimCreator, Real Time Technologies, Ann Arbor, MI; see ). The simulation environment consisted of a sound-attenuated chamber with a desktop and chair, a 24-inch monitor (screen resolution 1680 × 1050; refresh rate 60 Hz), a gaming steering wheel mounted on the desktop, and accelerator and brake pedals on the floor adjusted on an individual basis depending on the participant's leg length and personal preferences. Following practice and demonstration of asymptotic levels of lane keeping and speed control, the participants were set to begin the experiment. The experiment consisted of a 15-min calibration period followed by a 45-min experimental period of continuous driving down a long, straight four-lane highway with no traffic and minimal roadside scenery to induce a time-on-task effect (Thiffault & Bergeron, Citation2003). In the calibration period drivers were not able to control the speed of the vehicle and the data from this condition were recorded for purposes of another experiment but not used for the purposes of this report. The results from this time period are not included here because of the methodological differences between calibration and experimental conditions. Regardless, at the time that subjects began the experimental condition, they were well versed with the vehicle dynamics. In our estimation therefore, practice effects would be trivial given that prior to beginning the experiment subjects had been exposed to the simulator for roughly 20–25 min and all demonstrated consistent vehicle control.
FIGURE 1. Screen capture of simulated driving environment. Participants used a steering wheel and gas or brake pedals to control the vehicle. They were instructed to keep their vehicle in the center of the right-most lane despite experiencing perturbations that induced heading changes.
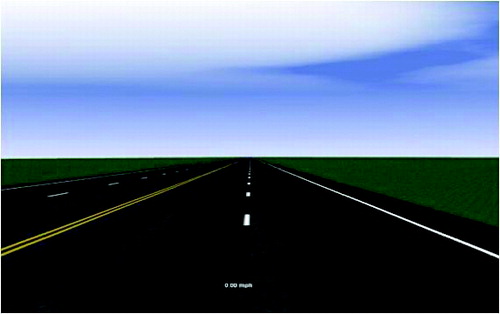
Throughout the experimental condition, random perturbations simulating wind gusts were applied as a linearly increasing force to the center of gravity of the vehicle causing it to veer off course (Lin et al., Citation2005; Y.-C. Liu & Wu, Citation2009; Thiffault & Bergeron, Citation2003). Subjects were informed that they would periodically experience these perturbations (and they experienced them during the practice drive), and they were instructed to keep the vehicle in the center of the right-most lane. Perturbations were randomly distributed across directions (right and left) and at variable intervals between 8 and 10 s. The perturbation force was cancelled once the subject turned the steering wheel ≥4° in the compensatory direction. If the subject then maintained the vehicle within the right lane over the next 8 and 10 s, another perturbation was administered. Subjects were also instructed to use the accelerator and brake pedals to maintain the vehicle speed as close to the posted speed limit of 45 mph as they could. At approximately 10-min intervals a speed limit sign was displayed, which required the subjects to reduce their speed to 25 mph for a fixed distance of 500 m and then subsequently a 45 mph speed limit sign was again displayed. This implementation of speed changes was designed to allow for analyses to identify whether subjects were adhering to the instructions and rules of the task throughout its duration.
Subjective measures of fatigue were also collected using the Karolinska Sleepiness Scale (KSS) (Åkerstedt & Gilbert, Citation1990). The KSS was initially administered before the experimental condition, and approximately every 15 min over the course of the 45-min drive. The KSS was administered verbally by the experimenters according to a standardized script over an intercom by asking subjects to rate their current ratings of alertness or sleepiness on a 9-point Likert-type scale ranging from 1 (very alert) to 9 (very sleepy, fighting sleep). Subjects verbally responded through an intercom and their responses were manually recorded on a data sheet, but importantly, subjects were able to continue driving with minimal interruption. Obtaining a pre-experimental KSS score was lost for one subject; however we report the data for all subjects (N = 12) and those subjects whose scores could be baseline corrected (n = 11).
Data Acquisition and Metric Definitions
The simulator software refreshed the kinematics of the vehicle at 900 Hz and exported data at 90 Hz. Steering wheel angle time series were high pass filtered at 5 Hz to reduce low amplitude, high frequency noise in order to enable more accurate detection of peaks in steering wheel reversals. For each perturbation event, reaction time was determined as the time elapsed from perturbation onset (square [PertOn], , top panel) to the initiation of the steering wheel response (diamond [RespT], ), which was determined as the beginning of a monotonic rise in the steering wheel angle. The SWRM was determined by finding the absolute difference between the first peak in the steering wheel time series (circle [PeakSWR], ) and the value at initiation of the response (diamond [RespT], ) measured in degrees. Lane deviation (LD) was determined as the absolute difference between the vehicle's position at the time of response and the center of the right-most lane and was measured in meters (, second panel). The absolute HE was determined as the absolute value of the angle between the simulated vehicle's direction of travel at the response time (diamond, , third panel) and a line parallel with the indefinitely straight road measured in degrees. Finally, the dHE was determined as the absolute value of the temporal derivative of the heading error at the time of response in degrees/second (, fourth panel). We used the absolute value of these measures because we were interested in how driving behavior scaled to the magnitudes of the specified parameters but not to their directions (left or right). All of these metrics were determined for each trial, which consisted of a perturbation onset to the peak of the steering wheel response as depicted in .
FIGURE 2. Example trial from a single subject to demonstrate the observed metrics. The x-axis is time in seconds. Time 0 refers to the onset of the perturbation that demarcated a trial. The steering wheel response magnitude (SWRM) was calculated as the difference in degrees between the circle and diamond. This was related to the value of the change in heading error at the time of response initiation (diamond, bottom subplot). square = when the perturbation was turned on; diamond = initiation of response; circle = peak of the steering wheel response.
Derivation of RSWC
We also applied separate regression analyses between SWRM and dHE (EquationEquation 1(1) ) across the aggregated trials in 5-min periods to examine linear changes in the relationship between vehicle-environment kinematics and driver behavior over time. As we discuss in the Results section, regressing SWRM on dHE revealed significantly higher slope values, R2 values and lower residual errors than that revealed by regressing SWRM on HE. Therefore, given the relatively stronger relationship between SWRM and dHE, we focused our subsequent analysis on how this relationship changes over time. In subsequent analysis we also examined the variance of the SWRM accounted for by the dHE by determining the R2 of EquationEquation 1
(1) .
(1)
Design and Statistical Analyses
We were interested in how driver behavior and vehicle road kinematics changed over various durations of time. To investigate such effects of time, we performed two general classes of analysis. The first was a two-way repeated-measures analysis of variance consisting of two different time scales as factors. The second was a linear regression to evaluate the effect of continuous measure of observed variables. The latter regression is not to be confused with the regression slope used to derive our measure of interest, RSWC, described in more detail subsequently.
Analysis of Variance
We applied a two-way repeated-measures ANOVA design (Block × Time Interval), each with three levels. More specifically, we derived three 15-min blocks corresponding to the administration of the KSS and within each 15-min block, three 5-min time intervals corresponding to the intervals over which the regression lines (EquationEquation 1(1) ) were derived. Each 5-min interval consisted of approximately 25 perturbations.
Regression Analysis
In addition to the two-way ANOVA analysis, we also examined the effect of time by implementing a continuous regression analysis by using time as an independent variable and the measure under consideration as the dependent variable. Utilizing this analysis we determine the 95% confidence interval around the slope of the regression and determine whether there was a significant increase or decrease in the analyzed variable over time.
Results
General Results
Here we report several metrics that describe the general performance and subjective experience of the participants in this specific paradigm to frame the experimental results. The mean reaction time across all subjects to the perturbations was 1.15 s ± 0.16 s (M ± SD). The movement time to complete the SWRM (i.e., time from the diamond to circle; ) was 0.5 ± 0.10 s. The SWRM itself was 13.74 ± 3.52°, and the dHE value was 0.43 ± 0.14°/s. KSS scores were 6.02 ± 2.01. The LD was 0.366 ± 0.13 m.
Relationship Between HE/dHE and SWRM
We applied regression analyses between SWRM and dHE/HE at the time of response to better understand the relationship between measures of vehicle-environment kinematics and driving behavior. As the values that went into this comparison were the absolute value and nonnormally distributed, we utilized a nonparametric correlation measure to ascertain the degree of relatedness between the HE or dHE and SWRM. The average Spearman's correlation coefficient between the peak SWRM and the dHE and the HE, across all subjects was 0.59 and 0.35 respectively. For each subject independently, the correlation between SWRM and dHE was significant while for only two subjects the correlation between HE and SWRM was significant. Across all subjects, the larger correlation between the SWRM and dHE was confirmed statistically by performing a one-tailed paired t test on the Fisher's Z transformed correlation coefficients (p < .003). We extended this analysis by also comparing the root mean squared error (RMSE) for these regressions. The regressions were fit for each 5-min interval in the experiment and utilizing a paired, one-sided t test we found a significantly larger RMSE for the regressions between the SWRM and the HE than with the dHE (p < .001). From these analyses we were confident that the dHE in our experiment was more closely related to the SWRM than the HE. This finding was important because it provided confirmation that we should focus subsequent analyses on the most meaningful relationship between vehicle kinematics and driver responses. Consequently, we focused on the relation between SWRM as a linear function of the dHE. In we show an example subject's regression fit between the SWRM and dHE for all nine 5-min blocks over the 45-min drive.
FIGURE 3. Example regression fits for single subjects across in each time interval. Points in each block represent a single trial within that 5-min time interval. The slope of these regression lines was our independent variable, relative steering wheel compensation. dHE = derivative of heading error.
ANOVA
We examined the time on task effect on standard vehicle based measures (LD, dHE), driver behavior (SWRM), and the novel interrelated measure, RSWC. illustrates the time-on-task effect for these measures. reports the results of the two-way repeated-measures ANOVA.
TABLE 1. Summary of Two-Way Analysis of Variance Design Results
FIGURE 4. Graphical representation of the variables of interest. Each subplot demonstrates the time course for each of the measures examined in this study. Vertical dashed lines represent the blocks in which subjects were interrupted to assess Karolinska Sleepiness Scale values and served as our block factor. The axes are the 5-min time interval factor in our analysis of variance design. Within each block the time factor level was 1, 2, 3. Please note that there are a total of nine time intervals for a total of 45 min. Error bars represent standard errors of the mean. The gray lines are the regression analysis over the entire 45-min duration of the experiment. RSWC = relative steering wheel compensation; LD = lane derivation; dHE = derivative of heading error; SWRM = steering wheel response magnitude.
LD, SWRM, and dHE did not show significant main effects for blocks, time intervals, or their interaction. The main effect of block for dHE approached but did not reach significance (p = .10). The main effect of blocks and the interaction between blocks and time intervals for RSWC were not significant but the main effect of time interval was significant. Post hoc analysis utilizing Tukey's HSD revealed that RSWC in time interval 1 was significantly lower than that observed in time interval 2 but not time interval 3.
Analysis of the Regression Parameters in Relative Steering Wheel Compensation
Further analysis with respect to the relationship of SWRM as a function of dHE involved analyzing the RMSE, the intercept (b), and the variance accounted for, R2RSWC. RMSE of the relationship did not differ over block (p > .05), time interval (p > .05), or block by time interval (p > .05). Similarly, no significant differences were observed for (b) over blocks (p > .05), time intervals (p > .05), or block by time interval (p > .05). However, we observed that R2RSWC changed significantly with respect to time intervals, F(2, 99) = 3.66, p = .029; but the main effects for blocks (p > .05), and the interaction block by time intervals (p > .05) were not significant. Post hoc Tukey HSDs demonstrated that there was a significant increase in the R2RSWC from time interval 1 to time interval 3.
Linear regression analysis. To further scrutinize the time-on-task analysis, we utilized a linear regression across all nine 5-min time intervals in the experimental session. This permitted us to interrogate the measures of interest in this study over 45 min of continuous time. In (gray lines), we plot the linear regression for each parameter of interest and in we report the slope of this line along with the 95% confidence interval. SWRM and dHE both demonstrated significant, positive slopes across the duration of the experiment; however, LD and RSWC did not. The variance accounted for by time for SWRM and dHE relationships were low, ∼3% and ∼6%, respectively. To further elucidate the dynamics of the time-on-task effects, we also performed linear regression analyses on the aforementioned measures (b), RMSE, and R2RSWC. The slope of the RMSE over the duration of the experiment was not significant (95% CI [–0.021, 0.27]), nor was the slope for the intercept, (b), (95% CI [–0.27, 0.29]). However, R2RSWC did demonstrate a significant positive slope over time (slope = 0.017 [95% CI (0.0006, 0.033)]). In we plot the R2RSWC for this relationship over the duration of the experiment.
TABLE 2. Regression Over Experiment Time
FIGURE 5. The variance accounted for in the steering wheel response magnitude (SWRM) by derivative of heading error across subjects for all time points in the study. The time factor in our analysis of variance design was significant across subjects, as was the linear regression (gray) over time.
Relationship between R2RSWC and RSWC. After observing that both R2RSWC and RSWC increased with respect to the time intervals factor in the ANOVA, we investigated the relation between these two measures across the duration of the experiment. To illustrate this relation we plot RSWC against R2RSWC in for all subjects and Time Intervals in this study. From this plot it appears that there is a strong relationship between the two. The Spearman's correlation coefficient between R2RSWC and RSWC was 0.81 (p < .0001). We extended this analysis by fitting a power curve to these data in the form:(2)
FIGURE 6. For each regression computed in the study (EquationEquation 1(1) ) we plot the R2 and relative steering wheel compensation (RSWC) derived from that model. There was a high correlation between the two parameters, and a power curve fit (EquationEquation 2
(2) ) was significant (gray).
The fitted value for x was 28.92, 95% CI [25.79, 32.05] and for y it was 0.50, 95% CI [0.40, 0.59]. The percent of variance accounted for in RSWC by the fit (R2 of Equation n 2) was .65. It is important to note that this is adjusted for the number of parameters in the fit. A linear fit was also examined but the R2 was lower (.60) when adjusting for the number of parameters in the fit.
KSS analysis. As stated previously, the KSS value for one of the subjects before the experiment was lost. Therefore we could not baseline-correct experimental KSS values for pre-experimental levels of subjective fatigue for all subjects. However, for all 12 subjects, the mean absolute KSS values for Blocks 1, 2, and 3 were 5.75, 6.66, and 6.66, respectively. The Kruskal-Wallis test applied to the absolute KSS values for the 12 subjects did not reveal a significant increase over time (p = .42). However, analysis of the data from 11 of 12 subjects for which we baseline-corrected using pre-experimental ratings of fatigue, we observed a significant increase ratings of fatigue over time (p = .037).
Discussion
General Findings
The primary purpose of this study was to examine whether drivers changed their response to vehicle-road kinematics over time. Our main result, as reflected in , demonstrates that there is a significant change in the relationship of how drivers scale their steering wheel response to heading error velocity. As we report in the Results section, there was a significant increase in RSWC from the first 5-min time interval to the second, across all three blocks in the study. Conversely, the other measures considered in our study showed differences over much longer time scales, which the RSWC did not. Therefore, we suggest that the RSWC represents a distinct signature of behavior that is not present in either indices of performance independently.
Effect of Time on dHE, SWRM, and LD
Based on the ANOVA, none of these variables demonstrated a significant effect of block, time interval, or their interaction. We interpret this result in the context of our follow-up analysis of the linear regression over continuous time. The observation that there was no effect of time interval or block by time interval interaction suggests that these measures of driving performance are not sensitive to changes in short time scales The regression analysis revealed significant positive slopes for both the SWRM and dHE, which supports previous observations of changing levels of performance on a relatively longer continuous time scale and are consistent with the KSS findings in this study (Otmani et al., Citation2005; Thiffault & Bergeron, Citation2003). This finding suggests that, with increasing time on task, subjects responded at relatively larger heading error velocities, perhaps revealing an indication of their increased tolerance (or decreased vigilance) to increasingly larger heading error velocities, or other closely related parameter of vehicle-road kinematics. Additionally, the SWRM increased over a similar time scale, seemingly to compensate for this increase in the derivative of heading error.
The LD at the time of response demonstrated a positive, albeit not significant, slope over the course of the experiment. By this measure, we infer that the participants in our study were vigilant of the central task requirement, which was to minimize the absolute difference between the vehicle position and the center of the right lane. This finding is consistent with the literature, which suggests that subjects are vigilant against infractions against central task requirements by changing their compensatory strategy (Grier et al., Citation2003; Robert & Hockey, Citation1997; van der Linden, Frese, & Meijman, 2003). In our view this concept captures the idea that when observed over a larger time scale, drivers allow more error to accumulate and respond accordingly by making larger corrections (changing their compensatory strategy) and yet still maintain the central objective of keeping the vehicle centered in the right lane.
Effect of Time on RSWC, b, RMSE, and R2RSWC
Based on the ANOVA, the RSWC demonstrated a significant main effect of time interval with time interval 1 exhibiting significantly lower values than time interval 2, but not different from time interval 3, and time intervals 2 and 3 did not differ from each other. Perhaps what is most interesting is that time interval 1 represents periods immediately after subjects were asked to evaluate their fatigue status over the intercom (dashed lines ). We observed that immediately following these interrogations there appeared to be an effect in which drivers reduced their compensatory steering movements relative to the heading error velocity. These results suggest that asking drivers to rate their fatigue transiently and the onset of the experiment affected the gain between steering responses to vehicle-road kinematics, which supports our primary hypothesis that this relationship is dynamic. There was no significant increase or decrease of the RSWC when analyzed over the 45-min drive using regression analysis, which is consistent with the combined increases in SWRM and dHE independently. It is unclear from our analysis, had we not interrupted the drivers with the fatigue query whether this would have continued to uptrend or remained constant and warrants further investigation. Nevertheless, given that the RSWC does not increase over time similar to the independent vehicle or behavioral measures adds to the idea that it is reflective of a different process affecting the driver.
There were no changes in the RMSE or the offset (b) for the regressions used to derive the RSWC. To us this implies that a linear fit was able to adequately capture the relationship between changes in heading error and steering wheel response magnitudes. Additionally, it does not appear as though subjects changed the position of the steering wheel when there was minimal heading error velocity. The only thing that appeared to change in the newly derived variables throughout the experiment was in fact, the RSWC, and the R2RSWC.
The observation that the R2RSWC changed significantly is interesting considering that the SWRM is considered to occur in open loop (Hildreth et al., Citation2000). When the R2RSWC was very high, the heading error velocity accounted for a large proportion of the variance in SWRM and implies that drivers were using the dHE, or another variable very similar to it, to generate their steering wheel responses. In contrast, when it was low, less of this variance is accounted for. Whether this represents a shift in control strategy by incorporating additional terms, a deterioration in the accuracy of dHE estimation to generate a steering response, or another effect is unclear from this analysis. Preliminarily, we consider that the former explanation is feasible. This feasibility is suggested by our data by combining the observations that R2RSWC subtly increases over the experiment duration while the RSWC does not, yet after being verbally queried, both metrics seem to covary and decrease significantly. These findings can be consolidated in a model wherein drivers impart more predictive, precise control (resulting in relatively smaller SWRM) after being alerted by an auditory stimulus, thereby decreasing the amount of variance explained by the heading error velocity. When observed over the longer time scale drivers may shift to a strategy relying more heavily on heading error velocity estimates to generate responses thereby explaining more variance in the SWRM. Such an explanation would be in agreement with previous studies that have examined the effect of auditory cues and warnings, which demonstrate improved performance as measured by reaction time, albeit for only transient periods (Belz, Robinson, & Casali, 1999; Graham, Citation1999; Lin et al., Citation2009; Verwey & Zaidel, Citation1999).
Attention Models
Many models have been offered over the past several decades to account for time-on-task effects on performance, two general classes of models relevant to sustained vigilance tasks, such as long-distance driving on a desolate highway, are resource or capacity models (Grier et al., Citation2003; Helton & Russell, Citation2011; Helton & Warm, Citation2008; Smit, Eling, & Coenen, 2004) and mindlessness or mind-wandering models (Cheyne, Carriere, & Smilek, 2009; Langner & Eickhoff, Citation2013; Smallwood et al., Citation2004; Smallwood & Schooler, Citation2006). Resource models assert that energy or resources are needed to perform a given task and that these resources are of limited capacity and susceptible to depletion with extended time on task. Mindlessness models, on the other hand, assert that attention fluctuates between task-relevant and -irrelevant processing and that prolonged monotonous or repetitive tasks are particularly susceptible to boredom, absent-mindedness, and mind wandering. Such transitory attentional shifts are thought to be driven by internally oriented goals or insufficient inhibition of competing schemata (Langner & Eickhoff, Citation2013).
Because of its transient nature, the changes in RSWC after alerting appear to be more congruent with a mind-wandering explanation, according to which attentional focus is susceptible to fluctuations between task-related and -independent brain processes, especially during the performance of long, monotonous, and highly overlearned tasks that are perceived as boring by the subject. This is an interesting observation in that it implies that changes in RSWC are affected by transient changes in attention that do not affect the overall behavioral performance, at least in the local 5-min time intervals in which we observed changes in the RSWC. As an explanation for the observed changes in RSWC, the resource depletion perspective seems less tenable because it implies that resources are just what the term explicitly describes, the depletion of resources, which presumably would occur cumulatively over some period of time but not early during performance, as was observed in the present study. However, the resource depletion model may explain the longer term changes observed in the dHE and SWRM, wherein resources may have been depleted during the course of the experiment resulting in increasingly larger behavioral errors as time progressed. In this view, it may be that both models of attention and alertness are involved but that each explains different temporal scales and different indices of driver behavior.
There are a few caveats to consider with our approach. First, the SWRM is functionally limited because of biomechanical and vehicle constraints. Depending on where subjects placed their hand(s) on the steering wheel, the initial phase of the steering wheel response is limited to a narrow range of possible values. In this way a linear relationship cannot possibly capture the exact relationship between the SWRM and vehicle parameters because the former is limited to functional values. Likely, the function between SWRM and dHE represents more of a power-like curve that asymptotes at a SWRM that is a combination of vehicle construction and the body position of the driver. We were limited by the nature of our task in the ability to relate the SWRM as a function of the dHE across a wide range of values. This is because our study was designed to interrogate the naturally occurring range of dHE values experienced by the drivers and was not an experimentally manipulated variable. Further studies to investigate the relationship between the steering wheel response, body posture, and wider operating range of heading errors would be needed to fully elaborate this relationship. Despite these considerations, we suggest that the linear approximation of this relationship captures the bulk of the operating range for these parameters in our experiment.
Conclusions
Our primary result demonstrated that immediately following interruptions, drivers changed the gain between vehicle-road kinematics and behavioral outputs demonstrating the dynamic nature of this relationship. The effect of this interruption was short-lived supporting other studies, which also demonstrate transient effects of alerting interventions on behavior (Anund, Kecklund, Vadeby, Hjälmdahl, & Åkerstedt, 2008; Horne & Reyner, Citation1996; Lin et al., Citation2010; Phipps-Nelson, Redman, & Rajaratnam, 2011). Contrastingly, vehicle kinematics and driver behavior in isolation did not demonstrate changes on this brief time scale, however did change over the course of the experiment, underscoring that our new measure, the RSWC tracks a separable index of driver behavior. These changes may additional insight into the time on task effect, suggesting that perhaps there is an interaction between control and attention and alert. Our exploratory analysis hints at possible explanations for this change in relative corrective responses, however additional investigation is needed to further clarify these changes. Future studies are also needed to advance the theoretical understanding of the changes in alertness frequently observed in studies of vigilance performance and more elaboration is needed to describe the different time scales on which different measures of performance may be more sensitive.
FUNDING
This work was funded by the U.S. Department of the Army and Oak Ridge Associated Universities. Research was sponsored by the Army Research Laboratory and was accomplished under Cooperative Agreement Number W911NF-12-2-0019. The views and conclusions contained in this document are those of the authors and should not be interpreted as representing official policies, either expressed or implied, of the Army Research Laboratory or the U.S. Government. The U.S. Government is authorized to reproduce and distribute reprints for Government purposes notwithstanding any copyright notation herein.
REFERENCES
- Åkerstedt, T., & Gillberg, M. (1990). Subjective and objective sleepiness in the active individual. International Journal of Neuroscience, 52, 29–37.
- Anund, A., Kecklund, G., Vadeby, A., Hjälmdahl, M., & Åkerstedt, T. (2008). The alerting effect of hitting a rumble strip—A simulator study with sleepy drivers. Accident Analysis and Prevention, 40, 1970–1976.
- Balkin, T., Horrey, W., Graeber, R., Czeisler, C., & Dinges, D. (2011). The challenges and opportunities of technological approaches to fatigue management. Accident Analysis & Prevention, 43, 565–572.
- Belz, S. M., Robinson, G. S., & Casali, J. G. (1999). A new class of auditory warning signals for complex systems: Auditory icons. Human Factors Journal, Human Factors and Ergonomics Society, 41, 608–618.
- Cheyne, J. A., Carriere, J. S., & Smilek, D. (2009). Absent minds and absent agents: Attention lapse induced alienation of agency. Consciousness and Cognition, 18, 481–493.
- Cloete, S. R., & Wallis, G. (2009). Limitations of feedforward control in multiple-phase steering movements. Experimental Brain Research, 195, 481–487.
- Desmond, P. A., & Matthews, G. (1997). Implications of task-induced fatigue effects for in-vehicle countermeasures to driver fatigue. Accident Analysis and Prevention, 29, 515–523.
- Di Milia, L., Smolensky, M., Costa, G., Howarth, H., Ohayon, M., & Philip, P. (2011). Demographic factors, fatigue, and driving accidents: An examination of the published literature. Accident Analysis & Prevention, 43, 516–532.
- Dong, Y., Hu, Z., Uchimura, K., & Murayama, N. (2011). Driver inattention monitoring system for intelligent vehicles: A review. IEEE Transactions on Intelligent Transportation Systems, 12, 596–614.
- Forsman, P. M., Vila, B. J., Short, R. A., Mott, C. G., & Van Dongen, H. P. A. (2013). Efficient driver drowsiness detection at moderate levels of drowsiness. Accident Analysis and Prevention, 50, 341–350.
- Gillberg, M., & Åkerstedt, T. (1998). Sleep loss and performance: no “safe” duration of monotonous task. Physiology & Behavior, 64, 599–604.
- Graham, R. (1999). Use of auditory icons as emergency warnings: evaluation within a vehicle collision avoidance application. Ergonomics, 42, 1233–1248.
- Grier, R. A., Warm, J. S., Dember, W. N., Matthews, G., Galinsky, T. L., Szalma, J. L., & Parasuraman, R. (2003). The vigilance decrement reflects limitations in effortful attention, not mindlessness. Human Factors Journal, Human Factors and Ergonomics Society, 45, 349–359.
- Helton, W. S., & Russell, P. N. (2011). Working memory load and the vigilance decrement. Experimental Brain Research, 212, 429–437.
- Helton, W. S., & Warm, J. S. (2008). Signal salience and the mindlessness theory of vigilance. Acta Psychologica, 129, 18–25.
- Hildreth, E. C., Beusmans, J. M. H., Boer, E. R., & Royden, C. S. (2000). From vision to action: Experiments and models of steering control during driving. Journal of Experimental Psychology, Human Perception and Performance, 26, 1106–1132.
- Horne, J. A., & Reyner, L. A. (1996). Counteracting driver sleepiness: Effects of napping, caffeine, and placebo. Psychophysiology, 33, 306–309.
- Langner, R., & Eickhoff, S. B. (2013). Sustaining attention to simple tasks: A meta-analytic review of the neural mechanisms of vigilant attention. Psychological Bulletin, 139, 870–900.
- Li, L., Cheng, J. C. K. (2011). Heading but not path or the tau-equalization strategy is used in the visual control of steering toward a goal. Journal of Vision, 11, 20–20.
- Lin, C.-T., Huang, K.-C., Chao, C.-F., Chen, J.-A., Chiu, T.-W., Ko, L.-W., & Jung, T.-P. (2010). Tonic and phasic EEG and behavioral changes induced by arousing feedback. NeuroImage 52, 633–642.
- Lin, C.-T., Huang, T.-Y., Liang, W.-C., Chiu, T.-T., Chao, C.-P., Hsu, S.-H., & Ko, L.-W. (2009). Assessing effectiveness of various auditory warning signals in maintaining drivers’ attention in virtual reality-based driving environments. Perceptual and Motor Skills, 108, 825–835.
- Lin, C.-T., Wu, R.-C., Liang, S.-F., Chao, W.-H., Chen, Y.-J., & Jung, T.-P. (2005). EEG-based drowsiness estimation for safety driving using independent component analysis. IEEE Xplore: Circuits and Systems I: Regular Papers, 52, 2726–2738.
- Liu, C. C., Hosking, S. G., & Lenné, M. G. (2009). Predicting driver drowsiness using vehicle measures: Recent insights and future challenges. J. Safety Research, 40, 239–245.
- Liu, Y.-C., & Wu, T.-J. (2009). Fatigued driver's driving behavior and cognitive task performance: Effects of road environments and road environment changes. Safety Science, 47, 1083–1089.
- Macuga, K. L., Beall, A. C., Kelly, J. W., Smith, R. S., & Loomis, J. M. (2006). Changing lanes: Inertial cues and explicit path information facilitate steering performance when visual feedback is removed. Experimental Brain Research, 178, 141–150.
- Otmani, S., Pebayle, T., Roge, J., & Muzet, A. (2005). Effect of driving duration and partial sleep deprivation on subsequent alertness and performance of car drivers. Physiology and Behavior, 84, 715–724.
- Phipps-Nelson, J., Redman, J. R., & Rajaratnam, S. M. W. (2011). Temporal profile of prolonged, night-time driving performance: Breaks from driving temporarily reduce time-on-task fatigue but not sleepiness. Journal of Sleep Research, 20, 404–415.
- Robert, G., & Hockey, J. (1997). Compensatory control in the regulation of human performance under stress and high workload: A cognitive-energetical framework. Biological Psychology, 45, 73–93.
- Sandberg, D., Akerstedt, T., Anund, A., Kecklund, G., & Wahde, M. (2011). Detecting driver sleepiness using optimized nonlinear combinations of sleepiness indicators. IEEE Transactions Intelligent Transportation Systems, 12, 97–108.
- Smallwood, J., Davies, J. B., Heim, D., Finnigan, F., Sudberry, M., O’Connor, R., & Obonsawin, M. (2004). Subjective experience and the attentional lapse: Task engagement and disengagement during sustained attention. Consciousness and Cognition, 13, 657–690.
- Smallwood, J., & Schooler, J. W. (2006). The restless mind. Psychological Bulletin, 132, 946–958.
- Smit, A. S., Eling, P. A., & Coenen, A. M. (2004). Mental effort affects vigilance enduringly: After-effects in EEG and behavior. International Journal of Psychophysiology, 53, 239–243.
- Thiffault, P., & Bergeron, J. (2003). Fatigue and individual differences in monotonous simulated driving. Personality and Individual Differences, 34, 159–176.
- Ting, P., Hwang, J., Doong, J., & Jeng, M. (2008). Driver fatigue and highway driving: A simulator study. Phyisology and Behavior, 94, 448–453.
- Van der Linden, D., Frese, M., & Meijman, T. F. (2003). Mental fatigue and the control of cognitive processes: Effects on perseveration and planning. Acta Psychologica (Amsterdam), 113, 45–65.
- Verwey, W. B., & Zaidel, D. M. (1999). Preventing drowsiness accidents by an alertness maintenance device. Accident Analysis and Prevention, 31, 199–211.
- Wallis, G., Chatziastros, A., & Bülthoff, H. (2002). An unexpected role for visual feedback in vehicle steering control. Current Biology, 12, 295–299.