
 ?Mathematical formulae have been encoded as MathML and are displayed in this HTML version using MathJax in order to improve their display. Uncheck the box to turn MathJax off. This feature requires Javascript. Click on a formula to zoom.
Abstract
Comparing many ways of measuring and analyzing reaction times reveals that the chosen method influences both the judged reaction time and, more importantly, conclusions about how the reaction time depends on the circumstances under study. The task was to lift one's finger in response to a tone. The response amplitude was either constrained or not. Constraining the amplitude made the response less vigorous. When the response was less vigorous it took longer to move far enough to release a switch or exceed the elasticity of the finger pulp. Although using a micro-switch would have made the reaction time appear to be longer for the constrained movement, reaction times determined in the most reliable ways were not systematically longer for the constrained movement. The most reliable method is to use extrapolation of the change in the average force that the finger exerts on the surface to estimate the reaction time.
Keywords:
Introduction
Reaction times can be used to judge how long it takes to process various things about external signals (Donders, Citation1868, Citation1969). Detecting the presence of a stimulus, recognizing it, selecting a suitable response, and planning and executing the response, all take time (Smeets, Oostwoud Wijdenes, & Brenner, Citation2016). It takes longer to initiate a motor response to a stimulus if the stimulus is less intense, if the stimulus has to be recognized rather than only detected, if there are several possible responses to choose from, and so on (Teichner & Krebs, Citation1972, Teichner & Krebs, Citation1974). Elaborate models have been designed to account for how reaction times depend on a variety of circumstances (Ratcliff, Van Zandt, & McKoon, Citation1999). We wondered whether the time taken to initiate a response depends on the characteristics of the response itself (Carlton, Carlton, & Newell, Citation1987; Christina, Fischman, Lambert, Moore, 1985; Henry & Rogers, Citation1960). In particular, we were interested in whether this is the case in a simple reaction time paradigm, when the required response is known in advance so that selecting a response is not an issue and a suitable movement could be planned before the stimulus appears. Does imposing constraints on the movement itself increase the time it takes to initiate the movement? If it does, the required response might have to be considered whenever we determine reaction-times. By imposing a simple constraint on a finger lifting movement we avoid the possible increase in reaction time that is found when the response consists of a sequence of movements (Henry & Rogers, Citation1960) that have not been practiced long enough to become a single action (Klapp, Citation1995).
Despite the vast literature on reaction times, there is no golden standard for determining them. When comparing reaction times for very different movements we obviously have to be very careful about how we determine the reaction times (Corcos, Gottlieb, Latash, Almeida, & Agarwal, Citation1992). If two finger movements start at the same moment, but the finger accelerates much faster in one movement than in the other, taking the moment the velocity reaches some threshold as the reaction time could incorrectly lead us to believe that the faster movement started earlier. We could compensate for the difference in velocity to some extent by scaling the velocity threshold by the peak velocity, but unless the movement amplitude is equivalently longer even this threshold will be reached earlier, because the whole movement will take less time so the equivalent position in the velocity profile corresponds with a shorter duration.
One way to reduce the problem mentioned above is by picking a very low threshold, but it is obviously critical that the threshold is large enough to only detect actual responses. One could base the threshold on the variability in the value of the measure that one is relying on near when the stimulus was presented. One could also combine various such methods, first finding a clear response and then working back from that response to find the onset (Teasdale, Bard, Fleury, Young, & Proteau, Citation1993). Alternatively, one could assume that the measure that one is using changes more or less linearly from motion onset and extrapolate the response back to its initiation (Oostwoud Wijdenes, Brenner, & Smeets, Citation2014). The latter method has been shown to be both accurate and precise when applied to mean acceleration traces of simulated minimal jerk movements with added measurement noise.
So how should we choose a method for determining the reaction time? In the absence of a golden standard we need to find some way to evaluate the various options. Determining the reaction time by using buttons does not circumvent the problem described above, because buttons always require some displacement to switch on or off (Tomberg, Levarlet-Joye, & Desmedt, Citation1991). Determining when the finger makes contact with a surface has the same problem, because the finger must be kept at some distance from the surface in order not to make contact before the response. Relying on losing contact with a surface does not solve the problem either, because contact is not broken as soon as the finger starts to move due to compression of the fingertip (Pawluk & Howe, Citation1999; Serina, Mote, & Rempel, Citation1997; Witney, Wing, Thonnard, & Smith, Citation2004; Wu, Dong, Smutz, & Rakheja, Citation2003). Moreover, when using a button or contact with a surface we have no way of telling whether the vigor of the response differs between conditions. Here, we examine how the method that one uses influences the judged reaction time. We compare reaction times determined with various methods, including what we would expect from determining reaction times with a button that requires a displacement of 0.5 mm. The main focus is on evaluating various options for determining the reaction time, and examining how they might influence the conclusions that we draw about our original question. The study also has a small contribution to make to the question whether imposing constraints on a movement increase the time it takes to initiate the movement, but obviously it can only answer that question for our modest constraint.
Methods
The task was to lift one’s finger in response to a tone as quickly as possible. There were two blocks of 50 trials that only differed in one respect: whether or not there was a straw above the finger that the subject should not hit. We will refer to the block with a straw as the constrained block and to the block without a straw as the unconstrained block. The blocks were performed in a single session with a break of a few minutes between them. We blocked the conditions so that subjects could plan their response well in advance.
The Subjects
The study is part of a research programme that has been approved by the local ethical committee. Nine right-handed subjects (two male, seven female; 18–23 years of age) took part in the study. All subjects were aware that we were interested in comparing auditory reaction times for constrained and unconstrained movements. They all provided written informed consent.
The Setup
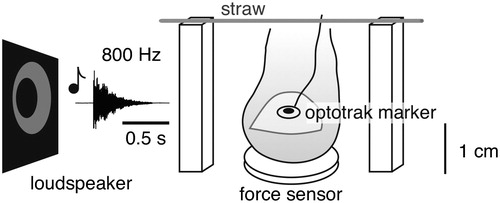
Subjects sat in front of a table with their right palm supported and their right index finger on a force sensor (ATI, Nano17 Ft). An Optotrak 3020 measured the position of a marker (an infra-red light emitting diode) attached to the nail of the finger at 800 Hz. The Optotrak’s Data Acquisition Unit registered the downward force exerted by the finger on the force sensor and the signal to the loudspeaker at 5000 Hz. There were two wooden bars (height: 28 mm) to the left and right of the force sensor. In the constrained block a drinking straw was placed across these two bars so that it was lying loosely above the finger ().
Figure 1. The experimental set-up. The subject placed his or her preferred index finger on a force sensor, and lifted it briefly whenever he or she heard a tone. In the constrained block of trials there was a straw above the finger that the subject had to be careful not to hit. In the unconstrained block of trials there was no such straw. We measured movements of the finger using a marker attached to the nail of the finger, and measured contact force using the force sensor that the finger was resting on.
Stimulus and Procedure
The tone that we used had a frequency of 800 Hz. Its amplitude gradually decreased from its onset, reaching zero after a bit more than half a second (see sample trace in ). It was identical on all trials. Within each block, the tones were presented at randomly chosen intervals of between 2 and 5 s (uniform distribution). When subjects heard the tone, they were to raise their finger as quickly as possible, and then to immediately place it back on the sensor and wait for the next tone. Four subjects first performed the block with the straw and the other five first performed the block without the straw.
Analysis
We compare various analyses with using a 0.5 mm vertical finger displacement threshold to determine the reaction time. We chose an amplitude that is clearly less than the displacement that is usually needed to release a button (Asundi & Odell, Citation2011; Rempel, Dennerlein, Mote, & Armstrong, Citation1994; Tomberg et al., Citation1991). We will refer to this method as using a button, although there was no actual button but a force sensor instead. As mentioned in the introduction, this method could be biased, because it will yield shorter reaction times for movements that start with a higher acceleration. We compared this method with various other methods. Each method was based on one of five measures: the finger’s vertical position, its vertical velocity, its vertical acceleration, the vertical contact force or the change in vertical contact force (force rate).
The methods also differed in various other aspects. One is that we either used the raw positions of the marker and the raw force on the sensor, or else we first smoothed these signals in one of two ways. One way of smoothing was the commonly used bidirectional Butterworth filter (effective cut-off frequency 25 Hz). For the raw and Butterworth-filtered signals, the velocity v and acceleration a were calculated by differentiating the vertical position y. The force rate was calculated by differentiating the vertical force F. This was done for each sample n, considering the sampling interval T that was 1.25 ms for position and 0.2 ms for force:
The other way of smoothing was by fitting a second order polynomial to the raw signal from 20 ms before to 20 ms after each moment. Doing so directly provides smoothed estimates for the derivatives (Smeets, Frens, & Brenner, Citation2002). We fit:
where value represents each vertical position or contact force, and t is the time relative to the moment in question, so that the moment itself is always at t = 0. In this case, the fit values of the polynomial for the sample in question provide smoothed estimates of the position (p), velocity (
) and acceleration (
), or of the smoothed force (p) and force rate (
).
We used three averaging methods for each of the five measures and three smoothing options. We either averaged the raw signals of all trials per subject and condition before determining the reaction time, or else we determined the reaction times for individual trials and then either considered the mean or the median value per subject and condition to represent the overall reaction time. The distinction between considering the mean or the median was also used for the “button”.
For each of the five measures, three smoothing options, and three averaging options, we used four ways to determine the reaction time. We chose four that differ quite fundamentally in their approach. The first two were based on the first moment at which a threshold was crossed. For the first, this threshold was 5% of the maximal value within that trial. For the second, the threshold was the mean plus three times the standard deviation during the period between 100 ms before and 100 ms after the tone. The third way we determined the reaction time was an elaborate method described by Teasdale et al. (Citation1993; algorithm B from that paper). It is based on first finding a clear response and then searching backwards to find its true onset (in short, starting with the value found with our first method, one searches back until the value is 0.25% of the peak, and then back from there until the value is less than one standard deviation above baseline). The fourth way we determined the reaction time was the extrapolation method described in Oostwoud Wijdenes et al. (Citation2014). It is based on drawing a line through the points in the response at which the value reaches 25% and 75% of its peak value, and then taking the time at which this line crosses the baseline as the reaction time (again we used the average value between 100 ms before and 100 ms after tone onset as the baseline).
To get a global impression of the differences in the obtained reaction times we plot smoothed histograms of their distributions as well as their raw cumulative distributions. To obtain smoothed histograms we determined for each possible reaction time (t), where RTi is the encountered reaction time on trial i. Thus, we sum over all the trials for each possible reaction time, with each encountered reaction time contributing to the sum by an amount that depends on its distance from the time t, so that the closer the reaction time to t, the less negative the value of the exponent, and the larger the contribution to the sum. We used a value of σ = 5 ms. We normalized the histograms so that the regions under the curves would all have an area of 1. An advantage of using such smoothed histograms rather than conventional histograms is that one does not need to decide how to place the bins.
For each of the nine subjects and each of the two conditions we have 182 estimated reaction times (the 60 combinations of the five measures, three smoothing options, and four ways of determining the reaction time when relying on the average response, and 61 combinations each when relying on the mean and median estimates of reaction times on individual trials, because we also consider the “button” method when relying on individual trials). The reaction times determined by using different methods obviously differ. How can we decide which method is best? We mainly consider a reaction time to be good if it is reliable, but we also check that a method of determining the reaction time does not consistently give values that we intuitively know to be wrong, such as giving values below 50 ms. Thus, although we always consider all the data in our search for a reliable method of determining the reaction time, we check that the average value that emerges from a method of determining the reaction time is reasonable so that we do not inadvertently end up trusting a method that very reliably gives an estimate that is close to zero.
One way in which we tested reliability was by bootstrapping the data. For each subject and method we randomly picked 50 trials (ignoring whether a trial had already been picked) and determined the reaction time for this set of trials. We did this 1000 times and determined the standard deviation in the 1000 resulting reaction times. The smaller the standard deviation, the more robust (reliable) we consider the method to be. Another way of testing reliability is by checking how sensitive various methods are to smoothing, and thus to noise in the data, and how sensitive the methods are to the way of averaging the data. We examined this by determining the root mean square differences between the reaction times judged from the same data when smoothed or averaged differently. In general, any choice that makes other choices less important is considered to make the estimate more reliable. Finally, we examined how one’s choices would influence the conclusion about the influence of constraints by determining the fraction of combinations involving particular choices for which one would have concluded that the constraints have an effect on the basis of a paired t-test.
Results
Three of the 900 trials were excluded from the analysis because the finger moved before tone onset. Most subjects lifted their finger higher when there was no straw constraining their movements than when they had to make sure not to hit the straw (the mean difference between the median heights is 14 mm; t8=3.13, p = 0.014). On average, their fingers reached the 0.5 mm threshold 15 ms sooner after tone onset when there was no straw (mean difference between median reaction times; t8=3.7, p = 0.006), so if we had used a button to determine the reaction time we would probably have concluded that the constraints imposed by the straw increased the reaction time.
As was to be expected, the different methods of determining the reaction time yield quite different values. illustrates 41 of the 61 ways in which we determined the reaction time for an individual trial (doing so after polynomial smoothing is not shown). Some differences that we see are easy to explain. For instance, finding the first moment at which the signal reaches 5% of its peak value gives an unrealistic reaction time (close to zero) when the signal is very noisy (unsmoothed acceleration and force rate). This also influences Teasdale’s method, because that method cannot give a later response than using 5% of the peak, because Teasdale’s method searches back in time from that value to find the ‘true’ onset. The fact that we understand why some of the differences occur does not directly tell us which is the best method, but it does suggest that certain combinations are less likely to be useful for determining reaction times. Since there are too many combinations (182) to consider each of them separately, we examined how certain choices influence the outcome, irrespective of the other choices that are made, in the hope that doing so would help us find a suitable method.
Figure 2. Determining the reaction time from the marker’s vertical positions and the vertical contact forces for one example trial. The left part shows the unsmoothed signals (position and force) and measures based on these signals (velocity, acceleration and force rate). The right side shows the same measures after smoothing the signals with a Butterworth filter at 25 Hz. Time is defined with respect to tone onset. The grey dotted line intersecting the raw position trace is the 0.5 mm displacement threshold of the simulated button. The vertical lines below the traces indicate the reaction times according to the different ways of determining the reaction time (color coded). Note how the different measures and methods give rise to quite diverse reaction times.
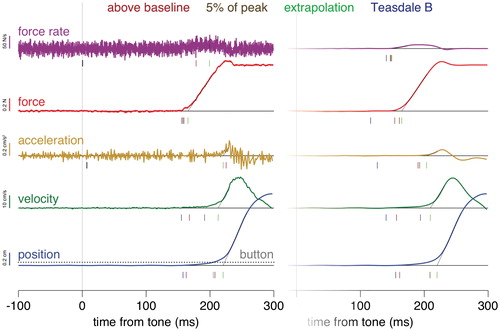
The first thing we want to know is which of the differences that we see in are systematic. It is evident from that some methods give very incorrect results if one does not first smooth the data, so we will initially only consider signals that were smoothed with a Butterworth filter (and the Button), and compare the five measures, three averaging methods and four ways of determining the reaction time. After doing so we will also consider the sensitivity to smoothing.
We can see from the left panel of that relying on measures based on the force signal (red and purple curves) gives shorter reaction times than relying on measures based on the position signal. This is not surprising given that the finger cannot start moving until the exerted force exceeds the force of gravity (if we ignore compression of the fingertip). Other than that, using force rate gives earlier responses than using the force itself, and using acceleration gives slightly earlier responses than using velocity that in turn gives slightly earlier responses than using position (differentiating the signal brings one closer to the initial response). Using a ‘button’ gives the longest reaction times. Importantly, the distribution of reaction times is also narrower for the force-based measures.
Figure 3. Distribution of reaction times for the five measures, three averaging methods and four ways of determining the RT, after smoothing the data with a Butterworth filter. Combined data for all subjects in both the constrained and unconstrained conditions. When relevant, the “button” data are also shown for comparison. Top graphs: the fractions of encountered reaction times that were shorter or equal to the value on the horizontal axis. Bottom graphs: smoothed fractions of trials for each value of the reaction time. The numbers in the top graphs give the median reaction time in ms.
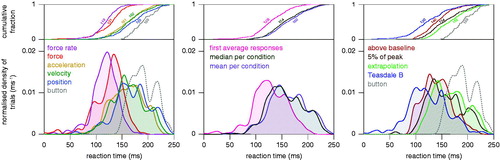
We can see from the middle panel of that first averaging the responses generally gives shorter reaction times. This is not surprising, because some of the methods are designed to detect the very earliest deviation. Applying a method that successfully determines the very earliest deviation to an average response will provide a reaction time that corresponds with the shortest reaction time, rather than with the average reaction time. We can also see that taking the median gives slightly lower reaction times than taking the mean. This is because distributions of reaction times are skewed as a result of one not being able to respond much earlier but being able to respond much later than usual. That is why the median is generally considered to be a better measure for reaction times. Miller (Citation1988) has pointed out that taking the median of a small sample does not completely compensate for the distribution being skewed, because the longer reaction times are more longer than that the shorter ones are shorter, but for our sample size this effect is probably negligible.
We can see from the right panel of that there are systematic differences between the reaction time distributions when relying on different ways to determine the reaction time. Not surprisingly, Teasdale’s method gives the shortest reaction times. It was specifically designed to find the very first response. Detecting when the signal clearly leaves the baseline gives lower values than waiting until it reaches 5% of the peak value. The extrapolation method gives even longer reaction times, probably because extrapolating the signal back to its onset is based on the assumption that there is an abrupt onset followed by a linear increase in signal magnitude, whereas the responses observed in single trials are not abrupt and linear (see ).
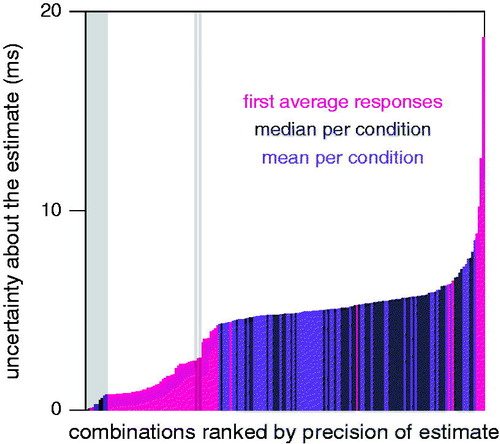
shows that first averaging the responses on all trials and then determining the reaction time (pink bars) provides a more robust estimate than determining the reaction times for all trials separately and then calculating the mean or median reaction time. The only other combinations of methods for which the standard deviation of the bootstrapped reaction times was less than 2 ms were combinations that estimated unrealistically short reaction times (as indicated by the grey background). In terms of robustness, there was no consistent advantage of using a specific measure or way of determining the reaction time (not shown).
Figure 4. Standard deviation of the reaction times of the bootstrapped data for each combination of the five measures, three averaging options, three smoothing options and four ways of determining the reaction time. Combinations for which the mean reaction time was less than 50 ms are indicated by a grey background. This figure shows that first averaging the responses (pink bars) usually gives the most robust judgments of the reaction time. Combined data for all subjects in both the constrained and unconstrained conditions. The first six bars after the grey background on the left represent applying the extrapolation method to the force or position measurements, with or without either of the smoothing options.
First averaging the responses and then determining the reaction time apparently generally provides the most robust estimates, but does it provide the estimate that we want? Does the mean or median of the reaction times on individual trials not better reflect our intuition about the reaction time? As already mentioned, first averaging and then determining the initial response might give us an estimate of the response on the fastest trial, rather than on a typical trial. Such issues can be avoided by using a method that is robust with respect to the moment and method of averaging. It should give a similar estimate when applied to the average response as when applied to individual responses and then averaging the estimates. The left part of provides a measure of the sensitivity to the order in which one averages and determines the reaction time. The differences in sensitivity are modest, but using either a threshold of 5% of the peak response or the extrapolation method to estimate the reaction time from force signals, appears to be slightly less sensitive than all the other methods.
Figure 5. Extent to which averaging differently or smoothing differently results in a different estimate of the reaction time. Left: difference between the reaction time judged on the basis of the mean response and the median of the reaction times based on responses in individual trials. Right: difference between reaction times based on the raw data, data smoothed with a Butterworth filter, and data smoothed by fitting a polynomial (mean of the three possible differences). In both cases, mean values are shown for each measure and way to determine the reaction time (three standard deviations above baseline, 5% of peak amplitude, extrapolation method, Teasdale’s method B). The values are root mean squares of the differences, averaged across the constrained and unconstrained conditions (with and without straw) and the nine subjects.
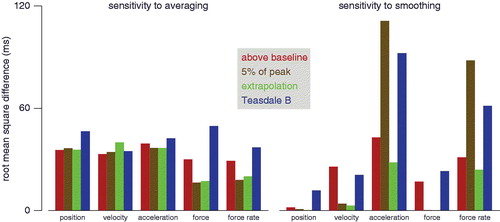
The analyses shown in and the left part of only consider responses that were smoothed with a Butterworth filter. We want our method to be robust with respect to the way in which the signal is smoothed, because otherwise it will be very important to justify the precise smoothing choices for every study. We therefore also determined the sensitivity to smoothing the responses. We restricted this analysis to determining the reaction time from the average response, because we have already seen that this is the most robust method of determining the reaction time () and it is evident that some methods will not work well without smoothing if we do not first average the responses (). First averaging the responses is a kind of smoothing, because random high-frequency fluctuations will average out while consistent more gradual responses will not, so additional smoothing may no longer be important after averaging the responses.
The right part of shows the sensitivity to our three smoothing options. The sensitivity depends both on the measure used and on the way of determining the reaction time. In general, differentiating the position and force signals appears to make them more sensitive to the smoothing choices, which is not too surprising because doing so increases the relative amplitude of random variability (). Also not too surprisingly, the extrapolation method is the least sensitive to smoothing. Relying on variability in the baseline, either alone (above baseline) or in combination with other measures (Teasdale B), is obviously sensitive to smoothing of that part of the signal. Using 5% of the peak response as a threshold is not very sensitive to smoothing for the less noisy signals (here position, velocity and force), but is very sensitive for noisy signals (acceleration and force rate). Noisy signals can have very brief peaks that cross the threshold even when there is no real response.
Considering the results shown in , it would appear that under our conditions the best way to determine the reaction time is to measure the contact force, average it across trials, and then use the extrapolation method to determine the reaction time. If we were to do this, without any smoothing, we would conclude that the additional constraints imposed by the straw do not influence the reaction time (the reaction time was 0.3 ms shorter when there was a straw; t[8] = 0.08; p = 0.94). This is a different conclusion than we would obtain if we had relied on the ‘button’, in which case we would conclude that the straw increases the reaction time significantly (by 15 ms).
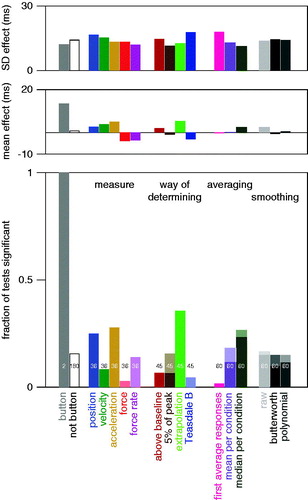
More generally, we can examine how making different choices would influence our conclusion as to whether the straw influences the reaction time. shows that although using a button would lead to the conclusion that the straw has an effect, most combinations of measures, smoothing options, averaging options and ways of determining the reaction time would not. However, there are a few combinations that would lead to the conclusion that the straw increases the reaction time, and there are even a few that would lead to the conclusion that it decreases the reaction time, so the choice is really relevant and not just a matter of preference.
Figure 6. Extent to which different methods would lead to different conclusions. Bottom panel: fraction of options for which a t-test would lead to the conclusion that constraining the movement influences the reaction time. The numbers indicate the number of options that are considered. For the ‘button’ there are two options: taking the mean or the median of the values for each subject. The remaining options (not button) consist of all 180 combinations of the five measures, four ways of determining the reaction time, three ways of averaging, and three ways of smoothing. Pale areas at the tops of the bars (filling the whole bar for the force, force rate and Teasdale B bars) indicate that responses were significantly earlier when the movement was constrained. Middle panel: average magnitude of the effect (how much longer is the reaction time for constrained movements). Top panel: average standard deviation of the magnitude of the effect.
Discussion
In this study we examined how the method that one uses to determine the reaction time influences the value that one obtains. We used a simple reaction-time task in which subjects had to raise their finger as soon as they heard a tone. We determined the reaction time in many ways on the basis of various measures and found that how one determines the reaction time can make a big difference, both to the value that one estimates for the reaction time (see and ) and to the conclusion that one draws from the study (based on the difference between reaction times for different conditions; see ). Therefore, if one intends to test a hypothesis about reaction times, one should decide how one will determine the reaction time before collecting the data, to ensure that one is not tempted to base one’s choice on the outcome that one would like.
Irrespective of whether we rely on the method that we consider to be the most reliable (using the extrapolation method to determine the reaction time from the average contact force across trials) or just take the most common outcome considering all the options that we tried, our conclusion is that the additional constraints imposed by the straw did not systematically increase the response time. Assuming that this conclusion is correct, first averaging the responses and then determining the reaction time on the basis of the average signal seems to be the most important decision to make ( and ).
Relying on the decrease in the contact force with the surface to judge the reaction time obviously gives an earlier estimate of the onset of the response than relying on increases in the vertical position, velocity or acceleration of the finger (left panel of ). If the finger were completely rigid, activating the muscles would initially lead to a reduction of the force of the finger on the table, and the finger would only start to move upwards once the contact force was zero. The finger pulp is not completely rigid, so the nail (with the Optotrak marker; see ) starts to move before skin contact is lost. This can be seen in . From the force trace we can deduce that contact is lost about 220 ms after the tone on this trial. The position and velocity traces change much more gradually until then than they do after contact is lost. This initial gradual change is ignored by the extrapolation method. A slow change also takes longer to reach any threshold. Therefore, the latency is shorter when based on force, although the finger probably does actually start to move as soon as the force starts to decrease. Something similar is likely to occur when determining the onset of movements that slide across a surface, and must therefore overcome static friction, but not when determining the latency of on-line adjustments of movements through empty space (which is what the method was originally designed for; Oostwoud Wijdenes et al., Citation2014). The difference between the reaction times that we estimated from the change in force (which is presumably directly related to muscle activation) and those that we estimated by simulating releasing a button, is similar to the difference that has previously been demonstrated between determining the reaction time from muscle activation and from releasing an actual button (Weiss, Citation1965; in both cases the difference is about 65 ms).
Thus, the reaction times that are judged when using different methods differ considerably, so if one wants to compare one’s findings with the reaction times reported in other studies, it is essential to consider exactly how the reaction times were determined (Corcos et al., Citation1992), and in some cases also how noisy the measured signals were in the studies in question. We examined a number of quite different methods of determining the reaction time, but there are obviously countless alternatives. One could use a different method to smooth the data or a different amount of smoothing, one could remove outliers before averaging, one could determine the median rather than the mean signal, one could search back from the peak until the signal drops below 5% of the peak amplitude rather than searching from the beginning until the signal is higher than 5%, one could fit the response pattern that one expects to the data rather than fitting a straight line irrespective of the measure (Staude, Citation2001), one could ask people to press a button rather than to release it, and so on. Irrespective of how one chooses to determine the reaction time, comparing reaction times across studies will have to be done very cautiously unless the methods were precisely the same.
In our study, we measured finger movements and force. An alternative that we mentioned only briefly is to rely on electromyography (EMG) to determine the reaction time (Carlton et al., Citation1987). Changes in the electrical potentials in muscle cells should tightly correspond with changes in the force that they exert. However, slightly different movements, due to slightly different constraints, may make people use their muscles to different extents (Tax, Denier van der Gon, & Erkelens, Citation1990), so measuring the EMG at one location may give a wrong impression. Moreover, detecting the onset of EMG is no easier than detecting the onset of any other noisy signal, so similar methodological issues need to be considered to those discussed here (Hodges & Bui, Citation1996). Thus, although relying on EMG recordings may be a good alternative to relying on force in some cases, it remains to be seen whether reaction times based on EMG measurements can be as reliable as (or maybe even more reliable than) ones based on measuring force. The absence of an evident ‘true’ reaction time means that we have no a priori reason to consider the onset of muscle activity to be a better or less suitable measure than for instance the moment at which the finger has reached some threshold velocity. However, we have shown that what you chose does matter. Since reaction times are often used to compare conditions we consider the most reliable method to be the best, but if your aims are different the correct choice may be too.
Earlier Evidence That Constraining the Movement Does Not Influence the Reaction Time
Christina et al. (Citation1985) reported that simple reaction times were longer if the required response was more complex. They manipulated complexity both by varying the required endpoint accuracy and by asking subjects to initiate sequences of different numbers of movements in response to a tone. They used a physical switch to measure reaction times, and mainly found an effect for the latter manipulation. Importantly, the instruction in their study was to complete the whole action as quickly as possible, so it is possible that starting to move as quickly as possible was not equally important in all conditions. In our study the only task was to lift the finger, with the constraint only influencing the extent to which one was allowed to move after starting to do so. This makes it completely clear that only the reaction time matters. Lajoie and Franks (Citation1997) reported that reaction times were longer when first moving to a far and then a near target in rapid succession than when stopping at the far target. They also reported that reaction times were longer for smaller targets (also see Sidaway, Citation1991). However, Lajoie and Franks (Citation1997) did not find longer reaction times for large targets than when there was no target at all so that participants only had to move in the right direction, which is the most similar comparison to the one in our study. Thus, their study suggests that more severe constraints than ours may influence the reaction time.
In accordance with our findings, Garry and Franks (Citation2000) reported that characteristics of the movement after onset do not influence the timing of the onset itself. One difference between their study and ours is that we do find such a difference if we use a simple displacement threshold to simulate the release of a button. Garry & Franks (Citation2000) report that using a velocity threshold gives similar results to using thresholds based on EMG onset, and subsequently only report the latter. For the single-arm movements in their study the difference in reaction time was in the expected direction, but in the overall statistical analysis the factor target size (which they varied to manipulate task difficulty after movement onset) did not have a significant effect. Our finding that the estimated reaction times are almost identical with and without the additional constraint provides stronger support for the notion that additional constraints do not influence the processing time. Note that we made sure that the response itself could be fully planned in advance. Possibly, if the additional constraints were not known in advance, planning would have taken longer for the more constrained movements.
Virtues of the Extrapolation Method
The extrapolation method is quite simple to implement and to comprehend. It has been shown to reliably extract the known reaction time from simulated movements (minimal jerk trajectories that are known to resemble human movements; Hogan & Flash, Citation1987), especially when it is applied to changes in acceleration across time (Oostwoud Wijdenes et al., Citation2014). We here confirm that this method also works well for determining the reaction time from real data.
One reason why this method works so well is that it considers more of the response than just the onset. This makes it less sensitive to measurement noise and smoothing artefacts than methods that more directly aim at finding the onset itself. It also allows one to average the responses before judging the reaction time without the reaction time then representing the shortest rather than the median reaction time. One important aspect of the extrapolation method is that it disregards the details of the initial part of the movement. When movements start gradually rather than abruptly, for instance due to the gradual expansion of the finger pulp, using the extrapolation method on position data will give an onset that is slightly but systematically later than what we might intuitively consider to be the onset (and would find with other methods; see for an example that shows that this tendency is actually present irrespective of the measure that one relies on). Nevertheless, if the goal is to determine whether the reaction times differ between two conditions, we believe that this method is a good choice, combining simplicity with reliability. Thus, for most purposes, it would appear that applying the extrapolation method to averaged force responses is the best method for estimating reaction times.
Acknowledgments
We thank Rik Pijnenburg and Roxanne Frauenfelder for their help in running the experiments and conducting a preliminary analysis of the data.
DISCLOSURE STATEMENT
No potential conflict of interest was reported by the authors.
References
- Asundi, K., & Odell, D. (2011). Effects of keyboard keyswitch design: A review of the current literature. Work (Reading, Mass.), 39(2), 151–159.
- Carlton, L. G., Carlton, M. J., & Newell, K. M. (1987). Reaction time and response dynamics. Quarterly Journal of Experimental Psychology, 39(2), 337–360.
- Christina, R. W., Fischman, M. G., Lambert, A. L., & Moore, J. F. (1985). Simple reaction time as a function of response complexity: Christina et al. (1982) revisited. Research Quarterly for Exercise and Sport, 56(4), 316–322.
- Corcos, D. M., Gottlieb, G. L., Latash, M. L., Almeida, G. L., & Agarwal, G. C. (1992). Electromechanical delay: An experimental artifact. Journal of Electromyography and Kinesiology, 2(2), 59–68.
- Donders, F. C. (1868). Over de snelheid van psychische processen. Onderzoekingen Gedaan in Het Physiologisch Laboratorium Der Utrechtsche Hoogeschool, 1868–1869, Tweedereeks,II, 92–120.
- Donders, F. C. (1969). On the speed of mental processes. Acta Psychologica, 30, 412–431.
- Garry, M. I., & Franks, I. M. (2000). Reaction time differences in spatially constrained bilateral and unilateral movements. Experimental Brain Research, 131(2), 236–243.
- Henry, F. M., & Rogers, D. E. (1960). Increased response latency for complicated movements and a “Memory Drum” theory of neuromotor reaction. Research Quarterly. American Association for Health, Physical Education and Recreation, 31(3), 448–458.
- Hodges, P. W., & Bui, B. H. (1996). A comparison of computer-based methods for the determination of onset of muscle contraction using electromyography. Electroencephalography and Clinical Neurophysiology, 101(6), 511–519.
- Hogan, N., & Flash, T. (1987). Moving gracefully: Quantitative theories of motor coordination. Trends in Neurosciences, 10(4), 170–174.
- Klapp, S. T. (1995). Motor response programming during simple and choice reaction time: The role of practice. Journal of Experimental Psychology: Human Perception and Performance, 21(5), 1015–1027.
- Lajoie, J. M., & Franks, I. M. (1997). Response programming as a function of accuracy and complexity: Evidence from latency and kinematics-measures. Human Movement Sciences, 16(4), 485–505.
- Miller, J. (1988). A warning about median reaction time. Journal of Experimental Psychology. Human Perception and Performance, 14(3), 539–543.
- Oostwoud Wijdenes, L., Brenner, E., & Smeets, J. B. J. (2014). Analysis of methods to determine the latency of online movement adjustments. Behavior Research Methods, 46(1), 131–139.
- Ratcliff, R., Van Zandt, T., & McKoon, G. (1999). Connectionist and diffusion models of reaction time. Psychological Review, 106(2), 261–300.
- Pawluk, D. T. V., & Howe, R. D. (1999). Dynamic contact of the human fingerpad against a flat surface. Journal of Biomechanical Engineering, 121(6), 605–611.
- Rempel, D., Dennerlein, J., Mote, C. D., Jr., & Armstrong, T. (1994). A method of measuring fingertip loading during keyboard use. Journal of Biomechanics, 27(8), 1101–1104.
- Serina, E. R., Mote, C. D., Jr., & Rempel, D. (1997). Force response of the fingertip pulp to repeated compression-effects of loading rate, loading angle and anthropometry. Journal of Biomechanics, 30(10), 1035–1040.
- Sidaway, B. (1991). Motor programming as a function of constraints on movement initiation. Journal of Motor Behavior, 23(2), 120–130.
- Smeets, J. B. J., Frens, M. A., & Brenner, E. (2002). Throwing darts: Timing is not the limiting factor. Experimental Brain Research, 144(2), 268–274.
- Smeets, J. B. J., Oostwoud Wijdenes, L., & Brenner, E. (2016). Movement adjustments have short latencies because there is no need to detect anything. Motor Control, 20(2), 137–148.
- Staude, G. H. (2001). Precise onset detection of human motor responses using a whitening filter and the log-likelihood-ratio test. IEEE Transactions on Bio-Medical Engineering, 48(11), 1292–1305.
- Tax, A. A., Denier van der Gon, J. J., & Erkelens, C. J. (1990). Differences in coordination of elbow flexor muscles in force tasks and in movement tasks. Experimental Brain Research, 81(3), 567–572.
- Teichner, W. H., & Krebs, M. J. (1972). Laws of the simple visual reaction time. Psychological Review, 79(4), 344–358.
- Teichner, W. H., & Krebs, M. J. (1974). Laws of visual choice reaction time. Psychological Review, 81(1), 75–98.
- Teasdale, N., Bard, C., Fleury, M., Young, D. E., & Proteau, L. (1993). Determining movement onsets from temporal series. Journal of Motor Behavior, 25(2), 97–106.
- Tomberg, C., Levarlet-Joye, H., & Desmedt, J. E. (1991). Reaction times recording methods: reliability and EMG analysis of patterns of motor commands. Electroencephalography and Clinical Neurophysiology, 81(4), 269–278.
- Weiss, A. D. (1965). The locus of reaction time change with set, motivation, and age. Journal of Gerontology, 20, 60–64.
- Witney, A. G., Wing, A., Thonnard, J.-L., & Smith, A. M. (2004). The cutaneous contribution to adaptive precision grip. Trends in Neurosciences, 27(10), 637–643.
- Wu, J. Z., Dong, R. G., Smutz, W. P., & Rakheja, S. (2003). Dynamic interaction between a fingerpad and a flat surface: Experiments and analysis. Medical Engineering &Amp; Physics, 25(5), 397–406.