
 ?Mathematical formulae have been encoded as MathML and are displayed in this HTML version using MathJax in order to improve their display. Uncheck the box to turn MathJax off. This feature requires Javascript. Click on a formula to zoom.
Abstract
The aim of the present research is to test whether resilience in a motor task enhances or diminishes when encountering stressors. We conducted a lateral movement task during which we induced stressors and tracked the movement accuracy of each participant over time. Stressors corresponded to organismic constraints (i.e., visual occlusion), task constraints (i.e., movement sensitivity), or both types of constraints in an alternating pattern. In order to determine resilience, we introduced a measure combining the strength of a stressor and the relaxation time. Across the three conditions, we found that resilience was enhanced rather than diminished over time. This supports the notion that stressors in the form of constraint alterations can be beneficial to human motor performance.
Introduction
In order to successfully complete a motor task, humans constantly need to adapt to changing elements in their environment. For example, when walking on a busy street, a pedestrian constantly needs to stop or change their movement direction to avoid collisions with others. Thus, each oncoming obstacle disrupts the desired motor pattern. Events to which an organism needs to adapt either structurally or behaviorally are referred to as stressors (Hill et al., Citation2020; Kiefer et al., Citation2018; Sato et al., Citation2006). The process by which humans positively adapt to stressors is called resilience (see for reviews, Galli & Gonzalez, Citation2015; Hill et al., Citation2018a; Sarkar & Fletcher, Citation2014). Based on the consensus that resilience is a dynamic process, which emerges from the dynamic interactions between various factors (Carver, Citation1998; Egeland et al., Citation1993; Fletcher, Citation2018), Hill and colleagues (2018b) defined resilience as “the dynamic process by which a biopsychosocial system returns to the previous level of functioning following a perturbation caused by a stressor” (p. 367). To date, however, few studies have focused on the temporal process of resilience during human performance. In the current study, we aim to take a next step by mapping out how the resilience process unfolds over time and exploring how it changes with exposure to repeated stressors.
The Resilience Process
In order to study resilience in humans, two key elements are required. First, a stressor needs to occur and second, the adaptation to the stressor has to be captured (e.g., Galli & Gonzalez, Citation2015; Sarkar & Fletcher, Citation2013). These stressors can be of different types. Individuals need to adapt to ongoing changes in a dynamic environment as well as changing components within themselves, such as physiological structures (e.g., muscles), and psychological factors (e.g., self-efficacy, Balagué et al., Citation2017; Davids et al., Citation2003; Den Hartigh et al., Citation2018; Kelso et al., Citation1986; Newell, Citation1991, Seifert et al., Citation2013, Citation2016). Because alterations in constraints foster adaptations in the motor system, they can be understood as stressors (i.e., events that foster adaptations in an organism, Hill et al., Citation2020; Kiefer et al., Citation2018; Sato et al., Citation2006). In line with the conceptualization of motor development by Newell (Citation1986), the changing components that foster adaptation may include task (i.e., relative to task goal) or organismic (i.e., within the movement system) constraints. Although the structural adaptation may differ across the stressors, the functional output (i.e., the return to the previous level of functioning), observable in the level of functioning over time, may be similar. This means that an alteration of a task constraint may trigger different structural changes in the performer-environment interaction than an alteration of an organismic constraint. However, the process of returning to the previous level of functioning should be observable following both types of constraint alterations.
Do Repeated Stressors Enhance or Diminish Resilience?
A large body of literature has shown that constraint alterations during a motor task can help an individual learn how to effectively adapt to changes in the environment as well as increase the overall task performance (e.g., Davids et al., Citation2008; Renshaw et al., Citation2010; Renshaw & Chow, Citation2019). Furthermore, because expertise in movement may be conceptualized as the ability to adapt to altered constraints, Schöllhorn and colleagues (2006, 2009, 2010, 2012) have shown the benefits of training this adaptability by introducing randomness to various training programs. The randomness induced by constraint changes may cause individuals to actively seek out new motor solutions to adapt to the environment (Latash, Citation2012). Therefore, stressors, such as constraint alterations, may be necessary for humans to develop adaptability in their motor patterns. Following this line of reasoning, the adaptation process improves when a system is exposed to changing constraints. This means that a system returns more quickly to its previous level of functioning when encountering a subsequent stressor, thus enhancing its resilience (Hill et al., Citation2018b) or move to a higher level of functioning.
On the other hand, a large body of literature on complex biological systems has shown that repeated stressors may have the opposite effect and diminish resilience, rather than enhance it. Specifically, when exposed to repeated stressors, systems may lose their resilience, which causes (a) increasingly more time for a system to return to the previous level of functioning, and (b) increased sensitivity to perturbations caused by stressors (Scheffer et al., Citation2009, Citation2012, Citation2018). For example, a particular period indicating resilience loss called critical slowing down has been observed in eco-systems (Drake & Griffen, Citation2010; Scheffer et al., Citation2009, Citation2012), population density (Dai et al., Citation2012), psychopathology (Van de Leemput et al., 2014), and motor systems (Bardy et al., Citation2002). During this period a system requires increasingly more time to return to its previous level of functioning following a perturbation caused by a stressor (i.e., increasing relaxation time) and becomes increasingly sensitive to stressors. This means that during critical slowing, encountering a relatively minor stressor that would normally be overcome may already be sufficient to cause a transition to an undesired state (Kelso, Citation1984; Schöner & Kelso, Citation1988; Van de Leemput et al., 2014). Accordingly, research on coordination dynamics has shown that alterations to the amplitude of a movement (De Poel et al., Citation2020) and restricting visual information (Bootsma et al., Citation2002; Cuijpers et al., Citation2019; Richardson et al., Citation2007) during a rhythmic motion task can severely disrupt the coordinated motor performance. For example, Bootsma and colleagues (2002) showed that repeated restriction of visual information forced individuals to adapt their movement patterns and reduce their movement time, similar to effects of increased task difficulty. Therefore, stressors such as sensitivity changes (i.e., task constraint) and visual information (i.e., organismic constraint) may undermine the resilience of a movement system.
Analyzing Resilience in Time-series
In order to analyze resilience and how it changes with repeated stressors, the level of functioning to which the system returns to following the stressor first needs to be defined. To capture how this level of functioning changes over time in response to a stressor, a time-series of a representative variable may be collected (cf. Araújo et al., Citation2015; Den Hartigh et al., Citation2017). The frequency at which the level of functioning is measured should contain a signal-to-noise ratio that ensures that the process of interest is measured with an adequate resolution (Dejonckheere et al., Citation2020). For example, if a researcher is interested in how an individual adapts their movement pattern to avoid a suddenly occurring obstacle while trying to grasp an object, measuring the individual’s movement at a frequency of one measurement per minute may capture neither the occurrence of the stressor, nor the adaptation process, which is likely to occur within milliseconds to seconds. Second, the time-point of the stressor’s occurrence needs to be identified (Hill et al., Citation2018a). In experimental settings, it is therefore helpful to design studies during which stressors can be introduced at specific moments in time. Tracking the time-serial data following the occurrence of a stressor allows to infer the system’s resilience in response to the event.
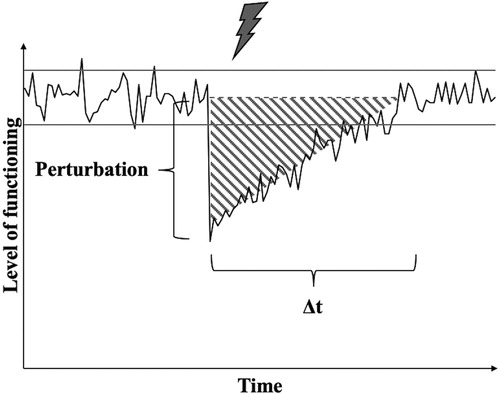
Collecting time-serial data may indicate both the strength of the deviation from the equilibrium following the stressor (Holling, Citation1973) and the time it takes the system to return to this level of functioning (Bardy et al., Citation2002; Scheffer et al., Citation2009; Schöner et al., Citation1992). Combining these indices yields the Area Under the Curve (AUC, see ) which represents the deviation from the level of functioning (Bruneau et al., Citation2003). In case the perturbation strength increases when repeatedly encountering stressors with the same or a similar magnitude, the stress sensitivity would be said to increase. Thus, if the stress sensitivity increases, while the relaxation time stays stable or vice versa, the AUC would indicate a larger deviation from the level of functioning and thus lower resilience of the system.Footnote1 This is in line with the observations of resilience losses in systems during critical slowing down: The systems become more sensitive to minor stressors and/or require more time to return to the previous level of functioning (e.g., Bardy et al., Citation2002; Scheffer et al., Citation2009, Citation2012). In contrast, a decrease in relaxation time or stress sensitivity with repeated stressors, while the other parameter stays stable, would indicate increased resilience.
Figure 1. Illustration for quantification of the dynamic process of resilience. The black line represents the level of functioning over time in response to the exposure to a stressor (gray lightning bolt). The gray dotted line represents the expected level of functioning in the absence of a stressor with its confidence interval (gray solid lines). “Perturbation” marks the strength of the deviation from the level of functioning and “Δt” represents the time the system needs to return to its previous level of functioning (i.e., relaxation time). The shaded area under the curve (AUC) determines the resilience of the system in response to the stressor.
The Current Study
In this study, we aim to test a how the resilience of a motor system changes when exposed to repeated stressors during a rhythmic movement task. To induce the stressors, we manipulated organismic constraints (i.e., visual occlusion), task constraints (i.e., movement sensitivity), or both types of constraints in an alternating pattern. According to the literature on the effect of constraints on motor learning, it may be hypothesized that repeatedly altering constraints enhances the adaptability of a motor system and consequently its resilience (Davids et al., Citation2003, Citation2008; Renshaw & Chow, Citation2019; Renshaw et al., Citation2010). However, in line with the observation that systems lose resilience following a series of stressors (Dai et al., Citation2012; Drake & Griffen, Citation2010; Scheffer et al., Citation2009, Citation2012; Van de Leemput et al., 2014), a competing hypothesis is that the exposure to repeated stressors in form of constraint alterations diminishes resilience. To detect changes in resilience in response to the constraint alterations, we apply AUC calculations that map out how strongly the level of functioning (i.e., movement accuracy) is reduced and how long the participant needs to return to the previous level of functioning following any given stressor (Bruneau et al., Citation2003).
Method
Participants
A total of 63 first-year psychology students signed up to participate in the current study in exchange for course credits. Because of technical problems during the data collection four (6.35%) participants were removed from the sample. The final sample consisted of 59 participants (37 males, 22 females) with a mean age of 21.2 years (SD = 2.6). An a priori power calculation with G*Power 3 (Faul et al., Citation2007) for a within-factor repeated measures design with medium effect size (d = .3), an alpha of .05, and a power of .80 yielded that a sample size of 14 participants per condition was necessary (given a medium correlation between measurements, r = .3, and assumed sphericity) for 10 measurements.
Procedure
The study procedure was approved by the ethical committee of the university’s psychology department (and assigned the code “18242-SO”). Upon entering the lab room, the participants were asked to fill in the informed consent sheet. Then, the participants were seated at a table on which the setup for the Fitts task was placed. In order to become familiar with the task, each participant was provided with a practice trial of 120 seconds. The participants were instructed that the goal of the task was to oscillate the cursor on the screen as quickly and precisely as possible between the boxes by moving the joystick in front of them with their preferred hand. Following the short practice, the experimental manipulation took place, which will be explained below. In total, the data collection lasted 330 seconds in each condition. Finally, the participants were asked to fill out a final questionnaire assessing their demographics.
Design
The task involved a joystick that could be moved on a one-dimensional wooden track. A linear potentiometer inside the joystick measured the position of the joystick on the track and was connected to a computer, which ran the software displaying the task on a (1080 × 1920 pixels) screen (see ). The computer software measured the pixel coordinates of the cursor center on the 1920 pixels x-axis at a frequency of approximately 20Hz. The targets of the task were two static boxes (140 pixels in size; 1200 pixels distance between midpoints) located at the sides of the screen. The participants moved a rectangular cursor projected on the screen along the x-axis using the joystick located on the wooden track. The targets lit up green when the cursor reached the box, but changed to red when the target was overshot. The index of difficulty of the task could be computed based on Fitts’ law (Fitts & Peterson, Citation1964):
Figure 2. Figure of the computerized motor task. The gray boxes at the left-hand side and the right-hand side of the screen (black rectangle) represent the targets. The participant, facing the screen, controlled a circular cursor by moving the joystick with their preferred hand on the wooden track placed in front of them.
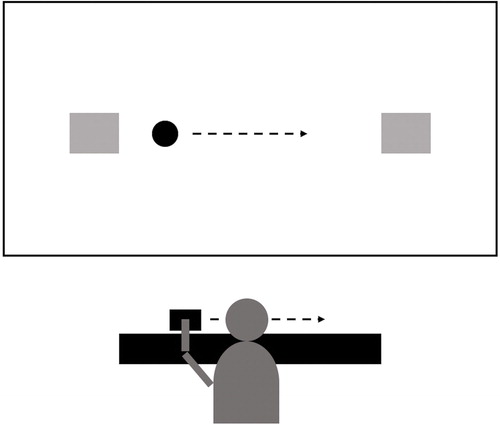
(1)where D corresponds to the distance between targets and W to the targets’ widths, yielding 4.1.
Experimental Manipulation
The participants were randomly allocated to one of the three conditions (i.e., sensitivity alteration only, occlusion only, or both) and informed about what stressors would be induced during their task performance. The stressors were induced by either repeatedly altering the sensitivity of the cursor movements (i.e., task constraint), occluding the vision of the participant for 5 seconds (i.e., organismic constraint) to provide sufficient time for the movement pattern to be disrupted by the occlusion, or both. The sensitivity alterations were achieved with the software running the lateral movement task, which alters the ratio of the distance that needed to be covered on the potentiometer to move the cursor by 1 pixel. For example, when the sensitivity was altered from 1 (default) to 2, twice the number of pixels was covered by the cursor on the screen when the potentiometer was moved by one unit. Thereby the feeling of control over the cursor may change which raises the difficulty of exerting accurate movements. In order to occlude the vision of the participants, we asked them to wear a pair of PLATO occlusion spectacles connected to the ToTal control System (Version 5, Translucent Technologies Inc., Toronto, ON, Canada) during the task performance. All constraints were manipulated 10 times during the task in an interval of 30 seconds (see ) to ensure that the observed effects are due to the repeated stressors per se rather than the history-dependence of the stressors (Hill et al., Citation2018a).
Table 1. Temporal structure of the constraint alterations by condition.
Measures
Resilience
In order to measure resilience, the level of functioning to which the system seeks to return to needs to be defined. Because the performance aim of the task is to oscillate as quickly and precisely as possible between the targets, we identified the time point and its according x-axis position when the direction of the movement changed from left to right or vice versa. These turning points represent peaks in an oscillatory movement profile, which approximates a sinusoid curve when mapped over time. The peaks were chosen to represents the movement accuracy and speed because they 1) indicate the onset and endpoint of a movement cycle, and 2) represent the time point when the cursor was aimed to have been successfully moved into a target, before the participants starts aiming at the subsequent target.
Based on the movement peaks, we established the baseline performance to determine the resilience of each participant for each stressor. The baseline performance represents the movement accuracy during the initial task period before the first constraint alteration was applied (see ). Specifically, we calculated the mean and the standard deviation of the absolute distance between each peak’s x-axis position and the center point of the target the movement was aimed at. Furthermore, we determined the time distance between each peak. However, we deleted the peaks for the first 5 seconds of the period to allow the participants to find their desired movement rhythm. This means that for the sensitivity only condition the baseline lasted 25 seconds (5s–30s), whereas the baseline for the occlusion only and mixed condition lasted 20 seconds (5s–25s), because the onset of the first visual occlusion took place after 25 seconds and lasted for 5 seconds. Thus, the moment in time after which the motor system needed to return to the previous level of functioning was identical. Based on the mean and the standard deviation, we then determined the 95% confidence interval of the baseline movement accuracy, representing the level of functioning to which the system needs to return to following the exposure to a stressor.
Given the baseline level of functioning, resilience was then determined by participant for each constraint alteration. Specifically, we created a total of 10 time-series including the peaks following a constraint alteration until the occurrence of the next constraint alteration (or in the case of the last constraint alteration until the end of the experiment). For each time-series, we determined the time-point at which at least 5 subsequent peaks’ (approximately 1/4 of the average amount of peaks produced in the baseline) absolute distance from the intended target center fall within the 95% confidence interval of the participant’s baseline movement accuracy. This point reflects the onset of stable behavior that is similar to the baseline functioning and thus marks the moment when participants have returned to their previous level of functioning. Then, we calculated the area under the curve from the deviation from the baseline mean for the period prior to the return to the previous level of functioning. Specifically, we calculated the difference between the peaks’ absolute distances and the baseline value for each peak that was larger than the baseline value (see ).
Figure 3. Example for the area under the curve (AUC) calculation for a specific peak (Peak15). The black line with markers represents the absolute distance from the target center for the peaks. The constraint alteration (gray lightning bolt) occurs between Peak10 and Peak11. The solid gray line represents the mean absolute distance to the target centers of the peaks during the baseline. The horizontal gray dotted lines represent the 95% confidence interval of the baseline accuracy. Note that the lower bound of the confidence interval is set to 0 because the mathematically determined absolute distance cannot occur. The vertical gray dotted lines mark the 15th and the 16th peak of the time-series respectively. Δt represents the time distance between Peak15 and Peak16 in seconds. The total AUC (gray striped area) is determined by summing the individual AUC values for all peaks (i.e., Peak11 to Peak15) preceding the return to the previous level of functioning (i.e., Peak16).
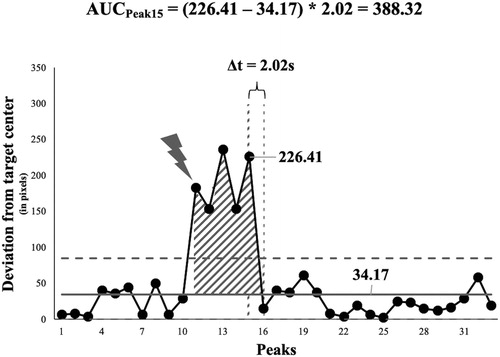
Because the peaks represent discrete rather than continuous values in time, we multiplied the distance by the time difference from a certain peak to the next (at the basis of seconds) to accurately approximate the area under the curve (AUC, see ). For example, if a peak’s absolute distance to a target center is 100 pixels larger the baseline value and there is a distance of 1.2 seconds from this peak to the next, the area under the curve would be equal to 120 (pixels*seconds; see for an example). If a peak shows a smaller absolute distance to a target center than the baseline value, the difference score would be set to zero. Thus, no matter how long the temporal distance between this and the subsequent peak is, the area under the curve for this event would be equal to 0.
Given that the sensitivity changes were not equally strong across the alterations (see ), we divided the area under the curve value for a given peak by absolute change in sensitivity to control for the different magnitudes of the perturbations. For example, if an area under the curve of 120 (pixels*seconds) was followed by a sensitivity change from 1.5 to 1.0 (or 2.0), the area under the curve controlling for the perturbation magnitude would be equal to 240 (i.e., 120/.5). Finally, the individual areas under the curve for each peak were added to yield the area under the curve following each stressor. In case the return to the previous level of functioning is determined to have occurred at time-point 1, no deviation from the baseline has occurred and the area under the curve would yield 0.
Data Analysis
To test for resilience changes following the exposure to repeated stressors, we applied linear mixed models. Thereby, we first assessed the general pattern of resilience change across the three conditions (i.e., sensitivity only, occlusion only, and mixed combined). Then, each condition was analyzed individually to test whether the general pattern of resilience change is similar across the different constraints, yielding a total of four different linear mixed models (i.e., all conditions combined, sensitivity only, occlusion only, and mixed). Specifically, the models assessed whether the AUC values for the participants changed over time represented by the 10 successive constraint alterations. To allow for individual differences in the initial AUC scores, we included random intercepts in the model. Furthermore, because of the opposite predictions of resilience losses and resilience gains in response to repeated constrain alterations, we included random slopes uncorrelated to the intercepts. If resilience improves with repeated constraint alterations (Davids et al., Citation2003, Citation2008), the relaxation time should decrease, which yields smaller AUC values (i.e., a product of the perturbation strength and return time). In contrast, resilience losses in response to repeated perturbation are associated with increasing recovery times and disruptions following a similar stressor (cf. Bardy et al., Citation2002; Scheffer et al., Citation2009, Citation2012, Citation2018), and therefore increasing AUC values. Thus, the beneficial effect of repeated constraint alterations is supported when the AUCs decrease significantly over time, while the resilience losses with repeated stressors are supported when the AUCs increase significantly over time across conditions.
Results
Manipulation Check
To test whether the alterations of the constraints reflect a stressor for performance to which the participants need to adapt, we tested whether the AUC of all participants following the first constraint alteration in the sensitivity only, occlusion only, and mixed condition significantly differed from 0. If the distribution of AUC scores is significantly larger than 0, the different constraint alterations indeed serve as a stressor, which foster (structural and) behavioral adaptations. In line with this assumption, the t-tests for the AUC values following the first constraint alteration were significantly greater than 0 for the sensitivity only (t(18) = 6.46, p < 0.001, 95% CI [304.82, 598.58]), the occlusion only (t(19) = 3.56, p = 0.002, 95% CI [86.46, 332.95]), and the mixed condition (t(19) = 4.26, p < 0.001, 95% CI [89.22, 261.85]). Therefore, the constraint alterations evoke a perturbation in performance to which the participants need to adapt.
Hypothesis Testing
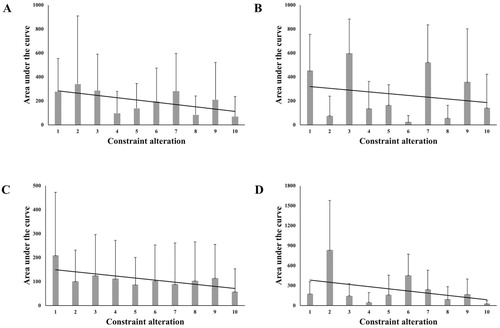
The linear mixed models show significant changes in the AUCs for three conditions combined (t(585) = −4.42, p < .001, 95% CI [-27.43, −10.55], = .05). This overall effect can be primarily ascribed to both the occlusion only (t(198) = −2.55, p = .012, 95% CI [-15.41, −1.96],
= .39) and the mixed condition (t(198) = −3.56, p < .001, 95% CI [-50.95, −14.66],
= .06). In the sensitivity only condition, we observed a marginally significant change in the AUCs, (t(185) = −1.77, p = .079, 95% CI [-31.36, 1.72],
= .02). For each condition, the coefficients indicate that the changes are negative. This means that with repeated stressors in form of constraint alterations, the AUCs decreased on average (see ). This provides empirical support for the notion that constraint alterations during a motor task enhances rather than diminishes adaptability and thus resilience. Note, however, that we also found significant heterogeneity in the slopes for the occlusion only (σ = 6.64, 95% CI [1.63, 26.95]) and sensitivity only (σ = 9.41, 95% CI [2.52, 35.10]) condition. This indicates that the slopes do not necessarily follow a uniform decline across individuals.
Figure 4. Change of area under the curve (AUC) scores with repeated stressors across all conditions (A) and by condition: sensitivity only (B), occlusion only (C), and mixed (D) condition. The gray bars show the average AUC score with the standard deviation. The black solid line represents the predicted change based on the linear mixed model.
Discussion
The aim of the current study was to assess how resilience changes during a motor task when repeated constraint alterations are induced. On the one hand, research has shown that constraint alterations can evoke beneficial changes in a motor system by training it to adapt to changes in the environment (Davids et al., Citation2003, Citation2008; Schöllhorn et al., Citation2006, Citation2009, Citation2010, Citation2012). On the other hand, research on resilience losses in biological and motor systems points out that the exposure to repeated (minor) stressors can undermine resilience leading to negative changes in the system’s level of functioning (Bootsma et al., Citation2002; Cuijpers et al., Citation2019; Dai et al., Citation2012; De Poel et al., Citation2020; Richardson et al., Citation2007; Scheffer et al., Citation2009, Citation2012; Van de Leemput et al., 2014). These lines of research indicate opposite predictions for the effect of repeated constraint alterations on a motor system.
Our results support the notion that repeated constraint alterations are beneficial for the resilience of a motor system. That is, we found a significant decrease in the AUC values for deviations from the equilibrium with repeated stressors across the three conditions. This means that, overall, the movement patterns were becoming disrupted less strongly over time, the participants returned to their previous level of functioning more quickly, or both. A possible explanation for why the constraint alterations elicit positive rather than negative changes in resilience may be offered by the concept of hormesis (Southam & Ehrlich, Citation1943). According to hormesis, the direction of the impact of a stressor on the system depends on the loading, or dosage, of the stressor. Specifically, various organisms and their constitute systems have been found to improve their functioning under small loadings, but decline in functioning when the loading exceeds a critical threshold (Calabrese, Citation2005a; Citation2005b; Calabrese & Mattson, Citation2011; Cowin & Hegedus, Citation1976; Kiefer et al., Citation2018; Southam & Ehrlich, Citation1943). For example, a muscle grows when a person engages weight training that sufficiently challenges that capacity of intended muscle. However, when the person attempts to train with loadings that exceed the maximum capacity injuries may occur. These findings have also recently been extended to sports performance (Hill et al., Citation2020). From this perspective, the induced stressors in this study may have been small enough to elicit the beneficial changes in the motor systems’ resilience without exceeding the loading threshold.
An alternative explanation for the positive impact of constraint alterations in this study are the fixed time intervals between the stressors. Resilience losses from relatively minor stressors may only develop when the stressors occur in sufficient temporal proximity to each other (Scheffer et al., Citation2009; Van de Leemput et al., 2014). Specifically, if a stressor lasts longer or occurs in closer temporal proximity to another, the system has less time to return to the previous state (Den Hartigh et al., Citation2016; Kelso, Citation1995). Consequently, future studies should test whether relative to fixed time intervals, stressors that last longer or occur in closer temporal proximity may trigger resilience losses in human movement.
Limitations and Future Directions
In addition to exploring the possible explanations for the current findings, two specific recommendations for future research can be derived. First, this study utilized stressors that are directly embedded in the movement system in the form of constraints. Future studies may assess the effect of stressors that are outside the motor system. For example, in a competitive setting, researchers may manipulate the score of the match to indicate that one performer is falling behind (i.e., negative psychological momentum; Briki et al., Citation2013; Den Hartigh et al., Citation2014, Citation2016; Hill et al., Citation2020; Perreault et al., Citation1998). This feedback is not directly coupled to the motor system, but indicates that behavioral adaptations are necessary to reach the performance goal (i.e., winning), which should become visible when performance is measured over time.
Second, the current study consists of a rather small sample that performs a rather artificial movement task. Increasing ecological validity may change the influence of the constraint alterations on the observed behavioral responses (Araújo et al., Citation2007). Therefore, future studies should assess whether resilience losses might occur following repeated constraint alterations across a larger group of individuals and in more natural performance environments.
Conclusion
The current study investigated whether facing repeated stressors in a motor task enhances or diminishes resilience. Therefore, we designed a lateral movement task that allowed us to collect a high frequency measurement of the movement patterns in order to map the adaptations to different constraint alterations. To measure resilience changes, we applied a novel analysis tool that assesses the strength of a given perturbation (i.e., constraint alteration) and the time the system needs to return to its previous level of functioning in the collected time-series. Our results suggest that repeated alterations of different types of constraints enhance rather than diminish resilience. Because both adaptability and resilience are hallmarks of expert performance, future studies should explore under what conditions resilience changes positively with stressors and when resilience may be lost.
Acknowledgments
We would like to thank Remco M. Willemsen for building the hardware, Oliver Holder for developing the software used to conduct this experiment, and for Ann-Marie Haycox for the data collection.
Disclosure statement
No potential conflict of interest was reported by the author(s).
Notes
1 Note that the perturbation strength may also vary with the magnitude of the perturbation. For example, while walking on a street, evading a single pedestrian may not disrupt the system as strongly as having to evade a larger group of pedestrians. In this case, a larger stress sensitivity may be due to the perturbation per se and not due to resilience losses.
References
- Araújo, D., Davids, K., Diniz, A., Rocha, L., Santos, J. C., Dias, G., & Fernandes, O. (2015). Ecological dynamics of continuous and categorical decision-making: The regatta start in sailing. European Journal of Sport Science, 15, 195–202. https://doi.org/https://doi.org/10.1080/17461391.2014.928749
- Araújo, D., Davids, K., & Passos, P. (2007). Ecological validity, representative design, and correspondence between experimental task constraints and behavioral setting: Comment on Rogers, Kadar, and Costall (2005). Ecological Psychology, 19, 69–78. https://doi.org/https://doi.org/10.1080/10407410709336951
- Balagué, N., Torrents, C., Hristovski, R. & Kelso, J. A. S. (2017). Sport science integration: An evolutionary synthesis. European Journal of Sport Science, 17, 51–62. https://doi.org/https://doi.org/10.1080/17461391.2016.1198422
- Bardy, B. G., Oullier, O., Bootsma, R. J., & Stoffregen, T. A. (2002). Dynamics of human postural transitions. Journal of Experimental Psychology: Human Perception and Performance, 28, 499–514. https://doi.org/https://doi.org/10.1037/0096-1523.28.3.499
- Bootsma, R. J., Boulard, M., Fernandez, L., & Mottet, D. (2002). Informational constraints in human precision aiming. Neuroscience Letters, 333, 141–145. https://doi.org/https://doi.org/10.1016/S0304-3940(02)01003-0
- Briki, W., Den Hartigh, R. J., Markman, K. D., Micallef, J. P., & Gernigon, C. (2013). How psychological momentum changes in athletes during a sport competition. Psychology of Sport and Exercise, 14, 389–396. https://doi.org/https://doi.org/10.1016/j.psychsport.2012.11.009
- Bruneau, M., Chang, S. E., Eguchi, R. T., Lee, G. C., O’Rourke, T. D., Reinhorn, A. M., Shinozuka, M., Tierney, K., Wallace, W. A. & von Winterfeldt, D. (2003). A framework to quantitatively assess and enhance the seismic resilience of communities. Earthquake Spectra, 19, 733–752. https://doi.org/https://doi.org/10.1193/1.1623497
- Calabrese, E. J. (2005a). Hormetic dose-response relationships in immunology: Occurrence, quantitative features of the dose response, mechanistic foundations, and clinical implications. Critical Reviews in Toxicology, 35, 89–295. https://doi.org/https://doi.org/10.1080/10408440590917044
- Calabrese, E. J. (2005b). Paradigm lost, paradigm found: The re-emergence of hormesis as a fundamental dose response model in the toxicological sciences. Environmental Pollution, 138, 379–411. https://doi.org/https://doi.org/10.1016/j.envpol.2004.10.001
- Calabrese, E. J., & Mattson, M. P. (2011). Hormesis provides a generalized quantitative estimate of biological plasticity. Journal of Cell Communication and Signaling, 5, 25–38. https://doi.org/https://doi.org/10.1007/s12079-011-0119-1
- Carver, C. S. (1998). Resilience and thriving: Issues, models, and linkages. Journal of Social Issues, 54, 245–266. https://doi.org/https://doi.org/10.1111/j.1540-4560.1998.tb01217.x
- Cowin, S., & Hegedus, D. (1976). Bone remodeling I: Theory of adaptive elasticity. Journal of Elasticity, 6, 313–326. https://doi.org/https://doi.org/10.1007/BF00041724
- Cuijpers, L. S., Den Hartigh, R. J. R., Zaal, F. T. J. M., & de Poel, H. J. (2019). Rowing together: Interpersonal coordination dynamics with and without mechanical coupling. Human Movement Science, 64, 38–46. https://doi.org/https://doi.org/10.1016/j.humov.2018.12.008
- Dai, L., Vorselen D., Korolev K. S., & Gore, J. (2012). Generic indicators for loss of resilience before a tipping point leading to population collapse. Science, 336, 1175–1177. https://doi.org/https://doi.org/10.1126/science.1219805
- Davids, K. W., Button, C., & Bennett, S. J. (2008). Dynamics of skill acquisition: A constraints-led approach. Human Kinetics.
- Davids, K., Glazier, P., Araújo, D. & Bartlett R. (2003). Movement systems as dynamical systems: The functional role of variability and its implications for sports medicine. Sports Medicine, 33, 245–260. https://doi.org/https://doi.org/10.2165/00007256-200333040-00001
- De Poel, H. J., Roerdink, M., Peper, C. L. E., & Beek, P. J. (2020). A re-appraisal of the effect of amplitude on the stability of interlimb coordination based on tightened normalization procedures. Brain Sciences, 10, 724. https://doi.org/https://doi.org/10.3390/brainsci10100724
- Dejonckheere, E, Mestdagh, M., Kuppens, P., & Tuerlinckx, F. (2020). Reply to: Context matters for affective chronometry. Nature Human Behaviour, 4, 690–693. https://doi.org/https://doi.org/10.1038/s41562-020-0861-6
- Den Hartigh, R. J. R., Cox, R. F. A., & Van Geert, P. L. C. (2017). Complex versus complicated models of cognition. In L. Magnani & T. Bertolotti (Eds.), Springer handbook of model-based science (pp. 657–669). Springer International Publishing.
- Den Hartigh, R. J., Gernigon, C., Van Yperen, N. W., Marin, L., & Van Geert, P. L. (2014). How psychological and behavioral team states change during positive and negative momentum. PloS One, 9, e97887. https://doi.org/https://doi.org/10.1371/journal.pone.0097887
- Den Hartigh, R. J. R., Hill, Y. & Van Geert, P. L. C. (2018). The development of talent in sports: A dynamic network approach. Complexity, 2018, 1–13. https://doi.org/https://doi.org/10.1155/2018/9280154
- Den Hartigh, R. J., Van Geert, P. L., Van Yperen, N. W., Cox, R. F., & Gernigon, C. (2016). Psychological momentum during and across sports matches: Evidence for interconnected time scales. Journal of Sport & Exercise Psychology, 38, 82–92. https://doi.org/https://doi.org/10.1123/jsep.2015-0162
- Drake, J. M., & Griffen, B. D. (2010). Early warning signals of extinction in deteriorating environments. Nature, 467, 456–459. https://doi.org/https://doi.org/10.1038/nature09389
- Egeland, B., Carlson, E., & Sroufe, L. A. (1993). Resilience as process. Development and Psychopathology, 5, 517–528. https://doi.org/https://doi.org/10.1017/S0954579400006131
- Faul, F., Erdfelder, E., Lang, A.-G., & Buchner, A. (2007). G*Power 3: A flexible statistical power analysis program for the social, behavioral, and biomedical sciences. Behavior Research Methods, 39, 175–191. https://doi.org/https://doi.org/10.3758/BF03193146
- Fitts, P. M., & Peterson, J. R. (1964). Information capacity of discrete motor responses. Journal of Experimental Psychology, 67, 103. https://doi.org/https://doi.org/10.1037/h0045689
- Fletcher, D. (2018). Psychological resilience and adversarial growth in sport and performance. In O. Braddick (Ed.), Oxford research encyclopedia of psychology. Oxford University Press.
- Galli, N., & Gonzalez, S. P. (2015). Psychological resilience in sport: A review of the literature and implications for research and practice. International Journal of Sport and Exercise Psychology, 13, 243–257. https://doi.org/https://doi.org/10.1080/1612197X.2014.946947
- Hill, Y., Den Hartigh, R. J. R., Cox, R. F. A., De Jonge, P., & Van Yperen, N. W. (2020). Predicting resilience losses in dyadic team performance. Nonlinear Dynamics, Psychology, and Life Sciences, 24, 327–351.
- Hill, Y., Den Hartigh, R. J. R., Meijer, R. R., De Jonge, P., & Van Yperen, N. W. (2018a). Resilience in sports from a dynamical perspective. Sport, Exercise, and Performance Psychology, 7, 333–341. https://doi.org/https://doi.org/10.1037/spy0000118
- Hill, Y., Den Hartigh, R. J. R., Meijer, R. R., De Jonge, P., & Van Yperen, N. W. (2018b). The temporal process of resilience. Sport, Exercise, and Performance Psychology, 7, 363–370. https://doi.org/https://doi.org/10.1037/spy0000143
- Hill, Y. Kiefer, A. W., Silva, P. L., Van Yperen, N. W., Meijer, R. R., Fischer, N., & Den Hartigh, R. J. R., (2020). Antifragility in climbing: Determining optimal stress loads for athletic performance training. Frontiers in Psychology, 11, 272. https://doi.org/https://doi.org/10.3389/fpsyg.2020.00272
- Holling, C. S. (1973). Resilience and stability of ecological systems. Annual Review of Ecology and Systematics, 4, 1–23. https://doi.org/https://doi.org/10.1146/annurev.es.04.110173.000245
- Kelso, J. A. (1984). Phase transitions and critical behavior in human bimanual coordination. American Journal of Physiology, 246, R1000–R1004. https://doi.org/https://doi.org/10.1152/ajpregu.1984.246.6.R1000
- Kelso, J. A. S. (1995). Dynamic patterns: The self-organization of brain and behavior. MIT Press.
- Kelso, J. A. S., Scholz, J. P. & Schöner, G. (1986). Nonequilibrium phase transitions in coordinated biological motion: Critical fluctuations. Physics Letters A, 118, 279–284. https://doi.org/https://doi.org/10.1016/0375-9601(86)90359-2
- Kiefer, A. W., Silva, P. L., Harrison, H. S., & Araújo, D. (2018). Antifragility in sport: Leveraging adversity to enhance performance. Sport, Exercise, and Performance Psychology, 7, 342–350. https://doi.org/https://doi.org/10.1037/spy0000130
- Latash, M. L. (2012). The bliss (not the problem) of motor abundance (not redundancy). Experimental Brain Research, 217, 1–5. doi: 10 .1007/s00221-012-3000-4
- Newell, K. M. (1986) Constraints on the development of coordination. In M. G. Wade & H. T. A. Whiting (Eds.), Motor development in children: Aspects of coordination and control (pp. 341–360). Nijhoff.
- Newell, K. M. (1991). Motor skill acquisition. Annual Review of Psychology, 42, 213–237. https://doi.org/https://doi.org/10.1146/annurev.ps.42.020191.001241
- Perreault, S., Vallerand, R. J., Montgomery, D., & Provencher, P. (1998). Coming from behind: On the effect of psychological momentum on sport performance. Journal of Sport and Exercise Psychology, 20, 421–436. https://doi.org/https://doi.org/10.1123/jsep.20.4.421
- Renshaw, I., & Chow, J. Y. (2019). A constraint-led approach to sport and physical education pedagogy. Physical Education and Sport Pedagogy, 24, 103–116. https://doi.org/https://doi.org/10.1080/17408989.2018.1552676
- Renshaw, I., Davids, K., & Savelsbergh, G. J. (2010). Motor learning in practice: A constraints-led approach. Routledge.
- Richardson, M. J., Marsh, K. L., Isenhower, R. W., Goodman, J. R., & Schmidt, R. C. (2007). Rocking together: Dynamics of intentional and unintentional interpersonal coordination. Human Movement Science, 26, 867–891. https://doi.org/https://doi.org/10.1016/j.humov.2007.07.002
- Sarkar, M., & Fletcher, D. (2013). How should we measure psychological resilience in sport performers? Measurement in Physical Education and Exercise Science, 17, 264–280. https://doi.org/https://doi.org/10.1080/1091367X.2013.805141
- Sarkar, M., & Fletcher, D. (2014). Psychological resilience in sport performers: A review of stressors and protective factors. Journal of Sports Sciences, 32, 1419–1434. https://doi.org/https://doi.org/10.1080/02640414.2014.901551
- Sato, T., Yamamoto, H., Sawada, N., Nashiki, K., Tsuji, M., Muto, K., Kume, H., Sasaki, H., Arai, H., Nikawa, T., Taketani, Y., & Takeda, E. (2006). Restraint stress alters the duodenal expression of genes important for lipid metabolism in rat. Toxicology, 227(3), 248–261. https://doi.org/https://doi.org/10.1016/j.tox.2006.08.009
- Seifert, L., Button, C., & Davids, K. (2013). Key properties of expert movement systems in sport: An ecological dynamics perspective. Sports Medicine, 43, 167–178. https://doi.org/https://doi.org/10.1007/s40279-012-0011-z
- Seifert, L., Komar, J., Araújo, D., & Davids, K. (2016). Neurobiological degeneracy: A key property for functional adaptations of perception and action to constraints. Neuroscience & Biobehavioral Reviews, 69, 159–165. https://doi.org/https://doi.org/10.1016/j.neubiorev.2016.08.006
- Scheffer, M., Bascompte, J., Brock, W. A., Brovkin, V., Carpenter, S. R., Dakos, V., Held, H., van Nes, E. H., Rietkerk, M., & Sugihara, G. (2009). Early-warning signals for critical transitions. Nature, 461, 53. https://doi.org/https://doi.org/10.1038/nature08227
- Scheffer, M., Bolhuis, J. E., Borsboom, D., Buchman, T. G., Gijzel, S. M., Goulson, D., Kammenga, J. E., Kemp, B., van de Leemput, I. A., Levin, S., Martin, C. M., Melis, R. J. F., van Nes, E. H., Romero, L. M., & Rikkert, M. G. M. O. (2018). Quantifying resilience of humans and other animals. Proceedings of the National Academy of Sciences of the United States of America, 115, 11883–11890. https://doi.org/https://doi.org/10.1073/pnas.1810630115
- Scheffer, M., Carpenter, S. R., Lenton, T. M., Bascompte, J., Brock, W., Dakos, V., van de Koppel, J., van de Leemput, I. A., Levin, S. A., van Nes, E. H., Pascual, M., & Vandermeer, J. (2012). Anticipating critical transitions. Science, 338, 344–348. https://doi.org/https://doi.org/10.1126/science.1225244
- Schöllhorn, W. I., Beckmann, H., & Davids, K. (2010). Exploiting system fluctuations. Differential training in physical prevention and rehabilitation programs for health and exercise. Medicina (Kaunas), 46, 365. https://doi.org/https://doi.org/10.3390/medicina46060052
- Schöllhorn, W. I., Beckmann, H., Michelbrink, M., Sechelmann, M., Trockel, M., & Davids, K. (2006). Does noise provide a basis for the unification of motor learning theories? International Journal of Sport Psychology, 37, 1–21.
- Schöllhorn, W. I., Hegen, P., & Davids, K. (2012). The nonlinear nature of learning-A differential learning approach. The Open Sports Sciences Journal, 5, 100–112. https://doi.org/https://doi.org/10.2174/1875399X01205010100
- Schöllhorn, W. I., Mayer-Kress, G., Newell, K. M., & Michelbrink, M. (2009). Time scales of adaptive behavior and motor learning in the presence of stochastic perturbations. Human Movement Science, 28, 319–333. https://doi.org/https://doi.org/10.1016/j.humov.2008.10.005
- Schöner, G., & Kelso, J. S. (1988). Dynamic pattern generation in behavioral and neural systems. Science, 239, 1513–1520. https://doi.org/https://doi.org/10.1126/science.3281253
- Schöner, G., Zanone, P. G., & Kelso, J. A. S. (1992). Learning as change of coordination dynamics: Theory and experiment. Journal of Motor Behavior, 24, 29–48. https://doi.org/https://doi.org/10.1080/00222895.1992.9941599
- Southam, C. M., & Ehrlich, J. (1943). Effects of exact of western red-dedar heartwood on certain wood-decaying fungi in culture. Phytopathol. 33, 517–524.
- Van de Leemput, I. A., Wichers, M., Cramer, A. O., Borsboom, D., Tuerlinckx, F., Kuppens, P., van Nes, E. H., Viechtbauer, W., Giltay, E. J., Aggen, S. H., Derom, C., Jacobs, N., Kendler, K. S., van der Maas, H. L. J., Neale, M. C., Peeters, F., Thiery, E., Zachar, P., & Derom, C. (2014). Critical slowing down as early warning for the onset and termination of depression. Proceedings of the National Academy of Sciences of the United States of America, 111, 87–92. https://doi.org/https://doi.org/10.1073/pnas.1312114110