
 ?Mathematical formulae have been encoded as MathML and are displayed in this HTML version using MathJax in order to improve their display. Uncheck the box to turn MathJax off. This feature requires Javascript. Click on a formula to zoom.
Abstract
This study aimed to determine relationships between muscle quality, the ratio of muscle strength to muscle mass, and postural control and compare postural control of older adults with higher and lower muscle quality. Twenty-five older adults had leg muscle quality and postural control with eyes open and closed measured. Linear and non-linear postural control variables were calculated from center of pressure movements. There was a significant canonical correlation between muscle quality and sway complexity, but no relationship between muscle quality and sway magnitude. Higher muscle quality older adults had greater medio-lateral sway complexity than lower muscle quality older adults. These findings suggest that higher muscle quality relates to greater sway complexity in older adults, suggesting maintenance of muscle quality should be considered important to attenuate postural control declines.
Keywords:
Introduction
Aging is associated with a number of changes to muscle function and characteristics including larger motor units, reduced voluntary activation, increased intramuscular adipose tissue (Frank-Wilson et al., Citation2018; McPhee et al., Citation2018), and decreased fascicle length and pennation angle (Narici & Maffulli, Citation2010; Wu et al., Citation2016). Muscle mass and strength also decrease with age leading to a decline in physical functioning and balance (Cruz-Jentoft et al., Citation2010), which increases the risk of falling (Nogueira Paranhos Amorim et al., Citation2021; Scott et al., Citation2014). However, the rate of decline in muscle strength is greater than that of muscle mass, resulting in a loss of muscle quality, the ratio of muscle strength to muscle mass (Delmonico et al., Citation2009). The decline in muscle quality, a disproportionate rate of decline in muscle strength, has been attributed to changes in neuromuscular structures including motor neuron loss, motor unit remodeling, decreased cortical excitability, and nerve conduction velocity (Clark & Fielding, Citation2012; Doherty, Citation2003; Fragala et al., Citation2015). The same neuromuscular structures form part of the postural control system (Muehlbauer et al., Citation2015). Postural control requires accurate neuromuscular output to maintain stability. This suggests that low muscle quality could cause poor postural control as the performance of the output of the postural control system is attenuated and may thus explain why low muscle quality increases the risk of falling (Gadelha et al., Citation2018; Khanal et al., Citation2021).
Recent studies have demonstrated that muscle quality is related to performance in functional assessments of dynamic balance (e.g., timed up and go and short physical performance battery) and fear of falling (Anderson et al., Citation2016; Gadelha et al., Citation2018). However, despite the demonstrated relationship between muscle quality and dynamic balance, there is conflicting evidence regarding the relationship between muscle quality and postural sway magnitude with no relationship found (Gadelha et al., Citation2018) and associations between sway velocity and trunk muscle density (Anderson et al., Citation2016).
The postural control system demonstrates non-linear behavior as a result of the integration of systems with different temporal and spatial scales (Duarte & Sternad, Citation2008). Non-linear measures of postural sway complexity, such as the fractal dimension, can, therefore, provide an understanding of the underlying neuromuscular postural control dynamics that cannot be gained from simple measures of sway magnitude (Doyle et al., Citation2004; Kędziorek & Błażkiewicz, Citation2020; Walsh et al., Citation2020). Although it should be noted that these non-linear measure of postural control do not differentiate the interactions or functions of specific sub-systems, merely the dynamics resulting from the interaction of all the relevant sub-systems. Linear measures of postural sway provide only descriptive information of the postural control output without considering the underlying control dynamics (Yamada, Citation1995). Lower sway complexity is indicative of a less robust postural control system (Lamoth & van Heuvelen, Citation2012; Zhou et al., Citation2013). It has also been demonstrated that older adults have less complex sway compared to young adults (Kilby et al., Citation2014; Walsh, Citation2021; Zhou et al., Citation2013) and older fallers have less complex sway than older non-fallers (Costa et al., Citation2007; Ramdani et al., Citation2013). Therefore, non-linear measures of postural control could be related to muscle quality, whereas linear measures such as postural sway magnitude are not.
According to the systems model of postural control, postural control is achieved via the integration of various sources of input, including visual, vestibular, and somatosensory components (Horak et al., Citation1989). With the removal of visual feedback, neuromuscular function is likely to contribute more to postural control (Speers et al., Citation2002). Older adults with lower muscle quality could thus demonstrate a greater reliance on visual information for postural control compared with older adults with higher muscle quality. Consequently, greater muscle quality could contribute to reduce the impact of sensory loss when vision is removed as a possible source of input for postural control. However, varied findings have been reported for the effects of removing vision on postural control. Sway variability, length and ellipse area increased with eyes closed (Doyle et al., Citation2004; Lee et al., Citation2018; Sarabon et al., Citation2013; Zhou et al., Citation2013) but with both no effect on the complexity (Błaszczyk & Klonowski, Citation2001) or correlation dimension (Lee et al., Citation2018) of sway and with lower sway complexity (Stins et al., Citation2009) reported. The present study seeks to extend these findings by exploring the relationship and interaction between neuromuscular function and vision in older adults.
The aim of this study was to determine the relationship between lower limb muscle quality and postural control of older adults. It was hypothesized that muscle quality would be positively related with postural sway complexity as previous studies have demonstrated that individuals with higher neuromuscular function (e.g., older adults vs. younger adults or non-fallers vs. fallers) have more complex postural sway. It was also hypothesized that muscle quality would not be related to sway magnitude. Furthermore, it was hypothesized that the high muscle quality group would have lower postural sway magnitude and greater sway complexity than the low muscle quality group and there would be an interaction between muscle quality group and visual condition for postural control variables.
Methods
Participants
Twenty-five community dwelling, defined as individuals who are not institutionalized or require a dedicated carer, older adults volunteered to participate in this study (n-female: 15, n-male: 10, age: 66 (9) years, height: 1.72 (0.10), mass: 69.9 (12.5) kg). Participants were excluded if they had fallen in the previous 12 months, suffered from neurological conditions such as stroke, Parkinson’s disease or dementia, or had a lower limb condition that prevent unaided walking and quiet standing. The procedures of the study were carried out in accordance with the Declaration of Helsinki and all participants were informed of the nature of the study and gave written informed consent prior to participation. The study received ethical approval from the Aberystwyth University ethics committee.
Procedures
Participants attended two separate laboratory sessions for the assessment of muscle quality and postural control within 5 days of each other. The first session consisted of body composition measurements using dual-energy X-ray absorptiometry (DXA: Discovery QDR Series, Hologic, Bedford, UK) to determine lean muscle mass of the lower limbs. Participants were positioned in a supine position with arms by sides. A spine phantom of known properties (Hologic DXA quality control phantom, bone mineral density: 0.93 g·cm−2, area: 54.8 cm2, bone mineral content: 50.8 g) was analyzed prior to each scan for quality control. The reliability for muscle mass measurement for individual leg segments (ICC 0.98–0.99) has been determined in another experiment in our laboratory (unpublished data).
Maximal concentric torque of the knee extensors, flexors, and ankle plantarflexors and dorsiflexors of the dominant limb was measured using an isokinetic dynamometer (Biodex Medical Systems Inc., NY, USA) for the calculation of muscle quality. The lower limb joint testing order was counterbalanced and randomized between participants and participants performed a familiarization set of 5 repetitions before each movement direction, to avoid order and learning effects. Three sets of 5 repetitions for each joint were performed with 30 seconds rest between sets. Concentric knee flexion and extension torque was measured at 60°·s−1 with the hip angle fixed at 90° and concentric ankle plantarflexion and dorsiflexion measurements were performed at 30°·s−1 with the knee fixed at 20°. The reliability for muscle strength measurement (ICC 0.83–0.98) has been determined in another experiment in our laboratory (unpublished data).
In the second session, postural control during quiet standing was assessed. Postural control was measured with participants standing quietly on a force platform (Kistler Instruments AG, Winterthur, Switzerland) sampling at 48 Hz to calculate the movements of the center of pressure (CoP). Five trials of 60 seconds were performed with eyes open (EO) and 5 trials of 60 seconds with eyes closed (EC). The reliability of postural control measures in our laboratory have been reported previously (ICC 0.73–0.94) (Walsh et al., Citation2018).
Data Analysis
Muscle Mass, Strength, and Quality
The DXA scans were analyzed (Hologic Discovery Software, Hologic Inc., Bedford, UK) to determine the lean muscle mass of the dominant leg using a segmented method suggested previously (Burkhart et al., Citation2009). Upper leg muscle mass was defined as all muscle mass within bounds defined by proximally, an angled line intersecting the neck of the femur passing lateral to the anterior superior iliac spine and the pubis, and distally, a line bisecting the knee joint. Lower leg muscle mass was defined as all muscle mass in the region defined proximally by a line bisecting the knee joint and distally by a line joining the medial and lateral malleoli. Medial and lateral borders of both segments were defined to include all soft tissue of the respective segment.
Upper leg muscle quality was calculated as the sum of knee flexor and extensor peak torque divided by upper leg muscle mass. Lower leg muscle quality was calculated as the sum of ankle plantarflexor and dorsiflexor maximum torque divided by lower leg muscle mass. Finally, whole leg muscle quality was calculated as the sum of knee extensor, knee flexor, ankle plantarflexor, and ankle dorsiflexor peak torques, divided by the sum of upper and lower leg muscle mass.
Postural Control
Linear indices of postural sway were the total CoP sway length, calculated as the resultant path length of the medio-lateral (ML) and anterio-posterior (AP) CoP components, and the elliptical area. For the calculation of elliptical area principle component analysis was used to determine the angle of the principle axis, and the minor axis orthogonal to the primary (Oliveira, Simpson, & Nadal, Citation1996). The length of the axes was calculated as 1.96 times the standard deviation along each axis.
Non-linear indices of postural sway were the fractal dimension (Df) of the CoP signal, determined separately for the AP and ML directions using the Higuchi algorithm (Higuchi, Citation1988). Fractal dimension calculation has been described in detail previously (Higuchi, Citation1988). Briefly, the CoP series x: x(1), x(2), x(3),…,x(N), is divided into k new series with initial time value of m x(m,k). The curve length of each of the reconstructed time series is calculated and then plotted on a log-log scale against its respective k value. The Df is then calculated as the slope of the least squares best fit of the log-log plot. The maximum value of k (kmax) used is determined by calculating Df for progressively greater values of kmax and the point at which a plot of Df against kmax plateaus is used for the analysis. In the current study kmax values of 70 and 50 were used for the AP and ML directions, respectively. A Df value of 2 represents random noise and a Df of 1 represents a signal with no complexity for example simple periodic motion. Analysis of CoP signals was performed using custom software in Matlab (Mathworks Inc., MA, USA).
Statistics
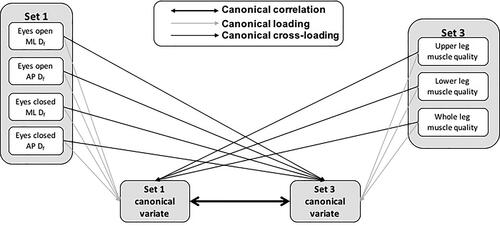
Canonical correlation analysis (CCA) was used to determine the strength of relationships between sets of muscle quality and postural control variables by finding linear combinations (canonical variates) of the sets that are maximally correlated with the other set (canonical correlation coefficient). CCA was adopted in this study as it allows for the capture of the multivariate nature of the neuromuscular control of posture and the individual contribution of elements to this relationship. This approach also avoids the inflation of type I error risk associated with performing numerous correlations. Three sets of variables were analyzed, set 1 included ML and AP Df in the eyes open and eyes closed conditions, set 2 included sway length and ellipse area in the eyes open and eyes closed conditions, and set 3 included upper, lower, and whole leg muscle quality variables. Because the hypothesized direction of the relationship between postural sway complexity and muscle quality, and magnitude and muscle quality was opposite, separate CCA were performed for the complexity variables (set 1) and magnitude variables (set 2) in relation to muscle quality (set 3). Thus, two canonical correlation analyses were performed, set 1 vs. set 3 and set 2 vs. set 3. The total number of canonical functions (pairs of canonical variates) calculated for each analysis was equal to the number of variables in the smaller set. Wilks’ lambda (λ) was used to determine the significance of canonical correlation coefficients for each canonical function. A conceptual diagram of the canonical correlation analysis is presented in .
Figure 1. A conceptual diagram of the canonical correlation analysis using the canonical correlation between set 1 and set 3 as an example.
ML: medio-lateral, AP: anterio-posterior, Df: fractal dimension.
For the canonical functions with significant canonical correlations the canonical loadings, canonical cross-loadings and redundancy index were calculated in addition to the canonical correlation coefficients, as described previously (Hair et al., Citation1998; Kilby et al., Citation2015). The canonical loadings were calculated as the correlations between variables and their canonical variate to assess the individual contribution of variables to the canonical variate. The canonical cross-loadings were calculated as the correlation coefficients between each variable in the set and the canonical variate of the other set. There are currently no guidelines to quantitatively interpret loadings and cross-loadings so interpretation will only be made qualitatively (Hair et al., Citation1998; Kilby et al., Citation2015). Redundancy index was calculated as the average of the squared cross-loadings. Redundancy index is interpreted like that of multiple regression R2, as the variance in the canonical function of the first set explained by the canonical function of the second set, and vice versa. For the present study only the redundancy index for the postural control sets were reported, that is, the amount variance in postural control that is explained by muscle quality, to test the primary hypothesis.
Higher and lower muscle quality groups were determined by ranking participants in order of the whole leg muscle quality. The higher muscle quality group was comprised of the 40% of participants (n = 10) with the highest muscle quality. The lower muscle quality group was comprised of the 40% of participants (n = 10) with the lowest muscle quality. To explore whether there were effects of group, visual condition and interaction effects on postural control variables, a two-way mixed design MANOVA with the 4 postural control variables (sway length, ellipse area, ML-Df and AP-Df) was performed. For significant multivariate main effects, univariate ANOVA were performed to determine which variables were significantly different. For all group comparisons and canonical correlations ⍺ was set at 0.05, and partial eta squared () was used as an estimate of effect size for group comparisons, values of 0.01, 0.06 and 0.14 were interpreted as small medium and large effects respectively (Richardson, Citation2011). All statistical analysis was performed using SPSS software (v22, IBM UK Ltd., Portsmouth, UK).
Results
Canonical Correlation Analyses
For the CCA between postural sway complexity (set 1) and muscle quality (set 3), the canonical correlation of the first canonical function was significant (r = 0.71, λ = 0.33, F(12, 47.92)=2.07, P = 0.038) but the second (r = 0.49, λ = 0.67, F(6, 38)=1.43, P = 0.229) and third (r = 0.35, λ = 0.88, F(2, 20)=1.37, P = 0.277) canonical functions were not significant.
The canonical loadings and cross-loadings of the first canonical function for the CCA between postural sway complexity and muscle quality are presented in . The ML-Df in eyes open and eyes closed conditions were the strongest contributors to the first postural sway complexity canonical function (canonical loadings) and had the strongest relationship with the first muscle quality canonical function (canonical cross-loadings). Upper and whole leg muscle quality were the strongest contributors to the first muscle quality canonical function (canonical loadings) and had the strongest relationship with the first postural sway complexity canonical function (canonical cross loadings). The percentage variance in postural sway complexity explained by the muscle quality, redundancy index, for the first canonical function was 28%.
TABLE 1. Canonical loadings and cross-loadings for the first canonical function of the postural sway complexity and muscle quality canonical variates.
For the CCA between postural sway magnitude (set 2) and muscle quality (set 3) the canonical correlations for canonical functions 1 (r = 0.47, λ = 0.59, F(12, 47.92)=0.89, P = 0.566), 2 (r = 0.43, λ = 0.75, F(6, 38)=0.96, P = 0.467), and 3 (r = 0.27, λ = 0.92, F(2, 20)=0.81, P = 0.458) were not significant.
Effect of Group and Visual Condition
There was a multivariate effect of muscle quality group (λ = 0.46, F(4,15)=4.39, P = 0.015, =0.54) and visual condition (λ = 0.46, F(4,15)=4.33, P = 0.016,
=0.54), however, there was no significant interaction (λ = 0.94, F(4,15)=0.22, P = 0.922,
=0.06). The ML-Df was greater in the high muscle quality group compared to the low muscle quality group (F(1,18)=8.02, P = 0.011,
=0.31), however, there were no group effects for sway length (F(1,18)=0.10, P = 0.755,
=0.0.01), ellipse area (F(1,18)=0.81, P = 0.381,
=0.04) or AP-Df (F(1,18)=0.11, P = 0.744,
=0.01). Both sway length (F(1,18)=18.42, P < 0.001,
=0.50) and ellipse area (F(1,18)=9.17, P = 0.007,
=0.34) were greater in EC than EO, however, there was no effect of visual condition for ML-Df (F(1,18)=4.23, P = 0.054,
=0.19) or AP-Df (F(1,18)=0.24, P = 0.628,
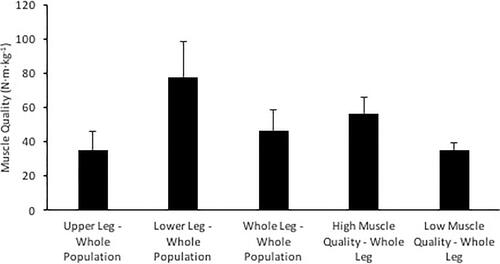
=0.01). Postural control and muscle quality data for each muscle quality group and the whole study population are presented in and 3, respectively.
Figure 2. Mean and standard deviation values of (a) sway length, (b) sway area, (c) medio-lateral (ML) fractal dimension, and (d) anterio-posterior (AP) fractal dimension for the high muscle quality and low muscle quality groups and the whole study population.
* indicates that eyes closed is greater than eyes open, † indicates high muscle quality group is greater than low muscle quality group.
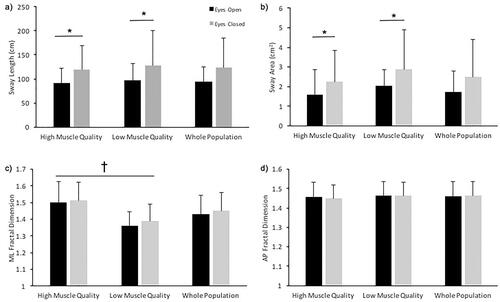
Figure 3. Mean and standard deviation values of upper, lower, and whole leg muscle quality and the whole leg muscle quality of the high and low muscle quality groups.
Discussion
The findings of this study demonstrate that canonical correlations exist between lower limb muscle quality of older adults and postural sway complexity in eyes open and eyes closed conditions. The results of this study suggest that non-linear measures of postural sway complexity are more sensitive to muscular function than linear measures of sway magnitude in older adults. In addition, older adults with higher muscle quality had greater ML-Df than those with lower muscle quality, and sway length and ellipse area were greater with eyes closed than eyes open.
Previous studies have demonstrated conflicting relationships between muscle strength and postural control or balance measures (Forte et al., Citation2014; Izquierdo et al., Citation1999; Melzer et al., Citation2009; Menz et al., Citation2005; Muehlbauer et al., Citation2012, Citation2015). However, a recent study demonstrated that compared to muscle strength or mass alone, muscle quality has a stronger relationship with previous falls, fear of falling and dynamic balance in older adults, but that it is not related with linear measures of postural sway magnitude (Gadelha et al., Citation2018). The findings of the current study extend these previous results by demonstrating that lower limb muscle quality is positively related to postural sway complexity, explaining 28% of the variance in sway complexity. It has been suggested that lower postural sway complexity is indicative of a less stable postural control system that is less robust to perturbation (Lamoth & van Heuvelen, Citation2012; Zhou et al., Citation2013). Older adults have lower sway complexity than young adults (Kilby et al., Citation2014; Walsh, Citation2021; Zhou et al., Citation2013) and older fallers have lower sway complexity than non-fallers (Costa et al., Citation2007; Ramdani et al., Citation2013). The present findings suggest that a higher muscle quality could be a contributing mechanism to greater sway complexity, demonstrated by the significant positive relationship and significantly greater ML complexity in higher muscle quality compared to lower muscle quality older adults. These results may help explain previous findings demonstrating lower falls history in higher muscle quality older adults (Nogueira Paranhos Amorim et al., Citation2021) and indicates that greater neuromuscular function allows for greater automaticity of postural sway, as indicated by greater sway complexity (Kędziorek & Błażkiewicz, Citation2020; Richer & Lajoie, Citation2020). However, the relatively small magnitude of the redundancy index, despite the significant canonical correlation, is likely indicative of the complex control of posture relying on sensory integration from visual, vestibular, and somatosensory sources as well as neuromuscular output.
Declining muscle quality is due to degeneration of neuromuscular structures such as motor neuron loss, motor unit remodeling, decreased cortical excitability and nerve conduction velocity (Clark & Fielding, Citation2012; Doherty, Citation2003; Fragala et al., Citation2015). The results of this study, therefore, indicate that neuromuscular factors also contribute to the postural sway complexity of older adults and that preventing or minimizing the decline in muscle quality could reduce age-related declines in postural control. Whilst the present study has focussed on muscle strength and mass ratio as a measure of muscle quality, previous work has demonstrated that factors such as increased intramuscular adipose tissue (Frank-Wilson et al., Citation2018) and decreased voluntary activation (McPhee et al., Citation2018), fascicle length and pennation angle (Narici & Maffulli, Citation2010; Wu et al., Citation2016) also impair neuromuscular function which may impact on the relationships found in this study.
Previous studies have suggested that ML postural is an important factor for fall risk in older adults and postural control is less stable in the ML direction than the AP direction (Hilliard et al., Citation2008; Kurz et al., Citation2013; Melzer et al., Citation2010; Park et al., Citation2014), although this is not consistently demonstrated (Kilby et al., Citation2014). In the present study, ML sway complexity contributed more to the first canonical variate than AP and was greater in the higher than the lower muscle quality group, with no effect for the AP direction. This indicates that ML postural control could be more dependent on neuromuscular function than AP postural control. It is possible that the postural control system has greater redundancy in the AP direction due to the greater range of motion and strength in the sagittal plane of the ankle, knee, and hip joints providing greater ability for postural correction, thus reducing the impact of declining neuromuscular function on postural control.
The greater sway length and ellipse area in eyes closed conditions compared to eyes open agrees with previous findings (Doyle et al., Citation2004; Sarabon et al., Citation2013; Zhou et al., Citation2013). However, this study found no difference in Df between the visual conditions, in agreement with previous findings (Błaszczyk & Klonowski, Citation2001), and no interaction between muscle quality group and visual condition. Although a medium effect size was noted (=0.06) for the interaction effect, these findings could indicate that in the current healthy population of older adults, when visual feedback was removed postural sway magnitude was allowed to increase without a change in sway complexity, to maintain balance. Thus, this suggests for both the higher and lower muscle quality group the redundancy in the postural control system was generally sufficient to compensate for the removal of visual feedback.
A limitation of the current study was the small sample size which may have limited the power of the canonical correlation and group comparative analyses performed. However, despite the small sample size, the significant relationships and large effect sizes between the groups suggest that muscle quality contributes to the postural control of older adults. A secondary limitation is that the interpretations of the findings of this study are limited to community-dwelling older adults. An understanding of the relationship between muscle quality and postural control may be important for understanding the declining postural control and increasing fall risk in older adults, particularly those who are frail or with comorbidities. Future studies should further explore the relationships presented in this study in larger populations and clinical populations. Future research could also explore whether training interventions could specially focus on improving or maintaining muscle quality in older adults to determine if improving muscle quality can improve postural control and reduce the risk of falling.
In conclusion, this study has demonstrated that the lower limb muscle quality of older adults is correlated with postural sway complexity but not postural sway magnitude. Regardless of the availability of visual stimuli, ML sway complexity was also greater in older adults with high muscle quality compared to older adults with low muscle quality. Finally, postural control in the ML direction appeared more dependent on muscle quality than postural control in the AP direction.
Disclosure Statement
No potential conflict of interest was reported by the author(s).
REFERENCES
- Anderson, D. E., Quinn, E., Parker, E., Allaire, B. T., Muir, J. W., Rubin, C. T., Magaziner, J., Hannan, M. T., Bouxsein, M. L., & Kiel, D. P. (2016). Associations of computed tomography-based trunk muscle size and density with balance and falls in older adults. The Journals of Gerontology. Series A, Biological Sciences and Medical Sciences, 71(6), 811–816. https://doi.org/https://doi.org/10.1093/gerona/glv185
- Błaszczyk, J. W., & Klonowski, W. (2001). Postural stability and fractal dynamics. Acta Neurobiologiae Experimentalis, 61(2), 105–112.
- Burkhart, T. A., Arthurs, K. L., & Andrews, D. M. (2009). Manual segmentation of DXA scan images results in reliable upper and lower extremity soft and rigid tissue mass estimates. Journal of Biomechanics, 42(8), 1138–1142. https://doi.org/https://doi.org/10.1016/j.jbiomech.2009.02.017
- Clark, D. J., & Fielding, R. A. (2012). Neuromuscular contributions to age-related weakness. The Journals of Gerontology. Series A, Biological Sciences and Medical Sciences, 67(1), 41–47. https://doi.org/https://doi.org/10.1093/gerona/glr041
- Costa, M., Priplata, A. A., Lipsitz, L. A., Wu, Z., Huang, N. E., Goldberger, A. L., & Peng, C. K. (2007). Noise and poise: Enhancement of postural complexity in the elderly with a stochastic-resonance-based therapy. Europhysics Letters, 77, 68008. https://doi.org/https://doi.org/10.1209/0295-5075/77/68008
- Cruz-Jentoft, A. J., Baeyens, J. P., Bauer, J. M., Boirie, Y., Cederholm, T., Landi, F., Martin, F. C., Michel, J. P., Rolland, Y., Schneider, S. M., Topinková, E., Vandewoude, M., & Zamboni, M. (2010). Sarcopenia: European consensus on definition and diagnosis. Age and Ageing, 39(4), 412–423. https://doi.org/https://doi.org/10.1093/ageing/afq034
- Delmonico, M. J., Harris, T. B., Visser, M., Park, S. W., Conroy, M. B., Velasquez-Mieyer, P., Boudreau, R., Manini, T. M., Nevitt, M., Newman, A. B., & Goodpaster, B. H., & Health Aging Body Composition Study. (2009). Longitudinal study of muscle strength, quality, and adipose tissue. The American Journal of Clinical Nutrition, 90(6), 1579–1585. https://doi.org/https://doi.org/10.3945/ajcn.2009.28047
- Doherty, T. J. (2003). Invited review: Aging and sarcopenia. Journal of Applied Physiology (Bethesda, MD. : 1985), 95(4), 1717–1727. https://doi.org/https://doi.org/10.1152/japplphysiol.00347.2003
- Doyle, T. L. A., Dugan, E. L., Humphries, B., & Newton, R. U. (2004). Discriminating between elderly and young using a fractal dimension analysis of centre of pressure. International Journal of Medical Sciences, 1(1), 11–20.
- Duarte, M., & Sternad, D. (2008). Complexity of human postural control in young and older adults during prolonged standing. Experimental Brain Research, 191(3), 265–276. https://doi.org/https://doi.org/10.1007/s00221-008-1521-7
- Forte, R., Boreham, C. a G., De Vito, G., Ditroilo, M., & Pesce, C. (2014). Measures of static postural control moderate the association of strength and power with functional dynamic balance. Aging Clinical and Experimental Research, 26(6), 645–653. https://doi.org/https://doi.org/10.1007/s40520-014-0216-0
- Fragala, M., Kenny, A., & Kuchel, G. (2015). Muscle quality in aging: a multi-dimensional approach to muscle functioning with applications for treatment. Sports Medicine (Auckland, N.Z.), 45(5), 641–658. https://doi.org/https://doi.org/10.1007/s40279-015-0305-z
- Frank-Wilson, A. W., Chalhoub, D., Figueiredo, P., Jónsson, P. V., Siggeirsdóttir, K., Sigurdsson, S., Eiriksdottir, G., Guðnason, V., Launer, L., Harris, T. B., & AGES-Reykjavik Study. (2018). Associations of quadriceps torque properties with muscle size, attenuation, and intramuscular adipose tissue in older adults. The Journals of Gerontology. Series A, Biological Sciences and Medical Sciences, 73(7), 931–938. https://doi.org/https://doi.org/10.1093/gerona/glx262
- Gadelha, A. B., Neri, S. G. R., Nóbrega, O. T., Pereira, J. C., Bottaro, M., Fonsêca, A., & Lima, R. M. (2018). Muscle quality is associated with dynamic balance, fear of falling, and falls in older women. Experimental Gerontology, 104, 1–6. https://doi.org/https://doi.org/10.1016/j.exger.2018.01.003
- Hair, J. F., Anderson, R. E., Tatham, R. L., & Black, W. C. (1998). Multivariate data analysis (5th ed.). Prentice Hall. https://doi.org/https://doi.org/10.1080/09084282.2010.523392
- Higuchi, T. (1988). Approach to an irregular time series on the basis of the fractal theory. Physica D, 31(2), 277–283. https://doi.org/https://doi.org/10.1016/0167-2789(88)90081-4
- Hilliard, M. J., Martinez, K. M., Janssen, I., Edwards, B., Mille, M. L., Zhang, Y., & Rogers, M. W. (2008). Lateral balance factors predict future falls in community-living older adults. Archives of Physical Medicine and Rehabilitation, 89(9), 1708–1713. https://doi.org/https://doi.org/10.1016/j.apmr.2008.01.023
- Horak, F. B., Shupert, C. L., & Mirka, A. (1989). Components of postural dyscontrol in the elderly: A review. Neurobiology of Aging, 10(6), 727–738. https://doi.org/https://doi.org/10.1016/0197-4580(89)90010-9
- Izquierdo, M., Aguado, X., Gonzalez, R., LóPez, J. L., & HäKkinen, K. (1999). Maximal and explosive force production capacity and balance performance in men of different ages. European Journal of Applied Physiology and Physiology, 79(3), 260–267. https://doi.org/https://doi.org/10.1007/s004210050504
- Kędziorek, J., & Błażkiewicz, M. (2020). Nonlinear measures to evaluate upright postural stability: A systematic review. Entropy, 22(12), 1–24. https://doi.org/https://doi.org/10.3390/e22121357
- Khanal, P., He, L., Stebbings, G. K., Onambele-Pearson, G. L., Degens, H., Williams, A. G., Thomis, M., & Morse, C. I. (2021). Static one-leg standing balance test as a screening tool for low muscle mass in healthy elderly women. Aging Clinical and Experimental Research, 33(7), 1831–1839. https://doi.org/https://doi.org/10.1007/s40520-021-01818-x
- Kilby, M. C., Molenaar, P. C. M., & Newell, K. M. (2015). Models of postural control: shared variance in joint and COM motions. Plos One, 10(5), e0126379 https://doi.org/https://doi.org/10.1371/journal.pone.0126379
- Kilby, M. C., Slobounov, S. M., & Newell, K. M. (2014). Postural instability detection: Aging and the complexity of spatial-temporal distributional patterns for virtually contacting the stability boundary in human Stance. PLoS One, 9(10), e108905. https://doi.org/https://doi.org/10.1371/journal.pone.0108905
- Kurz, I., Berezowski, E., & Melzer, I. (2013). Frontal plane instability following rapid voluntary stepping: Effects of age and a concurrent cognitive task. The Journals of Gerontology. Series A, Biological Sciences and Medical Sciences, 68(11), 1402–1408. https://doi.org/https://doi.org/10.1093/gerona/glt040
- Lamoth, C. J. C., & van Heuvelen, M. J. G. (2012). Sports activities are reflected in the local stability and regularity of body sway: Older ice-skaters have better postural control than inactive elderly. Gait & Posture, 35(3), 489–493. https://doi.org/https://doi.org/10.1016/j.gaitpost.2011.11.014
- Lee, I. C., Pacheco, M. M., & Newell, K. M. (2018). Constraints specific influences of vision, touch and surface compliance in postural dynamics. Gait & Posture, 59 (August 2017), 117–121. https://doi.org/https://doi.org/10.1016/j.gaitpost.2017.09.014
- McPhee, J. S., Cameron, J., Maden-Wilkinson, T., Piasecki, M., Yap, M. H., Jones, D. A., & Degens, H. (2018). The contributions of fiber atrophy, fiber loss, in situ specific force, and voluntary activation to weakness in sarcopenia. The Journals of Gerontology. Series A, Biological Sciences and Medical Sciences, 73(10), 1287–1294. https://doi.org/https://doi.org/10.1093/gerona/gly040
- Melzer, I., Benjuya, N., Kaplanski, J., & Alexander, N. (2009). Association between ankle muscle strength and limit of stability in older adults. Age and Ageing, 38(1), 119–123. https://doi.org/https://doi.org/10.1093/ageing/afn249
- Melzer, I., Kurz, I., & Oddsson, L. I. E. (2010). A retrospective analysis of balance control parameters in elderly fallers and non-fallers. Clinical Biomechanics (Bristol, Avon), 25(10), 984–988. https://doi.org/https://doi.org/10.1016/j.clinbiomech.2010.07.007
- Menz, H. B., Morris, M. E., & Lord, S. R. (2005). Foot and ankle characteristics associated with impaired balance and functional ability in older people. The Journals of Gerontology. Series A, Biological Sciences and Medical Sciences, 60(12), 1546–1552. https://doi.org/https://doi.org/10.1093/gerona/60.12.1546
- Muehlbauer, T., Besemer, C., Wehrle, A., Gollhofer, A., & Granacher, U. (2012). Relationship between strength, power and balance performance in seniors. Gerontology, 58(6), 504–512. https://doi.org/https://doi.org/10.1159/000341614
- Muehlbauer, T., Gollhofer, A., & Granacher, U. (2015). Associations between measures of balance and lower-extremity muscle strength/power in healthy individuals across the lifespan: A systematic review and meta-analysis. Sports Medicine (Auckland, N.Z.), 45(12), 1671–1692. https://doi.org/https://doi.org/10.1007/s40279-015-0390-z
- Narici, M. V., & Maffulli, N. (2010). Sarcopenia: Characteristics, mechanisms and functional significance. British Medical Bulletin, 95(1), 139–159. https://doi.org/https://doi.org/10.1093/bmb/ldq008
- Nogueira Paranhos Amorim, D., Nascimento, D. C., Stone, W., Alves, V. P., Moraes, C. F., & Coelho Vilaça e Silva, K. H. (2021). Muscle Quality Is Associated with History of Falls in Octogenarians. The Journal of Nutrition, Health & Aging, 25(1), 120–125. https://doi.org/https://doi.org/10.1007/s12603-020-1485-2
- Oliveira, L. F., Simpson, D. M., & Nadal, J. (1996). Calculation of area of stabilometric signals using principal component analysis. Physiological Measurement, 17(4), 305–312. https://doi.org/https://doi.org/10.1088/0967-3334/17/4/008
- Park, J. W., Jung, M., & Kweon, M. (2014). The mediolateral CoP parameters can differentiate the fallers among the community-dwelling elderly population. Journal of Physical Therapy Science, 26(3), 381–384. https://doi.org/https://doi.org/10.1589/jpts.26.381
- Ramdani, S., Tallon, G., Bernard, P. L., & Blain, H. (2013). Recurrence quantification analysis of human postural fluctuations in older fallers and non-fallers. Annals of Biomedical Engineering, 41(8), 1713–1725. https://doi.org/https://doi.org/10.1007/s10439-013-0790-x
- Richardson, J. T. E. (2011). Eta squared and partial eta squared as measures of effect size in educational research. Educational Research Review, 6(2), 135–147. https://doi.org/https://doi.org/10.1016/j.edurev.2010.12.001
- Richer, N., & Lajoie, Y. (2020). Automaticity of postural control while dual-tasking revealed in young and older adults. Experimental Aging Research, 46(1), 1–21. https://doi.org/https://doi.org/10.1080/0361073X.2019.1693044
- Sarabon, N., Panjan, A., & Latash, M. (2013). The effects of aging on the rambling and trembling components of postural sway: effects of motor and sensory challenges. Gait & Posture, 38(4), 637–642. https://doi.org/https://doi.org/10.1016/j.gaitpost.2013.02.007
- Scott, D., Hayes, A., Sanders, K. M., Aitken, D., Ebeling, P. R., & Jones, G. (2014). Operational definitions of sarcopenia and their associations with 5-year changes in falls risk in community-dwelling middle-aged and older adults. Osteoporosis International, 25(1), 187–193. https://doi.org/https://doi.org/10.1007/s00198-013-2431-5
- Speers, R. A., Kuo, A. D., & Horak, F. B. (2002). Contributions of altered sensation and feedback responses to changes in coordination of postural control due to aging. Gait & Posture, 16(1), 20–30. https://doi.org/https://doi.org/10.1016/S0966-6362(02)00003-6
- Stins, J. F., Michielsen, M. E., Roerdink, M., & Beek, P. J. (2009). Sway regularity reflects attentional involvement in postural control: Effects of expertise, vision and cognition. Gait & Posture, 30(1), 106–109. https://doi.org/https://doi.org/10.1016/j.gaitpost.2009.04.001
- Walsh, G. S. (2021). Visuomotor control dynamics of quiet standing under single and dual task conditions in younger and older adults. Neuroscience Letters, 761, 136122. https://doi.org/https://doi.org/10.1016/j.neulet.2021.136122
- Walsh, G. S., Low, D. C., & Arkesteijn, M. (2018). The effect of prolonged level and uphill walking on the postural control of older adults. Journal of Biomechanics, 69, 19–25. https://doi.org/https://doi.org/10.1016/j.jbiomech.2018.01.015
- Walsh, G. S., Low, D. C., & Arkesteijn, M. (2020). Stable and unstable load carriage effects on the postural control of older adults. Journal of Applied Biomechanics, 36(3), 178–185. https://doi.org/https://doi.org/10.1123/jab.2019-0366
- Wu, R., Delahunt, E., Ditroilo, M., Lowery, M., & De Vito, G. (2016). Effects of age and sex on neuromuscular-mechanical determinants of muscle strength. Age (Dordrecht, Netherlands), 38(3), 57. https://doi.org/https://doi.org/10.1007/s11357-016-9921-2
- Yamada, N. (1995). Chaotic swaying of the upright posture. Human Movement Science, 14(6), 711–726. https://doi.org/https://doi.org/10.1016/0167-9457(95)00032-1
- Zhou, J., Manor, B., Liu, D., Hu, K., Zhang, J., & Fang, J. (2013). The complexity of standing postural control in older adults: a modified detrended fluctuation analysis based upon the empirical mode decomposition algorithm. PLoS One, 8(5), e62585. https://doi.org/https://doi.org/10.1371/journal.pone.0062585