
KEYWORDS:
Amphibians represent a key transition from aquatic to terrestrial ecology during the evolution of tetrapods. Extant amphibians, represented by the orders Anura (frogs and toads), Caudata (salamanders and newts) and Gymnophiona (caecilians), include almost 8,200 species. The first species of extant amphibian to be described using a taxonomic approach were in Systema Naturæ (Linnaeus Citation1758). However, unlike other tetrapod groups first described by Linnaeus (e.g. mammals and birds), the number of new amphibian species has remained relatively constant over the past two decades (~100 new species/year; )).
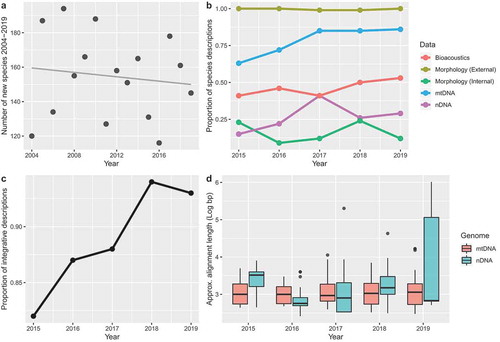
Figure 1. (a) Description of new species of Amphibia from 2004 to 2019. Note that the number of species described has been similar during this timeframe and that there is no clear trend of increase or decrease. Data obtained amphibiaweb.org. (b) Types of data used to describe new species of Amphibia from 2015 to 2019. See text for definitions of data types. Proportion is out of 732 new species surveyed for our study. (c) Proportion of integrative studies (using two or more lines of evidence) to describe species of Amphibia from 2015 to 2019. Proportion is out of 732 new species surveyed for our study. Note general increase over the survey period. (d) Approximate DNA sequence alignment lengths used to describe species of Amphibia from 2015 to 2019 for mitochondrial (mtDNA) and nuclear DNA (nDNA). Alignment lengths have been Log10-transformed. Note increase in size of nDNA datasets in 2019.
The amphibians described by Linnaeus, including iconic species like the Suriname toad (Pipa pipa), the paradoxical frog (Pseudis paradoxa) and a large caecilian (Caecilia tentaculata), were described using short lists of (typically fewer than 20) characters. The number of characters used to differentiate species has dramatically increased since the 18th century, with almost all modern amphibian taxonomy using hundreds to thousands of characters (primarily from morphology, DNA sequences, and bioacoustics).
Since Linnaeus, approaches to alpha taxonomy have also changed to accommodate the theory of evolution by natural selection (Darwin and Wallace Citation1858) and the modern synthesis (Huxley Citation1943). This more refined understanding of population genetics and the process of speciation has meant taxonomists face more complex challenges delimiting species. For example, sexual dimorphism, geographic variation, ontogenetic variation, hybridisation and complex lineage sorting patterns can all mislead species diagnoses. Perhaps because of this, modern taxonomy has become more integrative by including approaches for incorporating genotypic, phenotypic and distributional data in a more quantitative framework (Padial et al. Citation2010).
We were motivated to put together this special issue of Journal of Natural History because amphibians are not only a group with many undescribed species but also because many of these undescribed species are likely at risk of extinction from anthropogenic activities and pathogens (Scheele et al. Citation2019). Thus, there is an urgency to recognising their existence in the scientific literature. We were also interested in compiling information about how new species of amphibian have been recently described, as the integrative taxonomy of vertebrates is not universally practiced as a prescriptive discipline (see Streicher and Meik Citation2018). Furthermore, we were curious if there have been any geographic, taxonomic or methodological biases among recent 21st century descriptions of new species.
The current state of amphibian taxonomy
To survey the methods used by active amphibian taxonomists to describe new species, we examined the primary literature in 2015 (131 species), 2016 (116 species), 2017 (178 species), 2018 (161 species) and 2019 (146 species). These 732 publications were mostly identified using new species summaries available online (AmphibiaWeb Citation2020). After downloading the papers, we scored each study based on the methods and data that were used to describe new species. We answered eight questions as ‘Yes’ or ‘No’ for each study: (1) Were mitochondrial DNA (mtDNA) data used? (2) Were nuclear DNA (nDNA) data used? (3) Was a statistical species delimitation approach applied using DNA? (4) Were bioacoustic data used? (5) Was external morphology used (qualitative anatomical description and/or quantitative morphometrics)? (6) Was internal morphology used (tissue, skeletal and/or karyological examination)? (7) Was the larval form/early development described? (8) Did the study use two or more conciliant lines of evidence to describe the new species (i.e. was it integrative)?
We considered the following methods to be statistical species delimitation (e.g. Fujita et al. Citation2012): Automated barcode gap discovery (ABGD, Puillandre et al. Citation2012), Bayes factor delimitation (Grummer et al. Citation2014), Bayesian phylogenetics and phylogeography (BPP, Yang Citation2015 ), Brownie (O’Meara Citation2010), generalised mixed Yule-coalescent (GMYC, Pons et al. Citation2006), and Poisson tree processes model (PTP, Zhang et al. Citation2013). We defined integrative taxonomy as any description using two or more types of data to support a species’ description. This definition of integrative taxonomy is not meant to imply that studies using multiple data types always produce superior taxonomies when compared to traditional analyses. Nor that studies using what we characterise as ‘a single line of evidence’ are not integrating information from multiple characters to produce exemplary taxonomic decisions. For the purpose of our review, we simply wanted to capture how frequently amphibian taxonomists have integrated different types of data in recent work, because when possible (and done properly) this practice should lead to more robust taxonomic inferences.
For each new species description we also (1) counted the total number of authors, (2) recorded the higher level taxonomy of the new species (Family, Order), (3) counted the total number of nucleotide characters (if present) for mtDNA and nDNA datasets, respectively, (4) recorded which genic regions were sequenced, (5) recorded the country the new species was described from (using the holotype if the new species was described as occurring in more than one country) and (6) recorded information about the broad geographical regions and whether the new species was described from a biodiversity hotspot (Myers et al. Citation2000; Noss et al. Citation2015). We used the biodiversity hotspot definition of the Critical Ecosystem Partnership Fund (https://www.cepf.net) which includes 36 hotspots that contain at least 1,500 species of vascular plant and have lost at least 70% of their primary native vegetation. We used Microsoft® Excel and R statistical software (R Core Team Citation2019) to summarise data and generate figures. When using R, we utilised the packages ggplot2, cowplot and png to process data and construct figures (Urbanek Citation2015; Wickham Citation2016; Wilke Citation2019). The raw database and an R script to recreate Figures 1– are available via the NHM Data Portal (https://www.data.nhm.ac.uk).
We highlight several caveats related to our data summary. In one case where there is not complete agreement about familial groupings among anuran amphibians (see Heinicke et al. Citation2018), we combined Strabomantidae with Craugastoridae following Frost (Citation2020). In some summaries, we combined new species from Europe and Central Asia due to small sample sizes from Central Asia (N = 1). Occasionally, mtDNA or nDNA alignment lengths were not reported and we were unable to locate them elsewhere, so these descriptions were excluded from some analyses. There were a handful of studies during 2015–2019 that added nomenclature by removing taxa from synonymy. While we recognise that taxonomic resurrection is different than describing a species with no available nomenclature, we still refer to these taxa as ‘new species’ that were described during the survey period, because the same tools are used to demonstrate their existence as distinct entities. Results from our literature survey are summarised in – and –.
Table 1. Summary of taxonomic, data and geographic qualities associated with describing new species of Amphibia from 2015 to 2019. Proportion is calculated out of 732 new species surveyed for our study.
Table 2. Genetic partitions most commonly used in describing new species of Amphibia from 2015 to 2019. Genome of origin for each locus is listed as mitochondrial (mtDNA) or nuclear (nDNA). We did not include studies that sequenced the entire mitochondrial genome in these summaries. Proportion is calculated out of 732 new species surveyed for our study.
Table 3. Countries with more than 25 new species of Amphibia described from 2015 to 2019. Proportion is calculated out of 732 new species surveyed for our study.
Figure 2. (a) Bar plot depicting number of new species of Amphibia described from each family across three extant orders (Anura, Caudata, and Gymnophiona) during 2015–2019. (b) Relationship between the number of new species described from each family and the overall number of species known from each family according to Frost (Citation2020). Data have been fitted with a linear smoother using the ‘lm’ function from ggplot2 (Wickham Citation2016).
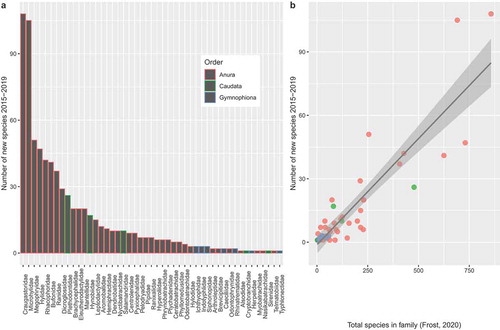
Figure 3. (a) Bar plot depicting number of new species of Amphibia described during 2015–2019 from global biodiversity hotspots. (b) Map depicting the distribution of hotspots that new amphibians were described from during 2015–2019. (c) Bar plot depicting number of new species of Amphibia described from broad geographical regions during 2015–2019. Europe and Central Asia have been combined due to geographic proximity and small sample sizes from Central Asia (N = 1).
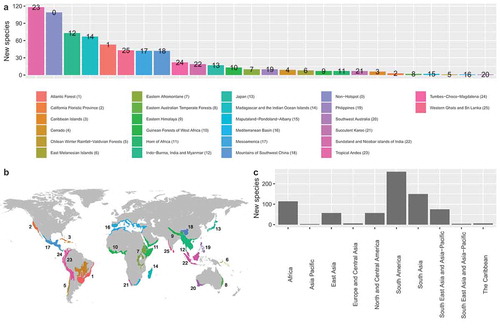
Figure 4. (a) Number of authors involved in describing new species of Amphibia during 2015–2019 compared to the geographical origin region of the new species. Note higher numbers of authors in taxa described from Africa and Europe/Central Asia. Europe and Central Asia have been combined due to geographic proximity and small sample sizes from Central Asia (N = 1). (b) Number of authors involved in describing new species of Amphibia during 2015–2019 compared to level of taxonomic integration/analysis. The five lines of evidence are (1) external morphology, (2) internal morphology, (3) mitochondrial DNA, (4) nuclear DNA, and (5) bioacoustics. Note increase in median number of authors as more lines of evidence are used.
What types of evidence do modern amphibian taxonomists use?
Nearly all studies used traditional comparisons of external morphology to describe species or revise taxonomy (). The rare exceptions to this trend were typically revalidations where citations to previous external morphological comparisons were made; for example, Andrias sligoi (Boulenger, 1924) and Eurycea braggi (Smith, 1968). Averaged across the five years of the survey period, taxonomists also utilised mtDNA (79% of species), bioacoustics (46% of species) and nDNA (29% of species). Given the central role that internal morphology (particularly the skeleton) has played in amphibian taxonomy (see Duellman and Trueb Citation1994), we were surprised that this was the least used type of evidence to inform species description during 2015–2019 (only 16% of species). Across the five years of the survey period, the proportional use of some types of data was similar (External and internal morphology) whereas other data types (mtDNA, nDNA, bioacoustics) increased in their proportional use ()). The increased use in these types of data may be related to an overall trend of increasing integration (use of more than one type of data) observed across the survey period ()). We expand further on this possibility in the sections below.
There was notable variation among genetic markers used to delimit species with the only substantial overlap across studies being the mtDNA large ribosomal RNA subunit region (16S rRNA; ). This genetic marker was used in 69% of species descriptions during the survey period. In comparison, the most widely used nDNA marker, RAG1 (recombinant activating protein 1), was only used in 19% of descriptions. We suspect that the popularity of mtDNA 16S rRNA is largely explained by two things (1) it is easily sequenced in the molecular laboratory due to conserved priming sites and abundant presence in tissues and (2) this mtDNA region was proposed as an amphibian ‘DNA barcoding marker’ by Vences et al. (Citation2005) building on large numbers of partial 16S rRNA sequences previously deposited on Genbank. It is clear that 15 years later, the community of amphibian taxonomists has embraced the recommendation of Vences et al. (Citation2005). However, we note that this is not a universal trend across orders of Amphibia. The mtDNA cytochrome-b gene was the most frequently used genetic marker in descriptions of new caudatans and was used in 40 species descriptions (versus 26 descriptions involving 16S rRNA). Taxonomic work in the other amphibian orders used cytochrome-b far less with only 26 anuran and four gymnophionan species descriptions utilising this region of mtDNA (versus 474 and seven descriptions involving 16S rRNA, respectively).
While far more studies used mtDNA in the most recent survey year than nDNA (2019; 86% versus 29%), the average size of mtDNA datasets stayed similar during the survey period whereas nDNA datasets appear to be growing in size substantially ()). A recent article looking more generally at alpha taxonomy practices of vertebrates found that in 2018 only about 53% of papers used molecular data (Miralles et al. Citation2020). The higher rate of 79% from the recent amphibian literature is encouraging (). We found that only 37 descriptions (~5% of all studies) used statistical species delimitation with molecules (). This suggests that this analytical approach to species delimitation is not widely used by amphibian taxonomists.
Are amphibian taxonomists becoming more integrative?
We found that 89% of the new species descriptions from 2015 to 2019 fit our criterion for being integrative (). We also noted an increase across the survey period of the number of integrative species descriptions ()). The most frequently used approaches to integration were the use of two and three lines of evidence (in 247 and 244 studies, respectively; ). To explore our dataset for further evidence of whether amphibian species descriptions have become more integrative over the last five years, we compiled the average number of lines of evidence used each year. In this comparison, there were a total of five types of evidence that could be used in a combined and integrative approach: (1) external morphology, (2) internal morphology, (3) bioacoustics, (4) mtDNA and (5) nDNA. We found that in 2015, 2016, 2017, 2018 and 2019 authors used an average of 2.48 (± 1.07 S.D.), 2.57 (± 0.97 S.D.), 2.85 (± 0.96 S.D.), 2.90 (± 0.99 S.D.), and 2.84 (± 0.94 S.D.) lines of evidence, respectively. This is consistent with an overall increase in the level of integration amphibian taxonomists practiced during 2015–2019.
What kinds of amphibians are modern amphibian taxonomists describing?
There were 662 anurans, 55 caudatans, and 15 gymnophionans described during the survey period (). Given overall species diversity in each of these orders, with anurans representing most extant amphibian species, these numbers were not surprising. In terms of the familial representation of new species, the anuran families with the largest number of new species described were Craugastoridae and Microhylidae with 108 and 105 species described, respectively ()). The caudatan family with the greatest amount of taxonomic discovery was Plethodontidae with 26 new species. Among the few gymnophionans described during the survey period, we found a three-way tie for most new species among Ichthyophiidae, Indotyphlidae and Siphonopidae, with three species each. Family level patterns were largely explained by the overall levels of diversity in each of anuran families to have new species described from them ()). This is an interesting pattern that should be explored further. Although a basic understanding of ontogeny is incredibly valuable for diagnosing species, egg and larval descriptions were relatively rare with only 15% of studies (110 species) including this information.
Where are new amphibian species coming from?
The most urgent areas that should be prioritised for alpha taxonomy work are likely those at most risk of being disturbed/destroyed. Encouragingly, the vast majority of new amphibian species described in 2015–2019 originated from global biodiversity hotspots with only ~15% described from non-hotspot areas (). New species originating from the Tropical Andes and Indo-Burma, India and Myanmar hotspots were the most numerous at 118 and 73 new species, respectively. Madagascar and the Indian Ocean Islands were a close third with 67 new species described in 2015–2019. Amphibian richness is unevenly distributed across the globe, with tropical regions having the most species and particularly high diversity found in South America and South East Asia (Buckley and Jetz Citation2007). Consistent with this, the most new species were described from South America, followed by South Asia where 150 new species were described (; )). Not surprisingly, 6 out of the top 8 countries with the most species described during 2015–2019 were found to be in South America and South Asia (). The most species for any country described during our survey period came from Brazil (99 species) followed by China (68 species) and Madagascar (65 species).
How many amphibian taxonomists does it take to describe a species?
The number of authors listed on new species descriptions during the survey period varied. There were on average 5.58 (± 3.82 S.D.) authors on new species descriptions from 2015 to 2019 and the number ranged from a single author (e.g. Kalophrynus anya Zug, 2015) to efforts involving 24 authors (Hyla perrini Dufresnes, Mazepa, Rodrigues, Brelsford, Litvinchuk, Sermier, Lavanchy, Betto-Colliard, Blaser, Borzée, Cavoto, Fabre, Ghali, Grossen, Horn, Leuenberger, Phillips, Saunders, Savary, Maddalena, Stöck, Dubey, Canestrelli, and Jeffries, 2018). We found that there were some potential geographical biases in authorship with new species described from Africa and Europe + Central Asia having higher median values for number of authors than other broad geographic regions ()). However, we note that the sample sizes for Europe + Central Asia are small (N = 6).
Given authorship patterns in other taxa (Poulin and Preswell Citation2016), we wondered if the number of authors needed to describe amphibian species was related (in part) to collaboration with higher degrees of data integration and quantity requiring more authors. We compared the number of authors on a new species description with the number of lines of evidence used (a proxy for degree of integration) and found that the median number of authors increased concomitantly with data integration (). This may indicate that having more authors is required to aggregate expertise for utilising moderns research tools and generating/interpreting multiple types of data.
Concluding remarks
Our survey revealed many positive aspects of amphibian taxonomy in the early 21st century. Notably, it appears amphibian taxonomists are becoming more integrative (beneficial for the science that informs taxonomy), more collaborative (beneficial for training and the persistence of taxonomic knowledge) and focusing their efforts on species that occupy habitats under threat from human activities (beneficial for informing on appropriate conservation management).
In addition to the encouraging aspects of modern amphibian taxonomic work, we also identified several areas for future growth, development and research. We would have also liked to have better characterised authorship trends as they relate to author nationality and other aspects of diversity. Anecdotally, as we surveyed the literature it seemed that most countries had local taxonomists working on their native amphibian faunas, but it would be worthwhile to confirm this with a formal comparison.
Although currently rare, using skeletal morphology to aid with taxonomic revision may become more feasible given the growing size of digital repositories of 3D morphological datasets (e.g. MorphoSource, https://www.morphosource.org/). These databases offer the ability to perform comparisons that would have historically required museum visits or loans. The analysis and curation of digital data also present some new challenges for taxonomists. For example, how do we maintain current (and best) taxonomic classifications across disconnected data repositories? The issues that arise from this challenge are already evident; while verifying alignment lengths for species described from 2015 to 2019 we noticed that on repositories like GenBank (https://www.ncbi.nlm.nih.gov/genbank/), taxonomy was often not updated and was reported as ‘sp.’ or a different taxon. This limits the usefulness of DNA sequence data for non-taxonomists.
It is clear from our survey of the alpha taxonomy literature from 2015 to 2019 that taxonomists favour mtDNA over nDNA as a line of evidence for discovering species ()). As the sequencing of larger, more variable nDNA datasets is becoming more commonplace (), it should be easier to test the validity of mitochondrial signal in the future. This will allow taxonomists to avoid spurious species delimitation due to incomplete matrilineal sorting, hybridisation and other non-phylogenetic agents of organellar change (see Mortiz and Cicero Citation2004).
In this special issue, eleven new species are described (nine frogs and two salamanders) and several revisionary actions are taken. There are contributions dealing with taxa from Africa (including Tanzania and Madagascar, Greenwood et al. Citation2020; Rancilhac et al. Citation2020), Asia (Mahony et al. Citation2020; Nguyen et al. 2020a; Nguyen et al. 2020b; Stuart et al. Citation2020), North America (Guyer et al. Citation2020), and South America (Melo-Sampaio et al. Citation2020). Interestingly, more than half of these studies describe new species from countries with recent high activity in alpha taxonomy research: Brazil, India, Madagascar, and Vietnam (). Across the special issue, readers will also see the main lines of evidence used to delimit species in full display including morphology, bioacoustics, mitochondrial and nuclear DNA.
These are exciting times for amphibian taxonomy; along with greater collaboration and data integration, new advances in DNA sequencing technology allow us to include data from type specimens in molecular phylogenetic reconstructions (Evans et al. Citation2019; Turvey et al. Citation2019; Rancilhac et al. Citation2020, this issue). Increasing digital accessibility to museum collections and open access publishing are also aiding the acceleration of taxonomic work by researchers with limited ability to travel internationally. We also note that, despite greater integration, the number of new species descriptions has remained relatively constant over the last few decades (,)). The number of undescribed amphibians species, under conservative estimates, is still around 2,000 taxa (Giam et al. Citation2011). At current rates (~150 species/year) it will take ~13 years to describe this diversity. While in one sense this is encouraging, there is still a need to expedite the remaining taxonomic descriptions through improved practices and more accessible data. For undescribed species that occupy especially vulnerable habitats, 13 years may not be enough time to enact sensible conservation management and avoid extinction. Additionally, for regions where the number of undescribed species may be higher than conservative global estimates (e.g. Vietes et al. Citation2009), there may be substantially more taxonomic discovery remaining. Thus, technological and training solutions are urgently needed to counteract the rate of extinction in species not yet known to science; a challenge we will need to meet as a research community. We hope that this special issue will serve as inspiration towards conducting the remaining and much-needed taxonomic research on amphibians in the 21st century.
Acknowledgements
JWS sincerely thanks Hennie Thomson, Edward Foster, and Cris Ann Bausing at Taylor & Francis for their constant support during the production of the special issue. Many thanks to Andrew Polaszek for handling a manuscript and for comments on a draft of this editorial. We especially thank the NHM Herpetology Group, particularly Mark Wilkinson, for comments on the qualities to score in new species descriptions. We thank Jann Vendetti and David Wake for comments related to nomenclatural consistency. We are also extremely grateful to the many expert reviewers it took to process the manuscripts contained herein.
Disclosure statement
No potential conflict of interest was reported by the authors.
References
- AmphibiaWeb. 2020. Berkeley (CA): University of California. [Accessed 2020 May 12]. https://amphibiaweb.org.
- Buckley LR, Jetz W. 2007. Environmental and historical constraints on global patterns of amphibian richness. Proc R Soc B. 274(1614):1167–1173. doi:10.1098/rspb.2006.0436.
- Darwin CR, Wallace AR. 1858. On the tendency of species to form varieties; and on the perpetuation of varieties and species by natural means of selection. J Proc Linn Soc London. 3(9):45–50. doi:10.1111/j.1096-3642.1858.tb02500.x.
- Duellman WE, Trueb L. 1994. Biology of Amphibians. Baltimore: John Hopkins Press.
- Evans BJ, Gansauge M-T, Stanley EL, Furman BLS, Cauret CM, Ofori-Boateng C, Gvoždik V, Streicher JW, Greenbaum E, Tinsley RC, et al. 2019. Xenopus fraseri: Mr. Fraser, where did your frog come from? PLoS ONE. 14(9):e0220892. doi:10.1371/journal.pone.0220892.
- Frost DR. 2020. Amphibian species of the world: an online reference. Version 6.1. New York (USA): American Museum of Natural History. [Accessed 2020 May 12]. https://amphibiansoftheworld.amnh.org/index.php.
- Fujita MK, Leache AD, Burbrink FT, McGuire JA, Mortiz C. 2012. Coalescent-based species delimitation in an integrative taxonomy. Trends Ecol Evol. 27(9):480–488. doi:10.1016/j.tree.2012.04.012.
- Giam X, Scheffers BR, Sodhi NS, Wilcove DS, Ceballos G, Ehrlich PR. 2011. Reservoirs of richness: least disturbed tropical forests are centres of undescribed species diversity. Proc Roy Soc B. 279(1726):67–76. doi:10.1098/rspb.2011.0433.
- Greenwood L, Loader SP, Lawson L, Greenbaum E, Zimkus BM. 2020. A new species of Phrynobatrachus (Amphibia: Phrynobatrachidae) from the northern mountains of Tanzania. J Nat Hist. In Press. 1–23. doi:10.1080/00222933.2020.1757171.
- Grummer JA, Bryson RW Jr., Reeder TW. 2014. Species delimitation using Bayes factors: simulations and application to the Sceloporus scalaris species group (Squamata: Phrynosomatidae). Syst Biol. 63(2):119–133. doi:10.1093/sysbio/syt069.
- Guyer C, Murray C, Bart JL, Crother BI, Chabarria RE, Bailey MA, Dunn K. 2020. Color and size reveal hidden diversity of Necturus (Caudata: Proteidae) from the Gulf Coastal Plain of the United States. J Nat Hist. In Press. 1–27. doi:10.1080/00222933.2020.1736677.
- Heinicke MP, Lemmon AR, Moriarty Lemmon E, McGrath K, Hedges SB. 2018. Phylogenomic support for evolutionary relationships of New World direct-developing frogs (Anura: Terraranae). Mol Phylogenet Evol. 118:145–155. doi:10.1016/j.ympev.2017.09.021.
- Huxley J. 1943. Evolution, the modern synthesis. New York (NY): Harper & brothers; p. 645.
- Linnæus C. 1758. Systema naturæ per regna tria naturæ, secundum classes, ordines, genera, species, cum characteribus, differentiis, synonymis, locis. Tomus I. Editio decima, reformata. Holmiæ. (Salvius); p. 824.
- Mahony S, Kamei RG, Teeling EC, Biju SD. 2020. Taxonomic review of the Asian horned frogs (Amphibia: Megophrys Kuhl & Van Hasselt) of northeast India and Bangladesh previously identified as M. parva (Boulenger) with descriptions of three new species. J Nat Hist. In Press. 1–76. doi:10.1080/00222933.2020.1736679.
- Melo-Sampaio PR, Prates I, Peloso PLV, Recoder R, Dal Vechio F, Marques-Souza S. 2020. A new nurse frog from southwestern Amazonian highlands, with notes on the phylogenetic affinities of Allobates alessandroi (Aromobatidae). J Nat Hist. In Press. 1–20. doi:10.1080/00222933.2020.1727972.
- Miralles A, Bruy T, Wolcott K, Scherz MD, Begerow D, Beszteri B, Bonkowski M, Felden J, Gemeinholzer B, Glaw F, et al. 2020. Repositories for taxonomic data: where we are and what is missing. Syst Biol. Syaa026. In Press. doi:10.1093/sysbio/syaa026.
- Mortiz C, Cicero C. 2004. DNA barcoding: promise and pitfalls. PLoS Biol. 2(10):e354. doi:10.1371/journal.pbio.0020354.
- Myers N, Mittermeier RA, Mittermeier CG, da Fonseca GAB, Kent J. 2000. Biodiversity hotspots for conservation priorities. Nature. 403(6772):853–858. doi:10.1038/35002501.
- Nguyen TT, Ninh HT, Orlov N, Nguyen TQ, Ziegler T. 2020a. A new species of the genus Zhangixalus (Amphibia: Rhacophoridae) from Vietnam. J Nat Hist. In Press. 1–29. doi:10.1080/00222933.2020.1728411.
- Nguyen TV, Duong TV, Luu KT, Poyarkov NA. 2020b. A new species of Kurixalus (Anura: Rhacophoridae) from northern Vietnam suggests faunal exchange between the mainland Asia and Taiwan. J Nat Hist. In Press. 1–29.
- Noss RF, Platt WJ, Sorrie BA, Weakley AS, Means DB, Costanza J, Peet RK. 2015. How global biodiversity hotspots may go unrecognized: lessons from the North American Coastal Plain. Divers Distrib. 21(2):236–244. doi:10.1111/ddi.12278.
- O’Meara BC. 2010. New heuristic methods for joint species delimitation and species tree inference. Syst Biol. 59(1):59–73. doi:10.1093/sysbio/syp077.
- Padial J, Miralles A, De la Riva I, Vences M. 2010. The integrative future of taxonomy. Front Zool. 7(1):16. doi:10.1186/1742-9994-7-16.
- Pons J, Barraclough TG, Gomes-Zurita J, Cardoso A, Duran DP, Hazell S, Kamoun S, Sumlin WD, Vogler AP. 2006. Sequence based species delimitation for the DNA taxonomy of undescribed insects. Syst Biol. 55(4):595–609. doi:10.1080/10635150600852011.
- Poulin R, Preswell B. 2016. Taxonomic quality of species description varies over time and with the number of authors, but unevenly among parasitic taxa. Syst Biol. 65(6):1107–1116. doi:10.1093/sysbio/syw053.
- Puillandre N, Lambert A, Brouillet S, Achaz G. 2012. ABGD, automatic barcode gap discovery for primary species delimitation. Mol Ecol. 21(8):1864–1877. doi:10.1111/j.1365-294X.2011.05239.x.
- R Core Team. 2019. R: A language and environment for statistical computing. Vienna (Austria): R Foundation for Statistical Computing. http://www.r-project.org/index.html
- Rancilhac L, Bruy T, Scherz MD, Almeida Pereira E, Preick M, Straube N, Lyra ML, Ohler A, Streicher JW, Andreone F, et al. 2020. Targeted enrichment of DNA sequencing from historical type material enables a partial revision of the Madagascar giant stream frogs (genus Mantidactylus). J Nat Hist. In Press. 1–32. doi:10.1080/00222933.2020.1748243.
- Scheele BC, Pasmans F, Skerratt LF, Berger L, Martel A, Beukema W, Acevedo AA, Burrowes PA, Carvalho T, Catenazzi A, et al. 2019. Amphibian fungal panzootic causes catastrophic and ongoing loss of biodiversity. Science. 363(6434):1459–1463. doi:10.1126/science.aav0379.
- Streicher JW, Meik JM. 2018. Integrative taxonomy of squamate reptiles: a special issue. J Nat Hist. 52(13–16):767–770. doi:10.1080/00222933.2018.1440786.
- Stuart BL, Som HE, Neang T, Hoang HD, Le DTT, Sau VQ, Potter K, Rowley JJL. 2020. Integrative taxonomic analysis reveals a new species of Leptobrachium (Anura: Megophryidae) from northeastern Cambodia and Central Vietnam. J Nat Hist. In Press. 1–31. doi:10.1080/00222933.2020.1756498.
- Turvey STT, Marr MM, Barnes I, Brace S, Tapley B, Murphy RW, Zhao E, Cunningham AA. 2019. Historical museum collections clarify evolutionary history of cryptic species radiation in the world’s largest amphibians. Ecol Evol. 9(18):10070–10084. doi:10.1002/ece3.5257.
- Urbanek S 2015. R package ‘png’. [accessed 2020 May 20]. https://cran.r-project.org/web/packages/png/index.html
- Vences M, Thomas M, van der Meijden A, Chiari CM, Vietes DR. 2005. Comparative performance of 16S rRNA gene in DNA barcoding of amphibians. Front Zool. 2(1):5. doi:10.1186/1742-9994-2-5.
- Vietes DR, Wollenberg KC, Andreone F, Köhler J, Glaw F, Vences M. 2009. Vast underestimation of Madagascar’s biodiversity evidenced by an integrative amphibian inventory. Proc Natl Acad Sci USA. 106:8261–8272.
- Wickham H. 2016. ggplot2: elegant graphics for data analysis. New York: Springer-Verlag. ISBN 978-3-319-24277-4. https://ggplot2.tidyverse.org.
- Wilke CO. 2019. R package ‘cowplot’. [accessed 2020 May 20]. https://github.com/eilkelab.org/cowplot.
- Yang Z. 2015. The BPP program for species tree estimation and species delimitation. Curr Zool. 61(5):854–865. doi:10.1093/czoolo/61.5.854.
- Zhang J, Kapli P, Pavlidis P, Stamatakis A. 2013. A general species delimitation method with applications to phylogenetic placements. Bioinformatics. 29(22):2869–2876. doi:10.1093/bioinformatics/btt499.