Abstract
Critical experiments were performed in the REBUS program on a core loaded with a test bundle including 16 irradiated BWR-type MOX rods of average burnup of 61 GWd/t. The experimental data were analyzed using diffusion, transport, and continuous-energy Monte Carlo calculation codes coupled with nuclear data libraries based on JENDL-3.2 or JENDL-3.3. Biases in effective multiplication factors of the critical cores were −1.0%Δk for the diffusion calculations (JENDL-3.2), −0.3%Δk for the transport calculations (JENDL-3.3), and 0.2%Δk for the Monte Carlo calculations (JENDL-3.2). The measured core fission rate and co-activation rate distributions were generally well reproduced using the three types of calculations. The burnup reactivity determined using the measured water level reactivity coefficients was −2.41 ± 0.08%Δk/kk’, which also agreed with the results of the three type of calculations within the measurement and calculation errors. The most probable isotopic inventories in the irradiated MOX rods was tentatively obtained by using the ratios of the calculation to chemical assay data on a pellet sample, and the burnup reactivity was reanalyzed to split the calculation error into those due to the inventory and reactivity calculations. This approach showed that the inventory calculation error compensated the reactivity calculation error.
1. Introduction
The Nuclear Safety Commission of Japan (NSC) has suggested in the report, ‘Full core loading of mixed oxide fuels in advanced boiling water reactors’ [Citation1] that current methods of safety design and evaluation for light water reactors should be advanced by systematic studies: (i) validation of burnup calculations by using fuel postirradiation examination data, (ii) validation of nuclear design calculations by critical experiments, and (iii) validation of nuclear design calculations for irradiated fuel. As part of the studies responding to this suggestion, the Japan Nuclear Energy Safety Organization (JNES) participated in the international program REBUSFootnote1 [Citation2] and has been performing analyses of the experimental data [Citation3–Citation5] for the above-mentioned validation study (iii).
As reported by Lance et al. [Citation2] one of data sets in the program was on irradiated BWR-type MOX fuel burnt inside 9 × 9 MOX assemblies discharged from Gundremmingen Nuclear Power Plant (NPP) in Germany. The MOX fuel was loaded in an experimental core, and core characteristics such as a critical water level and a water level reactivity coefficient were measured. Prior to the critical experiment, nondestructive burnup measurement of the MOX fuel was performed, and after the critical experiment, chemical assay of one fuel sample was carried out to obtain isotopic inventories.
The data set is unique and valuable to assess the accuracy in the calculations of burnup reactivity of BWR cores loaded with typical MOX fuel. Neutronics analysis of the data using typical calculation tools were reported by the organizations participating in the programs [Citation2,Citation3]. We have shown the preliminary analysis results [Citation4], and also described the detailed information of the experimental data [Citation5]. The aim of the present article is to describe our comprehensive analysis results obtained using deterministic methods and also those of the Monte Carlo calculation methods, and show the accuracies of those methods by comparing the analysis results with the experimental results.
Section 2 presents the burnup characteristics of the irradiated MOX fuel, Section 3 the critical experiment on the irradiated MOX fuel, Section 4 the analysis results, and Section 5 the conclusions.
2. Burnup characteristics of irradiated MOX fuel
The Gundremmingen NPP is a 1300 MWe BWR plant and the major core parameters are shown in Table 1. Three MOX assemblies were each discharged in July 1999 after four-cycle irradiation, in July 2000 after five-cycle irradiation and in June 2001 after six-cycle irradiation. The major design specifications of the 9 × 9 MOX assemblies are shown in Table 1. The fuel rod configuration in the assemblies is shown in . From the above three discharged MOX assemblies, 9 MOX rods were selected, and 16 test MOX rods of 1 m length were cut out from the top and/or bottom parts of them. The relation between the selected MOX rods and the test MOX rods is shown in Table 2. Since the rod configuration of the MOX assembly has one-eighth symmetry, the MOX rods at the locations C3, C7, G3, G7 are in symmetric positions. All MOX rods have the same initial fissile Pu content of 5.52 wt%. End plugs were attached to both ends of the test MOX rods and inserted in a 7 × 7 test bundle structure (hereafter, referred to as ‘irradiated MOX bundle’), which was loaded in an experimental core of the VENUS critical facility (hereafter, referred to as ‘irradiated MOX core’).
Figure 1. Fuel rod distribution in the 9 × 9 MOX assembly [Citation5].
![Figure 1. Fuel rod distribution in the 9 × 9 MOX assembly [Citation5].](/cms/asset/acb00b47-9eb8-4f53-87d7-8fefc200b7c8/tnst_a_649075_o_f0001g.gif)
Prior to the critical experiment in VENUS, axial distributions of total fissions per unit length in the test MOX rods were determined combining gross gamma scanning for all the test MOX rods and gamma ray spectroscopy of 662 keV gamma rays of 137Cs for six representative test MOX rods (H3 (T), H7 (T), H7 (B), H9 (T), H14 (T), and H15 (B)). The method was the same as that for the other irradiated fuel rods in the REBUS program and was described in Ref. [Citation6]. The total fission distributions were converted to the burnup distributions by applying an average energy release per fission (MeV/fission) during irradiation, which was calculated as part of burnup calculations of the 9 × 9 MOX assemblies shown in the Section 4.1.2. shows a measured axial burnup distribution in a pitch of about 1 cm for the H14 (T) rod as an example [Citation5]. Dips appearing at both ends and the middle of the rod correspond to the axial locations of the spacers of the fuel assembly. The measurement errors were given as 5.9% (one σ) by the organizer of the REBUS program [Citation5].
Figure 2. Axial burnup distribution of the H14 (T) rod and axial position of sample for chemical assay [Citation5].
![Figure 2. Axial burnup distribution of the H14 (T) rod and axial position of sample for chemical assay [Citation5].](/cms/asset/e44a8324-4f9e-4fa5-9131-63f43b65eb9f/tnst_a_649075_o_f0002g.gif)
By examining the measured axial burnup distribution, six coarse axial regions consisting of axially-inner two spans of 16 cm and other four spans of 17 cm were defined for each MOX rod. The length of the coarse axial regions was close to that in a typical axial node in core analysis of commercial BWRs. The burnup distributions in the coarse axial regions were shown in Table 3. The average value of all regions was 60.6 GWd/t.
3. Critical experiment on irradiated MOX fuel
As shown in , the irradiated MOX bundle consisted of the 16 test MOX rods and 8 fresh BR3 MOX rods of fissile Pu content of 6.78 wt%, since the number of the available test MOX rods were limited. The test MOX rods were placed in a checker board pattern and higher burnup test MOX rods were located at the middle of the bundle so that the reactivity difference between the fresh and irradiated MOX fuel was enlarged. The moderator to fuel ratio of the irradiated MOX bundle was close to assembly average ratios of typical BWR MOX assemblies at a hot operating condition, which were calculated taking into account the moderator in out-channel water gaps.
Figure 3. Rod configuration of the irradiated GUN MOX bundle [Citation5].
![Figure 3. Rod configuration of the irradiated GUN MOX bundle [Citation5].](/cms/asset/5e7c95b5-7758-4de6-8a10-85c223bac975/tnst_a_649075_o_f0003g.gif)
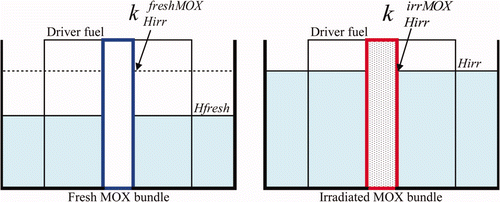
The radial and axial configurations of the irradiated MOX core are schematically shown in and , respectively. The core characteristics of the irradiated MOX core are summarized in Table 4. Table 4 also shows those of the fresh MOX core (hereafter, referred to as ‘fresh BR3 MOX core’), where a 7 × 7 test bundle consisting of 24 fresh BR3 MOX rods was loaded [Citation6]. Since the core loaded with a fresh MOX bundle consisting of fresh MOX rods of 5.52 wt% (Pu-fissile) corresponding to the 9 × 9 MOX assembly were not performed, we used the core characteristics of the fresh BR3 MOX core as a substitute to evaluate burnup reactivity as mentioned in Section 4.3. A driver region in the irradiated MOX core consisted of 3.3 and 4.0 wt% UO2 rods. An effective length of the fuel rods in the cores was 1.0 m. A critical core height was determined as a distance from the bottom of the active fuel length to the critical water levels, and water level reactivity coefficients were also measured by varying the water level and measuring excess reactivity. Core radial and axial fission rate distributions were measured for the irradiated MOX core by spectroscopy of specific Ba–La gamma rays (1596.5 keV) after a short irradiation of the core. The measurement was applied only to the driver region of the core since large gamma ray background counts in the irradiated GUN MOX rods made the measurement difficult. Axial fission rate distributions were used for evaluating axial buckling values of the cores. In order to obtain the information of neutron flux distributions, core radial activation rate distributions were measured using activation in reactions, 59Co (n, γ) 60Co, of Co wires for the irradiated MOX core; the wires were placed at the centers of the water channels in the irradiated MOX bundle. The wires were placed at the corners of the fuel cells in the driver region. shows the locations of fuel rods and the points for which those measurements were performed. The measurement results and errors are given in Section 4.3 in the comparison with analysis results.
Figure 4. Configuration of the irradiated GUN MOX core [Citation2].
![Figure 4. Configuration of the irradiated GUN MOX core [Citation2].](/cms/asset/9f1131d9-6c92-4e6b-9f86-1c95d6f5bac9/tnst_a_649075_o_f0004g.gif)
Figure 5. Core axial height configuration of the irradiated GUN MOX core [Citation5].
![Figure 5. Core axial height configuration of the irradiated GUN MOX core [Citation5].](/cms/asset/066de57c-90f5-45db-a9da-7ef93ac7b6a9/tnst_a_649075_o_f0005g.gif)
Figure 6. Measurement points of fission rate and activation rate distributions for the irradiated MOX core [Citation2].
![Figure 6. Measurement points of fission rate and activation rate distributions for the irradiated MOX core [Citation2].](/cms/asset/266ff481-4dac-42cb-9fb6-b9e0b316de4b/tnst_a_649075_o_f0006g.gif)
4. Analysis of experimental data
The analysis of the experimental data consisted of inventory calculations of the 96 (= 16 × 6) regions in the test MOX rods and core calculations of the irradiated MOX core.
4.1. Inventory calculations of test MOX rods
4.1.1. Calculation method and conditions
Inventory calculations of the test MOX were made using SRAC [Citation7] with a 107-neutron energy group library prepared from JENDL-3.2 [Citation8]. Resonance cross sections were obtained using a hyperfine energy group calculation module PEACO [Citation9]. A general-purpose burnup chain model u4cm6fp104bp12T was used as a burnup chain library. It adopted heavy nuclides from 234U through 246Cm, 104 fission product nuclides and twelve burnable absorber nuclides [Citation7], which were specially prepared for neutronics analyses of isotopic composition measurement data of irradiated fuel.
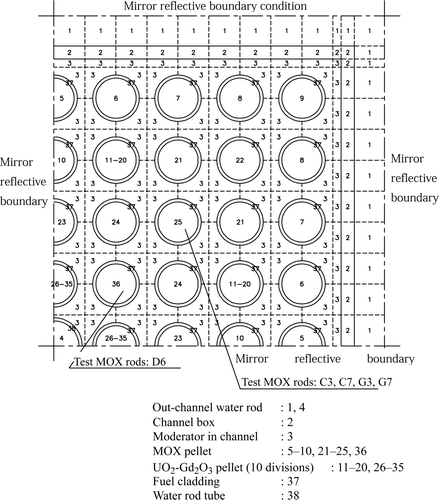
Geometrical model is a two-dimensional infinite assembly model aimed at one-fourth part of the assembly with a mirror reflection boundary condition as shown in . The geometrical and material specifications of the MOX assembly were provided by the program organizer. The calculation conditions of linear power density of the relevant MOX rods and in-channel void fraction were taken from the irradiation histories for 24 axial nodes provided by the program organizer. The Gundremmingen NPP was operated with almost nominal power in most periods of the cycles and with coastdown operations around the ends of the cycles. Therefore, an operating period of each cycle was divided into two periods representing nominal and coastdown operations, and average void fractions for the two periods were determined based on the irradiation histories of the axial nodes corresponding to the regions of the test MOX rods. The temperature and density of water in the water rods and out-channel gaps of the MOX assembly were set to 286.5°C and 0.7389 g/cm3, respectively, which correspond to a saturated water at a nominal dome pressure of 7.06 MPa of the reactor. The temperature of the cladding of fuel rods and fuel pellets were set to be 310°C and 520°C [Citation10] during all operating periods, respectively, since their temperatures were not given by the program organizer. The burnup steps were set to be from 0.1 to 1.0 GWd/t depend on the periods before or after burnup of burnable poison.
Figure 7. Geometrical and material model in inventory calculations of the MOX assembly.
4.1.2. Burnup determination
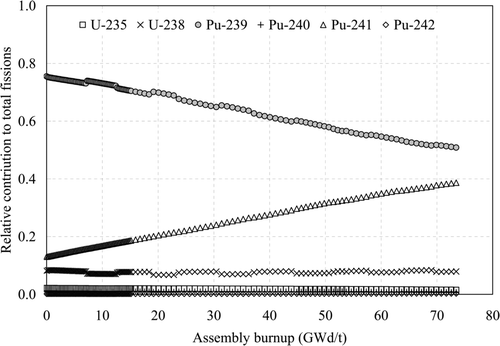
Preliminary burnup calculations were conducted for six representative segments of the test MOX rods to determine the average values of MeV/fission during irradiation. The regions calculated were the sixth regions of H1 (T), H5 (T), and H14 (T), and the first regions of H2 (B), H6 (B), and H15 (B). In the calculations, the assembly average linear power densities were set to the average values for the two periods for each cycles obtained from the linear power densities for each region of the test MOX rod. The irradiation histories of in-channel void fractions mentioned above were applied to the calculations. shows relative contributions of actinides to total fissions in the first region of H15 (B). It shows that the major contributions come from 239Pu and 241Pu in a burnuup range up to 80 GWd/t. The values of MeV/fission are 210.96 and 213.27 MeV/fission for thermal fissions of 239Pu and 241Pu, respectively [Citation11], and the difference between them is about 1%. The calculated average values of MeV/fission during irradiation were from 210.8 to 211.0 and the difference among them was 0.1%. Therefore, the average value of the six calculated values 210.9 were commonly used to convert the measured total fissions per unit length into the burnup in GWd/t.
Figure 8. Relative contribution to total fissions from major actinides in the first region of H15 (B).
4.1.3. Inventory calculation of the test MOX rods
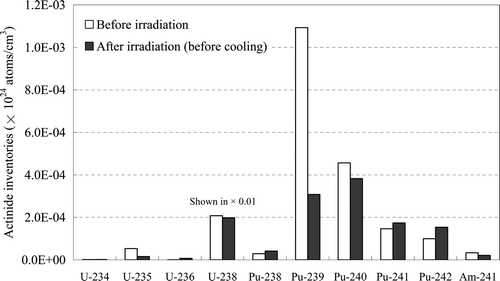
Inventory calculations of the 96 regions of the test MOX rods were performed in the above mentioned calculation models and conditions. The difference was that the assembly averaged linear power densities reflected the detailed linear power densities of the each region of the test MOX rods. In order to obtain the isotopic inventories corresponding to the measured burnup of each region shown in Table 3, the assembly average linear power densities during irradiation were adjusted to make the calculated burnup equal to the measured burnup. In this adjustment, the conditions other than the linear power densities were not changed. In order to obtain the isotopic inventories at the measurement of criticality, cooling periods were also considered. shows the calculated actinide inventories before irradiation and those after irradiation before cooling in the 2nd region of H14 (T).
Figure 9. Calculated actinide inventories before irradiation and those after irradiation before cooling in the 2nd region of H14 (T).
4.1.4. Comparison between calculated and measured inventories
In order to evaluate the accuracy of the inventory calculations, chemical assay data were provided for one fuel sample taken from H14 (T) in the program. The axial position of the sample is shown in . shows the ratios (C/E) of the calculated to measured isotopic inventories in mg/gU-238 for the sample taken from H14 (T) [Citation4].
The chemical assay techniques applied to the inventory measurement were those developed by the SCK/CEN, which is described in Ref. [Citation6] and has been confirmed to be relatively reliable except for some nuclides though the comparison with isotopic inventories measured by different organizations in some of international programs. The measured inventories provided the burnup of the measured fuel sample by applying Neodymium-148 Method [Citation12]. Ando et al. reported the burnup value of the sample as 69.90 GWd/t [Citation13]. They used the measured isotopic inventories of actinide nuclides and 148Nd, and the effective values of MeV/fission and fission yield of 148Nd which were calculated by a continuous energy Monte Carlo burnup calculation code MVP-BURN [Citation14,Citation15]. The burnup value determined by the above mentioned nondestructive burnup measurement was 73.6 GWd/t, which is 5.3% larger than that by the destructive measurement (Neodymium-148 Method), though the difference is within the nondestructive measurement error 5.9%.
One of trends seen in the C/Es is related that the difference in the burnup of the sample. Since the burnup used in the inventory calculation of the sample was 5.3% larger than that of the destructive measurement, the inventories of FP nuclides, most of which lineally increase with burnup, were overestimated by the inventory calculation. The other trend is related to the infinite assembly model used in the inventory calculation, which caused overestimation of fissile nuclides such as 239Pu, and 241Pu due to neglecting neutron energy interaction from adjoining UO2 assemblies during irradiation [Citation3,Citation13]. The other trend is seen in Am and metallic FP isotopes such as Ru and Ag. This would be possibly related to measurement errors in the chemical assay technique, which has been discussed in Refs. [Citation6,Citation13].
Alandre et al. [Citation3] have performed burnup calculation using CASMO-4 with the void histories and power densities taken from their core tracking calculation of Gundremmingen NPP, and reported C/Es on the actinide isotopes. Their report shows underestimation of the inventories of 235U, 236U, 238Pu, 240Pu by 7, 8, 5 and 7%, respectively, and overestimation of those of 239Pu, 241Pu, 242Pu, and 241Am by 2.5%, 2.5%, 10% and 13%, respectively. The amplitude of deviations from 1.0 in C/Es seems to be slightly smaller than that of the present study, and the difference between Alandre et al. and the present study would be mainly caused by the difference in the used nuclear data libraries.
4.2. Analysis of irradiated MOX core
4.2.1. Calculation method
The analysis of the irradiated MOX core was performed with deterministic codes and a continuous-energy Monte Carlo code. The analysis methods applied to the experimental cores were basically the same as those described in Refs. [Citation6,Citation16].
4.2.2. Deterministic calculation
In the analysis with the deterministic codes, lattice calculations of two dimensional cells of a 1.26 cm pitch composing the core were performed by using the collision probability module PIJ of SRAC [Citation7] with the 107-neutron energy group library prepared from JENDL-3.2 [Citation8], and JENDL-3.3 [Citation17]. The hyperfine energy group calculation module PEACO [Citation9] was used to obtain resonance cross sections. The cells of the lattice calculation include all components of the core, which are the fuel pellets of the different enrichments and burnup, the fuel cladding, the end plugs of the fuel rods, the structures and spacer of the test bundle, and the grids, support structures and moderator in the core. The isotopic inventories of the test MOX rods were obtained as mentioned in the previous sections. For modeling the fuel cells above the critical water level (dry lattices), the density of moderator was assumed to be 1/100 of that of the moderator in the cells under the critical water level to avoid aborting calculation in SRAC. A diffusion calculation module CITATION [Citation18] in SRAC and a transport calculation code THREEDANT [Citation19] were applied to core calculations in the calculation conditions of a 16-neutron energy group library [Citation20] and a three-dimensional geometry model. The B 1 and extended transport approximations were used to create the macroscopic transport cross sections in the calculations with CITATION and THREEDANT, respectively.
4.2.3. Monte Carlo calculation
The continuous-energy Monte Carlo code, MVP [Citation15] was used with the nuclear data libraries JENDL-3.2 and JENDL-3.3 for the three-dimensional calculations. Ten million active neutron histories were used for effective multiplication factors (k eff's) of the cores in the calculations with MVP. It was performed by calculating 1030 batches with 10,000 neutron histories per batch and skipping the initial 30 batches for the statistical process. Hundred million effective neutron histories were calculated for the fission and activation rate distributions of the cores. It was carried out by calculating 1030 batches with 100,000 neutron histories per batch and skipping the initial 30 batches for the statistical process.
4.3. Analysis results of core characteristics
4.3.1. Reactivity
4.3.1.1. Neutron multiplication factor
The calculated effective neutron multiplication factors k eff's of the irradiated MOX core are shown in Table 5. The diffusion calculations with JENDL-3.2 underestimate the k eff's of the irradiated MOX core by 1.0%Δk. This underestimation is also seen in the other cores in the REBUS program, which were loaded with irradiated fuel bundles and similar critical water levels of around 80 cm [Citation6,Citation16]. It is attributed to a transport effect unique to experimental cores of a small effective core volume. On the other hand, the transport calculation with JENDL-3.3 gives an underestimation of 0.3%Δk. The difference in k eff's between the diffusion and transport calculations includes that in the nuclear data libraries and the transport effect. The former is known from the results of k eff's calculated by MVP shown in Refs. [Citation6,Citation16] that the k eff's with JENDL-3.3 is about 0.5%Δk lower than that with JENDL-3.2 for the critical cores in the REBUS program. Therefore, the transport effect is estimated to be 1.2%Δk (= (0.99721 + 0.005 − 0.99033) × 100) for the irradiated MOX core.
The k eff's of the irradiated MOX core are close to those of the fresh BR3 MOX core, except for that of the diffusion calculation (SRAC-CITATION). The lower k eff of SRAC-CITATION for the fresh BR3 MOX core than that for the irradiated MOX core is attributed to the fact that the transport effect is larger in the fresh BR3 core with the lower critical water level of 61 cm than that in the irradiated MOX core with the higher water level of 85 cm.
Alandre et al. [Citation3] reported the k eff's of the irradiated MOX core calculated by three-dimensional calculations, where they used a Monte Carlo code MOCA and a nodal code VARIANT (formerly DIF3D). In the calculations with VARIANT, they used three running modes, simplified spherical harmonics (SP3), diffusion theory (DT), and nodal transport modes (NT). They created pin-cell homogenized cross section libraries by using CASMO-4 with neutron energy groups collapsed to five groups. The reported k eff's of MOCA, VARIANT-SP3, VARIANT-DT, VARIANT-NT are 1.00270, 0.99998, 0.98199, and 0.99750, respectively. They are comparable to the present results except that of VARIANT-DT.
4.3.1.2. Water level reactivity coefficient
The effective delayed neutron fractions β eff of the irradiated MOX core was calculated to be 734.7 pcm by using SRAC-THREEDANT with JENDL-3.3. The measured water level reactivity coefficients were converted from those in dollarrrrr/cm to those in pcm/cm (10−5 Δk/kk′/cm) by using it. The calculated results of water level reactivity coefficients are shown in Table 6 with the measurements. The ratios of the calculated results to the measurements are also shown in blankets in the table. The transport and Monte Carlo calculations generally give closer results to the measurements. The diffusion calculation gives overestimation of about 20%. This trend is similar to that in the other cores of the REBUS program [Citation16]. It is mainly attributed to the accuracy in the calculation of neutron leakage of the diffusion calculation especially in the axial direction to the dry lattice.
Alandre et al. [Citation3] reported the calculated results in a figure. They read as 63, 70, 75, and 77 pcm/cm for MOCA, VARIANT-NT, VARIANT-SP3 and VARIANT-DT, respectively which are comparable to those in the present study.
4.3.2. Fission rate distribution
4.3.2.1. Radial fission rate distribution
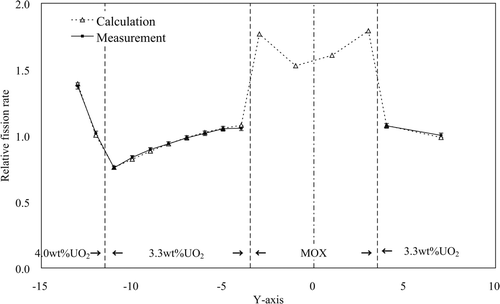
shows the normalized measured radial fission rate distribution of the irradiated MOX core [Citation5] where the average value of all the measured fission rates is normalized to be 1.0. As mentioned before, the measurement was applied only to the fuel rods in the driver region. The relative differences between the calculated and measured results as (calculation − measurement)/measurement in percent are shown in for SRAC-CITATION. The measured and calculated distributions along the Y axis at X = 0 are illustrated in , where the fission rates for the measured fuel rods shown in the figure are normalized to be 1.0, and the fission rates of the test MOX rods are shown only for calculated results. The variation in the calculated fission rates among the test MOX rods mainly reflects the difference in the residual fissile densities in the test MOX rods. The experimental error of 1.7% is also attached to the measurements. The evaluation of the experimental error is explained in Ref. [Citation6]. The relative differences between the calculated results of SRAC-THREEDANT and MVP and the measured results are not shown; however, they are similar to that of SRAC-CITATION. The differences between the diffusion and transport calculations are seen in the 4.0 wt% UO2 fuel rods at the peripheral region, which are due to the difference in the calculation models; however, they are not significant at the other fuel rods. The root mean squares (RMSs) of the relative differences are shown in Table 7. The RMSs are around two and slightly larger than the measurement errors.
Figure 10. Ratio (C/E) of calculated to measured isotopic inventories in mg/gU-238 for a sample taken from H14 (T) [Citation4].
![Figure 10. Ratio (C/E) of calculated to measured isotopic inventories in mg/gU-238 for a sample taken from H14 (T) [Citation4].](/cms/asset/d67c7578-3af6-4748-a5d4-9d87d887bb16/tnst_a_649075_o_f0010g.jpg)
Figure 11. Normalized measured fission rate distribution of the irradiated MOX core [Citation5].
![Figure 11. Normalized measured fission rate distribution of the irradiated MOX core [Citation5].](/cms/asset/8b6b41ac-2faf-4fb2-bb3a-e287d8e778a2/tnst_a_649075_o_f0011g.gif)
Figure 12. Relative differences between the calculated fission rate distribution of the SRAC-CITATION and the measurements for the irradiate MOX core as (calculation − measurement)/measurement in percent.
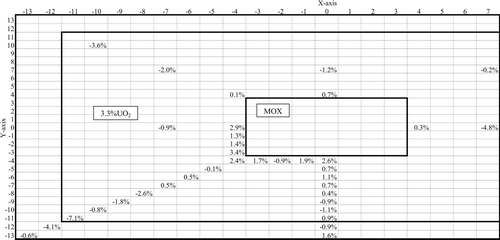
Figure 13. Relative fission rate distributions of the measurements and the calculations of SRAC-CITATION along Y axis at X = 0 for the irradiated MOX core.
Alandre et al. [Citation3] calculated the fission rates of the Y axis at X = 0 and the diagonal directions by using CASMO-4 (two-dimensional calculation) and reported 1.9% and 2.5%, respectively, as RMSs, which are comparable to those in the present study.
4.3.2.2. Axial fission rate distribution
Axial fission rate distributions were measured for four fuel rods in the driver region in the irradiated MOX core, and axial buckling values B z 2's were derived by fitting the measured axial fission rate distributions with cosine distributions. The calculated axial fission rates were also fitted with cosine distributions to obtain B z 2's, and Table 8 shows comparisons between the calculations and measurements. It is seen that the transport calculations relatively well reproduce the measurements; however, the diffusion calculation generally overestimates by 8–13%. This trend of the diffusion calculations is probably related to the systematic underestimation of k eff's seen in Table 5.
4.3.3. Activation rate distribution
Special procedures similar to those explained in Ref. [Citation6] were introduced for the analysis of the measured activation rate distributions, because direct calculations of activation of the wires were difficult in the core calculations in this study. The reaction rate R of 59Co (n, γ) 60Co was calculated as in the calculations of SRAC-CITATION and SRAC-THREEDANT, where
is the average thermal flux (<3.928 eV) of the specific cell, where the wire was placed, or that adjacent to the wire in the core calculations of CITATION and THREEDANT, and
is the ratio of the reaction rate of the wire to the average thermal flux of the relevant cell. The
were calculated by adopting two special cells of the 1.26 cm pitch which includes the Co wire and the adjacent fuel rods using the SRAC PIJ module shown in . One special cell is for the wires in the irradiated MOX bundle and the other for the wires in the driver region.
Figure 14. Cell models for calculation of in the irradiated MOX core.
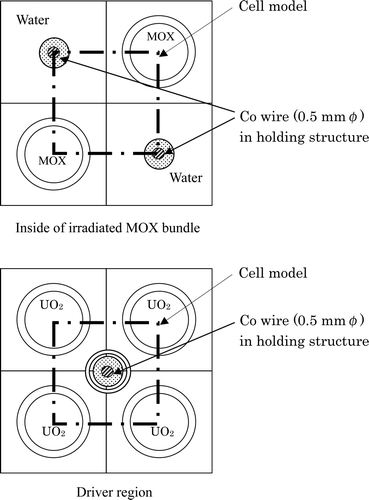
In the calculations using MVP, neutron spectra were calculated for the special tally regions of the moderator, which locally represent the Co wires. The tally region was 6 mmφ × 50 mm height, and placed at the middle of the water channel in the irradiated MOX bundle and at the corner of the fuel cell in the driver region. For the statistics of the Monte Carlo calculations, the tally region was larger than the actual size of the wire. The activation rate R was calculated as , where
is neutron energy spectrum for the special tally regions in the sixteen energy groups obtained from the core calculation of MVP, and
is a macroscopic cross section of the wire in the 16 energy groups obtained from the SRAC calculations for the above-mentioned special cells.
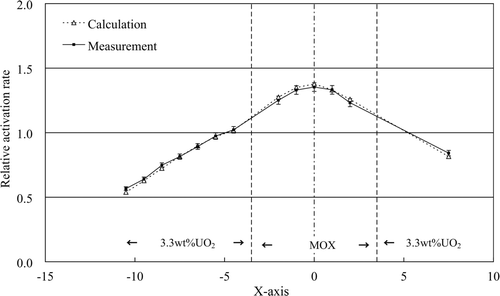
The measured activation rate distribution for the irradiated MOX core is shown in , in which the measurement data are normalized so that their average value is 1.0. The measured value is shown in the cell of the measurement point for the irradiated MOX bundle and in the left-upper cell of them for the driver region. Relative differences between the calculated and measured results as (calculation − measurement)/measurement in percent are shown in for SRAC-CITATION. illustrates the measured and calculated distributions along the diagonal direction of the core, in which the experimental error of 2.5% is also attached to the data. As seen in , the activation rates are smoothly changed over the core including the irradiated MOX bundle. The relative differences between the calculated results of SRAC-THREEDANT and MVP and the measured results are not shown; however, Table 9 shows the RMSs of the differences between the calculated and measured results. The RMSs of SRAC-THREEDANT is similar to those of SRAC-CITATION, and their RMSs are comparable to the measurement error of 2.5%. Those of MVP are larger than the deterministic calculations. It would be partly attributed to that the MVP calculation adopted the tally region of 6 mmφ × 50 mm height for the neutron flux calculation of the Co wire, which was larger than the actual size.
Figure 15. Normalized measured co-activation rate distribution of the irradiated MOX core.

Figure 16. Relative differences between the calculated co-activation rate distribution of the SRAC-CITATION and the measurements for the irradiated MOX core as (calculation − measurement)/measurement in percent.
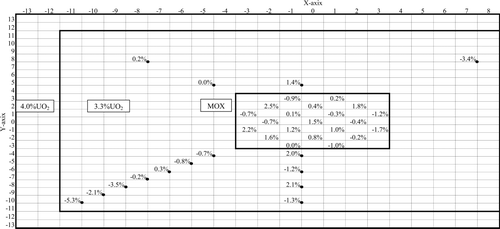
Figure 17. Relative co-activation rate distributions of the calculations of SRAC-CITATION and the measurements along a diagonal direction of the irradiated MOX core.
4.4. Analysis of burnup reactivity
4.4.1. Burnup reactivity
The direct measurement of burnup reactivity by using critical experiments is a unique feature of the REBUS program. In the experiment, burnup reactivity is defined as
Figure 18. Principle of determination of burnup reactivity in the REBUS program.
In the experiment, = 1.0 and, therefore,
Since the measurements gave information about the water level reactivity coefficients (∂ρ/∂h), ρ was calculated using (∂ρ/∂h) evaluated from the measurements as follows:
Here, Hfresh is the critical core height of the fresh MOX core. One-group diffusion theory gives
4.4.2. Correction of isotopic inventories in irradiated MOX bundle
The comparison between the calculated and measured isotopic inventories for the chemical assay sample shows the disagreements for some nuclides as shown in . Therefore, the influence of the accuracy in isotopic inventory calculations on the burnup reactivity was studied in the same way shown in Ref. [Citation6]. Assuming that the C/Es of the inventory calculation () can be applied to the whole MOX rods in the bundle, and are unity at the burnups = 0 and proportional to the burnups, the isotopic inventories in the 96 regions in the irradiated MOX bundle were corrected in order to obtain tentative most probable isotopic inventories. The corrected isotopic inventory is given by
With such corrected inventories, core calculations of the irradiated MOX core were performed again using SRAC-THREEDANT with JENDL-3.3. The calculated k
eff's and burnup reactivity of SRAC-THREEDANT are shown in Table 11 as Case 1. Since decreases by 0.101%Δk, burnup reactivity is calculated to be −2.54%Δk/kk', as shown in Table 11. It results in a calculation error of −0.13%Δk/kk‘. The effect of the decreases in reactivity slightly influence the fission rate and activation rate in the irradiated MOX bundle; however, the change in these distributions is not significant.
In order to find the nuclides that are under the inventory correction and largely contribute to the change in , the sensitivities of k
∞ of a typical MOX cell to the inventories of the nuclides in the MOX fuel were calculated by slightly changing the number density of each nuclide and calculating change in k
∞. The selected MOX cell corresponds to the axial region 2 of the test MOX rod H14 (T), which includes the chemical assay sample. The effects of the corrections of the inventories on k
∞ were analyzed using the sensitivity of k
∞ to isotopic inventories. shows contribution of the correction of the inventories of the nuclides to k
∞. The sum of all contributions in k
∞ is −0.01487 Δk. The figure indicates that prominent contributions are from 239Pu, and 241Pu which decrease k
eff of the irradiated MOX core. Other contributions are from 241Am, and a group of metallic FP nuclides such as 99Tc, 101Ru, 103Rh, 105Pd, 108Pd, and 109Ag, which increase k
eff of the irradiated MOX core.
Figure 19. Contribution of each nuclide to k ∞ of a MOX cell of an axial region 2 of the test MOX rod of H14 (T) from corrections in isotopic inventories.
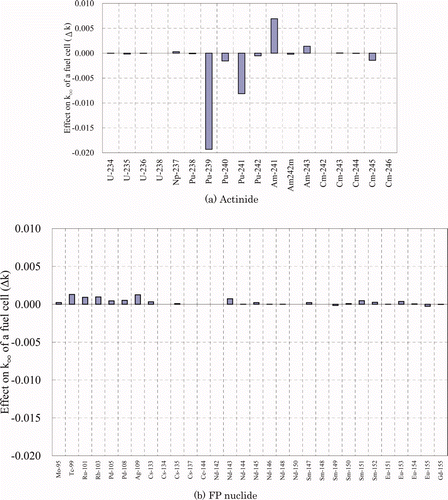
The major inventory of 241Am is originated from the decay of 241Pu since the ratio of 241Am to 241Pu at the end of irradiation is only 0.12 for the axial region 2 of the test MOX rod H14(T), and there is the long cooling time 1723 day (about 4.7 y) at the chemical separation of Am from Pu. The number densities of 241Pu and 241Am at a cooling time t after the end of irradiation, NP(t) and NA(t), are expressed as
These considerations lead to an alternative correction to the isotopic inventories as Case 2 that postulate the C/E to 241Am equals to that of 241Pu, and the C/Es of Mo, Tc, Ru, Rh, Pd, and Ag equal to 1.0. With this alternative corrected inventories, of SRAC-THREEDANT for the irradiated MOX core were estimated based on the sensitivity analysis of k
∞ to the isotopic inventories for the relevant nuclides, which was obtained for the axial region 2 of the test MOX rod H14 (T). Table 11 shows the value of
, ρ
c, and the relative difference to the measurement. The absolute value of the burnup reactivity increased due to the further decrease of
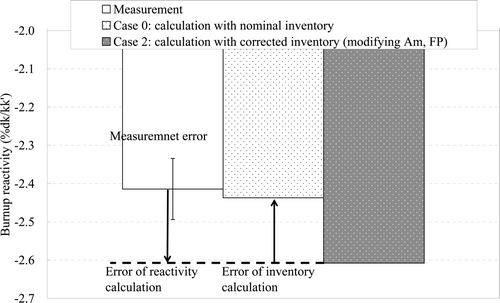
, and the deviation of the calculated burnup reactivity from the measurement became larger. illustrates the calculated burnup reactivity compared with the measurements. Assuming the calculated burnup reactivity of Case 2 represents that with the most probable isotopic inventories, the difference of 0.17%Δk/kk′ between those of Cases 0 and 2 corresponds to the calculation error due to the inventory calculations, which include the error in burnup of the test MOX rods attributed to the uncertainty in the nondestructive burnup measurement. The difference of −0.19%Δk/kk′ of calculated burnup reactivity of Case 2 to the measurement corresponds to the calculation error caused by the reactivity calculations. This observation indicates that the inventory calculation error compensated the reactivity calculation error, which made the total calculation error (−0.02%Δk/kk′) small.
Figure 20. Measured and calculated burnup reactivity of the irradiated MOX bundle.
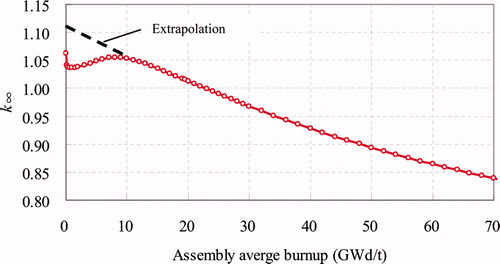
Since the moderator to fuel ratio of the irradiated MOX bundle was close to that at a hot operating condition of typical BWR MOX assembly as mentioned in the former section, the comparison of the calculated burnup reactivity with the measurement can be used to evaluation of calculation errors in burnup calculations of the MOX assembly. shows changes in k ∞ with burnup for the axial node of the 9 × 9 assembly under the operating condition, which includes the region 2 of the test MOX rod H14 (T). From the changes of k ∞, burnup reactivity, which is defined here as difference in k ∞ from the beginning of life to about 61 GWd/t, is calculated to be −25%Δk/kk′. The value of k ∞ at BOL were obtained by extrapolating those after burnup of burnable poison (Gd2O3). Since the measured burnup reactivity corresponds to −25%Δk/kk' in the assembly calculation, the calculation error in the assembly calculation is estimated to be −0.2%Δk/kk’ (= 25/2.41 × −0.02) from the difference between the calculated reactivity of SRAC-THREEDANT for the nominal calculation inventories and the measured burnup reactivity, the calculation error in the inventory calculation is 1.7%Δk/kk′ (= 25/2.41 × 0.17), and the calculation error in the reactivity calculation is −2.0%Δk/kk′ (= 25/2.41 × −0.19).
Figure 21. Infinite multiplication factor (k ∞) of a typical axial node of the 9 × 9 MOX assembly.
5. Conclusions
The analysis of the data set on the BWR MOX fuel in the REBUS program was performed with the diffusion calculation (SRAC-CITATION), transport calculation (SRAC-THREEDANT), and continuous-energy Monte Carlo calculation (MVP) codes to evaluate the accuracies in their calculation methods. The biases in k eff's of the critical cores were about −1.0%Δk for the diffusion calculations (JENDL-3.2), −0.3%Δk for the transport calculations (JENDL-3.3) and 0.2%Δk for the Monte Carlo calculations (JENDL-3.2). It is noted that, for small experimental cores like those in the REBUS program, diffusion calculations show the underestimations of k eff due to the transport effect. On the other hand, the transport and the Monte Carlo calculations give good estimation of the criticality judging from the commonly accepted criteria of 0.5%Δk in the biases. The diffusion calculation overestimated the water level reactivity by 20%; however, the transport and the Monte Carlo calculations give good estimation.
The measured core radial fission rate distributions were generally well reproduced using the three types of calculations. The measured axial buckling values were overestimated using the diffusion calculations and generally well reproduced using the transport calculations. The measured activation rate distributions were generally well reproduced using the diffusion and transport calculations. The Monte Carlo calculation showed relatively large deviations from the measurements, which would be partly attributed to the geometrical model for the neutron flux calculation of the Co-wire.
The measured burnup reactivity was well reproduced by the three adopted calculation methods considering the measurement and calculation errors. By using the differences between the calculated and measured isotopic inventories for major nuclides, the tentative approach was performed for splitting of the calculation error in the burnup reactivity into those attributed to the inventory calculation and reactivity calculation. It showed that the inventory calculation error compensated the reactivity calculation error.
Acknowledgment
The authors would like to thank the staff of BELGONUCLEAIRE and SCK · CEN for their organizing the REBUS program and the experimental works.
Notes
1. Reactivity Tests for a Direct Evaluation of the Burnup Credit on Selected irradiated LWR fuel bundles.
2. The correction was applied to 47 nuclides, for which the C/Es are given, except for 238U.
References
- 1999 . Full Core Loading of Mixed Oxide Fuels in Advanced Boiling Water Reactors , Nuclear Safety Commission of Japan . [in Japanese]
- Lance , B. , Marloye , D. Moerenhout , J. 2003 . Critical experiments: Recent and future international progammes in VENUS . Proceedings of the International Conference on Nuclear Critical Safety, ICNC2003 . October 20–24 2003 .
- Alander , A. , Misu , S. Thareau , S. 2008 . AREVA NP burnup credit investigation on irradiated MOX fuel within the REBUS BWR programme . Proceedings of the International Conference on PHYSOR 2008 . September 14–19 2008 .
- Yamamoto , T. , Ando , Y. and Hayashi , Y. 2008 . Analysis of core physics experiments on irradiated BWR MOX fuel in REBUS program . Proceedings of the International Conference on PHYSOR 2008 . September 14–19 2008 .
- 2009 . Experimental Results of REBUS Program and Their Theoretical Analysis , JNES-SS-0904, Japan Nuclear Energy Safety Organization . [in Japanese]
- Yamamoto , T. , Kawashima , K. Ando , Y. 2009 . Analysis of core physics experiments on fresh and irradiated BR3 MOX fuel in REBUS program . J. Nucl. Sci. Technol , 46 : 484
- Okumura , K. , Kugo , T. Kaneko , K. 2007 . SRAC2006: A Comprehensive Neutronic Calculation Code system , JAERI-Data/Code 2007-004, Japan Atomic Energy Institute .
- Nakagawa , T. , Shibata , K. Chiba , S. 1995 . Japanese evaluated nuclear data library version 3 revision-2 . J. Nucl. Sci. Technol , 32 : 1259
- Ishiguro , Y. PEACO-II: A Code for Calculation of Effective Cross Section in Heterogeneous System , 1974 JAERI-M-5527, Japan Atomic Energy Institute .
- Ando , Y. and Takano , H. 1999 . Estimation of LWR Spent Fuel Composition , JAERI-Research 99-004, Japan Atomic Energy Institute . [in Japanese]
- Tasaka , K. , Katakura , J. Ihara , H. 1990 . JNDC Nuclear Data Library of Fission Products – Second Version , JAERI-1320, Japan Atomic Energy Institute .
- 2005 . Standard Test Method for Atom Percent Fission in Uranium and Plutonium Fuel (Neodymium-148 Method) , ASTM E321-96 (Reapproved 2005), ASTM-International .
- Ando , Y. , Yamamoto , T. and Sugo , Y. 2011 . Analysis of measured isotopic compositions of high-burnup BWR MOX fuel . J. Nucl. Sci. Technol , 48 : 384
- Okumura , K. , Mori , T. Nakagawa , M. 2000 . Validation of a Continuous-Energy Monte Carlo Burn-up Code MVP-BURN and Its Application to Analysis of Post Irradiation Experiment . J. Nucl. Sci. Technol , 37 : 128
- Nagaya , Y. , Okumura , K. Mori , T. 2005 . MVP/GMVP II: General Purpose Monte Carlo Codes for Neutron and Photon Transport Calculations based on Continuous Energy and Multigroup Methods , JAERI-1348, Japan Atomic Energy Institute .
- Yamamoto , T. , Ando , Y. Hayashi , Y. 2011 . Analysis of core physics experiments on fresh and irradiated PWR UO2 fuels in the REBUS program . J. Nucl. Sci. Technol , 48 : 1025
- Shibata , K. , Kawano , T. Nakagawa , T. 2002 . Japanese Evaluated Nuclear Data Library Version 3 revision-3: JENDL-3.3 . J. Nucl. Sci. Technol , 39 : 1125
- Fowler , T.B. , Vondy , D.R. and Cummingham , G.W. 1969 . Nuclear reactor analysis code: CITATION , ORNL-TM-2496, Oakridge National Laboratory .
- Alcouffe , R.E. 1995 . DANTSYS: A Diffusion Accelerated Neutral Particle Transport Code System , LA-12969-M, Los Alamos National Laboratory .
- Kanda , K. , Yamamoto , T. Matsuura , H. 1998 . MOX fuel core physics experiments and analysis – aiming for Plutonium effective use . Nihon-Genshiryoku-Gakkai Shi (J. At. Energy Soc. Jpn.) , 40 : 834 [in Japanese]
- Roque , B. , Thiollay , N. Marimbeau , P. 2002 . Experimental validation of the code system “DARWIN” for spent fuel isotopic predictions in fuel cycle applications . Proceedings of the International Conference on the PHYSOR 2002 . October 7–10 2002 .