Abstract
In a nuclear power plant accident, radioactive nuclides may be released which are distributed uniformly on the ground. If estimation of dose rate from such a source by a Monte Carlo calculation is attempted, some difficulty is encountered because the calculation efficiency is very low. To solve this low efficiency problem, we show that a plane isotropic source can be transformed into a point isotropic source by changing the detector shape from a unit sphere to a plane. We verified the validity of this transformation by the numerical comparison of unscattered photon fluence. As an example of this transformation, the ambient dose rate D i was calculated from the uniform radioactive nuclide distribution on the ground using the EGS5 Monte Carlo code. We also measured the radioactivity and ambient dose rate (M) on the KEK campus within a month after the releases from the Fukushima No. 1 Nuclear Power Plant accident. Using radioactivity data and D i, we calculated the ambient dose rate (C). The calculated and measured ambient dose rates agreed reasonably well; their ratio (C/M) was 0.62 to 1.28.
1. Introduction
Monte Carlo electron–photon transport codes such as EGS5 [Citation1] are very useful tools for solving many types of radiation transport problems. However, it is difficult to use a Monte Carlo program to solve a problem that involves scoring photons from a large plane source using a unit sphere detector because the calculation efficiency is very low and the calculation time becomes very large. Most of the photons that are generated at position far away from the unit sphere detector have only very small contribution to detector response as the contribution is proportional to the inverse of square of the distance between the source and the detector. Consequently, the size of the plane source is restricted by the limit placed on the calculation time. It is effectively impossible to treat an infinitely large plane source with a unit sphere detector in a Monte Carlo calculation.
If a system consisting of a plane source and unit sphere detector is transformed into a system consisting of a point source and plane detector, the calculation efficiency problem can be solved. In the case of parallel beams, it is well known that this transformation is possible and it has been used in many situations. For example, Chilton et al. [Citation2] state that “it is intuitively obvious that this kind of geometric transformation gives the same expected result.” In addition, Shultis and Faw [Citation3] state that the dose is preserved after the geometric transformation, which involves the exchanging of the source region and detector region, as long as the total source intensity is preserved. However, no specific equations, which can be utilized for programming a practical Monte Carlo code have been provided for individual geometries.
In a nuclear power plant accident, radioactive nuclide may be released which distribute uniformly on the ground. If the relation between the radioactivity and the ambient dose is known, either one can be estimated by measuring the other. However, it is difficult to determine this relation using the Monte Carlo code, as described above. Therefore, in the first part of this article, we show that the transformation of a system consisting of a plane isotropic source and unit sphere detector into a system consisting of a point isotropic source and plane detector is possible. Then, we describe the calculation of the ambient dose from a plane isotropic source for radioactive nuclides, which were released from the Fukushima No. 1 Nuclear Power Plant, as an example of the geometrical transformation. We measured the ambient dose rate and intensity of radioactivity in KEK. We compared the measured and calculated ambient dose rates.
2. Calculation
2.1. Plane isotropic source and unit sphere detector
2.1.1. Without shield
To estimate the photon flux generated from a plane isotropic source, we consider a disc isotropic source of radius r
1 and central point O, as shown in . We set the source intensity per unit area and total source intensity as I (cm−2 s−1) and (s−1), respectively. We place a unit sphere detector at point V which is located on the central axis of the disc.
Figure 1. System consisting of plane isotropic source and unit sphere detector.
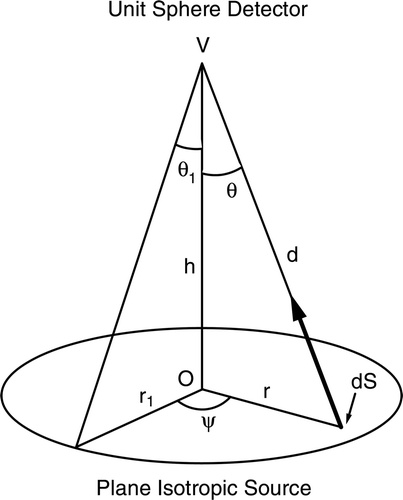
The partial photon flux dφ at V due to a photon from a tiny area dS of the disc is
The total photon flux at V is
By using the relations, tan θ = r/h and dr/dθ = h/cos2θ, we get
Here, we use the variable u = cos θ:
2.1.2. With shield
We consider that a slab shield of thickness t and attenuation coefficient μ exists between the disc source and point V. As the photon path in this shield is equal to , the photon fluence at V is
In Equation (2), exp{−μt/cos θ} and δs on the right-hand-side represent unscattered and scattered components, respectively. B(μt, cos θ) represents the increase of photon fluence due to scattering.
Here, we use the relation tan θ = r/h as in the case in which no shield is used:
Then, we introduce the exponential integral E 1,
By setting B = 1, we can represent the unscattered part φ as
Most of the equations presented in this subsection have already been described in standard radiation shielding textbooks such as [Citation4]. We have presented these equations so that the reader can easily follow the derivation in the next subsection.
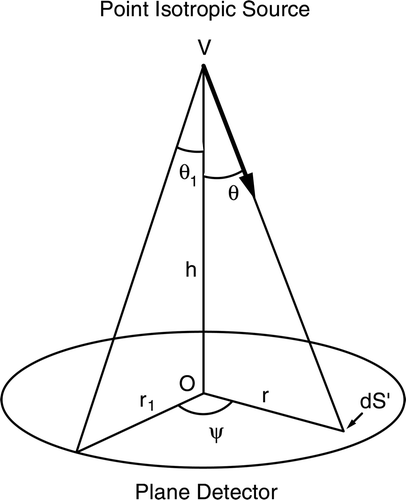
2.2. Point isotropic source and plane detector
2.2.1. Without shield
We exchange the form of the source and the detector, i.e. we consider a system consisting of a unit sphere isotropic source and a plane detector. As a unit sphere source and a point source are equivalent in a Monte Carlo calculation, we change the source shape from a unit sphere to a point to get the system shown in . We use a disc-shaped detector of radius r 1 and a photon source at point V. The intensity of the photon source is set as identical to the total source intensity of the plane isotropic source, I tot (S−1). We consider a solid angle dS′, which is defined as a product of sin θ dθ and dψ. As the source is emitted isotropically, the photon intensity emitted from V into the solid angle dS′ is
Figure 2. System consisting of point isotropic source and plane detector.
In the system before the geometry transformation, we use the unit sphere detector. In this case, output of photon fluence does not depend on photon incident direction. In this article, we discuss exchanging the shapes of the source and detector. But the function of the detector should be maintained after the transformation. Accordingly, the plane detector must have a function that output of photon fluence does not depend on photon incident direction. When a photon is incident on the plane detector normally, photon fluence is obtained by dividing the incident number of photons by the area of the plane detector. When the plane detector is placed obliquely to the photon direction, the value which is obtained by dividing the incident number of photons by the area of the plane detector is cos θ times smaller than that in the normal incident case. Accordingly, we have to divide the incident number of photons by cos θ so that output of photon fluence does not depend on incident direction when photons are incident to the detector from an arbitrary direction.
To get photon fluence at the position of the plane detector, we integrate dφ′/cos θ over the detector region and divide it by the detector size :
Here, tan θ1 = r 1/h, as shown in . We substitute v = cos θ and dv/dθ = −sin θ:
This equation is identical to Equation (1). Thus, the two systems are mathematically identical.
2.2.2. With shield
The photon intensity that is emitted from V toward dS′ and reaches dS′ is given as
Here, represents the contribution of scattering. After dividing dφ′ by cos θ, we integrate dφ′ and obtain
Here, B′(μt, cos θ) represents the increase of photon fluence due to scattering. As the structure of the shield is not changed in the transformation, B(μt, cos θ) = B′(μt, cos θ). Then this equation is identical to Equation (3). Thus, the two systems are mathematically identical when we have a slab shield between the source and the detector.
So far, we have considered a transformation for a plane source. However, this transformation is also possible for a “modified” plane source that has some distribution in the depth direction because the overlapping of the shield and source regions does not affect the validity of the discussion presented above.
2.3. Numerical comparison
To verify the validity of this transformation, we performed a numerical comparison. We compared the values obtained from an analytical equation (Equation (1) and Equation (4) for the unshielded and shielded cases, respectively) and from the Monte Carlo calculation. In the former, the plane isotropic source with uniform distribution was assumed. In the EGS5 calculation, the point isotropic source was specified and only unscattered photons were counted with the plane detector, which corresponds to the system after the transformation. We used 365 keV photons from I–131 for the comparison, and either air or iron was used as shielding material. As listed in and 2 for the unshielded and shielded cases, respectively, the results of the analytical calculation and those for the unscattered photons from the EGS5 Monte Carlo calculation agreed well. Accordingly, the validity of the transformation was clearly verified by numerical comparison.
Table 1. Comparison of photon fluence (unshielded case).
Table 2. Comparison of unscattered photon fluence (shielded case).
3. Example application
As an example of the transformation, we calculated the air kerma K i and the ambient dose rate D i using the general-purpose electron–photon Monte Carlo transport code EGS5 [Citation1]. The source was radioactive nuclides released by the Fukushima No. 1 Nuclear Power Plant in the accident following the 11 March 2011 earthquake and tsunami; nuclides were distributed uniformly on the ground. The calculation geometry in the original problem and that after transformation is shown in , respectively. The calculation geometry consisted of a soil layer of 6 m thickness and an air layer of 2000 m thickness. The soil composition and density (1.6 g/cm3) were taken from [Citation5]. The horizontal size of both the layers was infinite. A radioactive source with a radioactivity of unit strength (1 Bq/cm2) was placed in the soil surface. I-131, I-132, Cs-134, Cs-137, and Te-132 were the sources considered. The gamma ray energies and the emission ratios were taken from Ref. [Citation6]. These were major radioactive nuclides which we observed on the KEK campus after the power plant accident. We ignored Cs-136 because its contribution was small. The number of incident photons was set as 105 for each radioactive nuclide. The calculation results for air kerma K i and the ambient dose rate D i for a radioactivity of unit strength (1 Bq/cm2) on the ground surface are listed in and 4, respectively. The heights of the estimator were set as 10, 50, 100, and 150 cm. The standard deviations of obtained air kerma and the ambient dose rate were less than 2% and 1% for 10 cm and 100 cm, respectively. Both air kerma and the ambient dose rate decreased as the estimator height was increased.
Figure 3. Calculation geometry: (a) original problem and (b) transformed problem.
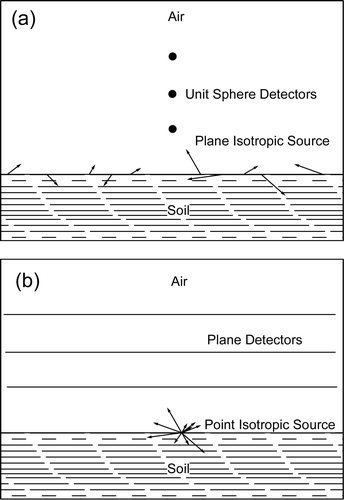
Table 3. Conversion factor for air kerma, K i (μGy/h per Bq/cm2), calculated by EGS5.
Table 4. Conversion factor for ambient dose rate, D i (μSv/h per Bq/cm2), calculated by EGS5.
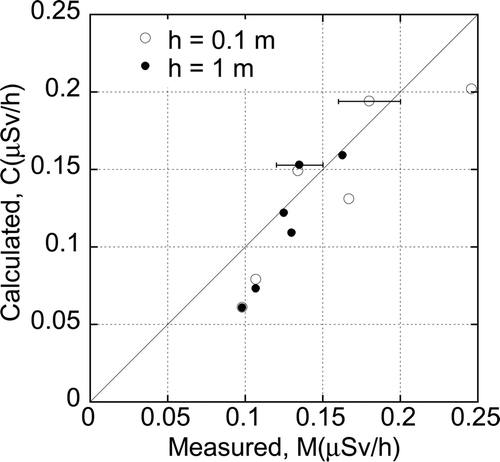
The ambient dose rates were measured on the KEK campus on 1 April and 11 April 2011, using NaI gamma ray survey meters (Aloka, TCS-161 and TCS-171) near the ground surface and at a height of 1 m. On 1 April, measurements were made at one place and on 11 April, they were made at five places. We calibrated the survey meters using Cs-137 for ambient dose. On the same day and at the same places where the ambient dose rate measurements were made, we also collected soil samples for radioactivity measurement. Each soil sample was 5.7 cm in diameter and 0.5–2.6 g/cm2 in depth. We used a portable Ge detector (Canberra) for the radioactivity measurements and ISOCS software for determining the efficiency. The decay correction was applied in a separate calculation. On 1 April, we collected soil samples of two layers, as shown in . Radioactivity in the second layer was 2% of the sum of two layers in the measurement of 1 April. The measured radioactivities are listed in .
Figure 4. Geometry of soil sample. The sample size was φ 5.7 cm × 0.5–2.6 g/cm2.
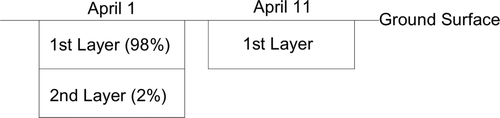
Table 5. Measured radioactivity concentration on the ground in the KEK campus (Bq/cm2).
We obtained the calculated value of the ambient dose rate (C) as
Here, D i and S i are the ambient dose rate per unit radioactivity (μSv/h per Bq/cm2; calculated) and the radioactivity on the ground (Bq/cm2; measured), respectively. i indicates the type of radioactive nuclide. Bg is the intensity of natural background, which was assumed to be 0.06 μSv/h based on the radiation dose level in operational measurements before the 11 March earthquake. The calculated (C) and measured (M) ambient dose rates are compared in . In the ambient dose rate measurement on 1 April, we did not record the calibration factor and the serial number of the survey meter. Then, we selected smallest and largest calibration factors of the survey meters of the same type in our department to get the possible area of the measured value. The end point of the error bar in corresponds to the data on 1 April with these two calibration factors. The C/M ratio was 0.62–1.28; the agreement between C and M was reasonably good. In addition, the C/M ratios near the ground surface and at 1 m height were close to each other; therefore, the calculated D i was capable of reproducing the ambient dose rate at both heights.
Figure 5. Comparison of calculated and measured ambient dose rates. Calculated values were obtained using the EGS5 code with a point isotropic source.
4. Conclusion
We showed that a plane isotropic source can be transformed into a point isotropic source by changing the detector shape from a unit sphere to a plane in Monte Carlo radiation transport calculation. We verified the validity of this transformation by the numerical comparison of unscattered photon fluence.
We showed that the relation of radioactivity density on the ground and the ambient dose after the Fukushima No. 1 Nuclear Power Plant accident can be reproduced by EGS5 calculation. The calculated (C) and measured (M) ambient dose rates agreed reasonably well; the ratio C/M was 0.62–1.28.
Acknowledgments
We express our special thanks to Dr. M. Hagiwara, Mr. S. Takahara, and Mr. K. Hozumi who helped us in measuring the ambient dose rates on the KEK campus.
Related Research Data
References
- Hirayama , H. , Namito , Y. , Bielajew , A.F. , Wilderman , S.J. and Nelson , W.R. 2005 . The EGS5 Code System KEK Report 2005-8, SLAC-R-730, High Energy Accelerator Research Organization (KEK), Stanford Linear Accelerator Center (SLAC)
- Chilton , A.B. , Shultis , J.K. and Faw , R.E. 1984 . Principles of Radiation Shielding , Upper Saddle River , New Jersey : Prentice-Hall Inc .
- Shultis , J.K. and Faw , R.E. 1996 . Radiation Shielding , Upper Saddle River , New Jersey : Prentice-Hall Inc .
- Nakamura , T. 2001 . Radiation Physics and Accelerator Safety Engineering , Tokyo : Chijin Shokan . [in Japanese]
- Eckman , K.F. and Ryman , J.C. 1993 . External Exposure to Radionuclides in Air, Water, and Soil , Oak Ridge National Laboratory . Federal Guidance Report No.12, EPA-402-R-93-081
- Japan Isotope Association . 2001 . Radioisotope Pocket Data Book , 10th ed. , Tokyo : Maruzen . [in Japanese]