Abstract
An optimization approach to establish an appropriate multi-group energy structure for boiling water reactor (BWR) pin-by-pin fine mesh core analysis is proposed. In the present approach, the number of energy groups of cross sections is successively reduced or increased. In order to select an energy group boundary that is removed or added, performances of all possible candidates of energy group structures are tested in multi-assembly geometries. Then, the energy group boundary, which provides the minimum difference of the k-infinity or the pin-by-pin fission rate distribution, is finally removed or added. This procedure is repeated until the number of energy groups reaches to the target value. In order to confirm the applicability of the present approach, the accuracies of the k-infinity and the pin-by-pin fission rate distribution are investigated in various 2 × 2 multi-assembly geometries with the established energy group structure. From the verification results, the differences of the k-infinity and the pin-by-pin fission rate distribution between the reference (fine) and the established (coarse) energy group structure are small in the various 2 × 2 multi-assembly geometries. Therefore, we can conclude that the present approach is efficient to establish an appropriate energy group structure for BWR pin-by-pin fine mesh core analysis.
1. Introduction
Nuclear cross sections strongly depend on neutron energy (e.g. their behaviors in resonance regions). In order to directly capture such energy dependence of cross sections, several tens of thousand of energy groups should be used in core calculations. However, such ultra-fine group calculations are impractical for core calculations from the view point of the computational time and the required memory. Therefore, in a conventional core analysis, the number of energy groups is reduced as the calculation geometry becomes large.
In the current BWR core analysis using the advanced nodal method, mostly three-step calculation (i.e. pin-cell, lattice, and core calculations) are carried out. At first, in a pin-cell calculation, dozens to a few hundred energy groups are used and effective microscopic cross sections are calculated. The number of energy groups of the effective microscopic cross sections is reduced to several to several dozen in prior to a lattice calculation. Then, a lattice calculation is carried out in heterogeneous fuel assembly geometry with several to several dozen energy group the cross sections obtained in the previous step. Heterogeneous cross sections are homogenized within a fuel assembly and the number of energy groups is reduced to a few numbers. Finally, a core calculation is carried out with a few energy groups using the assembly homogenized cross sections obtained in the previous step [Citation1,Citation2]. In general, the energy group structures used in the above calculations have been empirically determined.
In a highly heterogeneous core (e.g. a mixed-oxide (MOX) fuel or a high burn-up fuel loaded core), the spatial behavior of neutron spectrum becomes more complicated. Therefore, in order to accurately capture such complicated neutron spectrum variation and to precisely evaluate important core parameters (e.g. core reactivity and power peaking factor), various efforts have been devoted to improve core calculation methods. For example, a sub-meshing of fuel assembly or an on-the-fly boundary condition adjustment through iteration of lattice physics calculations has been studied [Citation3,Citation4]. In the sub-meshing of fuel assembly, each fuel assembly is divided into N × N homogenized rectangular meshes in core calculations, while each fuel assembly is homogenized into a 1 × 1 mesh in conventional BWR core calculations. In the on-the-fly boundary condition adjustment, heterogeneous assembly calculations with albedo boundary conditions are performed and the homogeneous cross sections are recalculated in core calculations (i.e. lattice physics calculations are embedded into core calculations).
For the highly heterogeneous core calculation, a finer energy group structure is desirable to accurately consider the spatial variation of neutron spectrum. However, if the number of energy groups becomes larger, the determination of an appropriate energy group structure based on an engineering or an empirical approach would become more difficult due to the large freedom on the choice of energy group boundaries. For example, when an 8 energy group structure is determined by collapsing a 40 energy group structure, there are approximately 15 million possible combinations of the energy group structure. Therefore, to establish a theoretical or a numerical approach is necessary to determine an appropriate energy group structure for core calculations.
Recently, a pin-by-pin approach is studied and is applied for BWR core calculations as a candidate of the next generation core analysis methods [Citation5–Citation8]. However, the number and the structure of energy groups, which are suitable for the pin-by-pin core analysis, have not been extensively investigated yet. For example, the validity of the 8-group structure used in the previous study for the BWR pin-by-pin core analysis is not fully confirmed [Citation5,Citation6]. Especially, in BWR, there is a significant variation of energetic and spatial distribution in neutron spectrum in a fuel assembly since BWR fuel assemblies have complicated geometries (e.g. a large water rod/channel, a large enrichment splitting, and a control blade). Therefore, it is necessary to establish an appropriate energy group structure for the BWR pin-by-pin fine mesh core calculation.
In recent studies, various theoretical and numerical approaches to determine an appropriate energy group structure have been investigated. For example, a multi-group cross section collapsing code YGROUP has been developed as a theoretical approach [Citation9]. In this code, the “contribution” theory is used to directly construct an optimum coarse energy group structure. In the contribution theory, the forward and adjoint fluxes in fine energy groups are used to estimate contributions from fine groups (i.e. the importance of the fine groups) and then the coarse energy group boundaries are chosen so as the summation of the fine group contributions in each coarse energy group are approximately same [Citation10]. In addition, for an example of the numerical approaches, an adaptive energy mesh constructor has been developed for a lattice physics analysis [Citation11]. In this work, in order to construct an optimum coarse energy group structure, the particle swarm optimization is applied to estimate the performances of several coarse energy group structures. The neutron flux is approximately estimated during the optimization process.
In the present paper, we propose a numerical approach, which is based on the steepest descent method to establish an appropriate energy group structure for the BWR pin-by-pin fine mesh core calculation. The present approach has three main features, which are different from the previous works:
| 1. | The target energy group structure is constructed through a successive calculation (i.e. a successive collapsing or expanding of cross sections). Here, the successive collapsing or expanding means that the number of energy groups is reduced or increased one by one, respectively. | ||||
| 2. | The difference of the k-infinity or the pin-by-pin fission rate distribution due to energy collapsing is directly used as an optimization index since the k-infinity and the pin-by-pin fission rate distribution are important to evaluate important core parameters (e.g. core reactivity and power peaking factor). | ||||
| 3. | The appropriate energy group structures for various numbers of energy groups are suggested by the present approach. | ||||
The present study focuses on the development of an optimization algorithm to establish an appropriate coarser energy group structure. Therefore, a sensitivity analysis and a verification calculation are carried out in simple configurations instead of actual full core configurations. In this context, the applicability of the coarse energy group structure is not fully verified for actual cores. In practical application, the coarse energy group structure will be established by the present approach by considering fuel types that are loaded in the target cores.
The remainder of the present paper is organized as follows. In Section 2, some theoretical descriptions related to the present study (i.e. the cause of energy collapsing error and the calculation procedure of the proposed methodology) are described. In the present study, we use 2 × 2 multi-assembly geometries, in which different types of fuel assemblies (e.g. UO2 and MOX fuel assemblies) are adjacently loaded, to establish an appropriate energy group structure and to verify the applicability of the present approach. In Section 3, we compare and discuss the calculation results obtained by the present approach with various calculation conditions (e.g. difference of the calculation procedure (collapsing or expanding)). In Section 4, appropriate energy group structures are established by the present approach considering various 2 × 2 multi-assembly geometries. Performance of the established energy group structures are confirmed under various lattice conditions. Finally, conclusions and remarks are shown in Section 5.
2. Methodology
2.1. Energy collapsing error
There are two major reasons for the energy collapsing error of the cross sections. These are briefly reviewed in this subsection.
2.1.1. Preservation of reaction rates in a single assembly geometry
Multi-group cross sections used in a core calculation are obtained by collapsing fine group cross sections through a lattice physics calculation in single assembly geometry as follows:
Therefore, reaction rates obtained by a coarse group calculation do not exactly reproduce reference (fine) reaction rates obtained by a fine group calculation as follows:
In Equations (2) and (3), neutron fluxes obtained in a coarse group and a fine group calculations are normalized (e.g. the system total absorption reaction rates are equal to unity).
In order to mitigate the error of reaction rates due to the energy collapsing, the superhomogenization (SPH) method is utilized in the present study [Citation12]. By using the SPH method, reaction rates obtained by a coarse group calculation can be consistent with those obtained by a fine group calculation in a single assembly geometry as follows:
In Equation (4), μ is the SPH factor and is calculated by
2.1.2. Spectral interference effect on a multi-assembly geometry
Reaction rates are preserved by using the SPH method in a single assembly geometry as described in the previous subsection. However, in a multi-assembly or a core geometry, the spectral interference effect among fuel assemblies should be taken into account since different types of fuel assemblies (e.g. UO2 and MOX fuel assemblies) are adjacently loaded. Due to the spectral interference effect, the neutron spectrum in a multi-assembly or a core geometry is different from that in a single assembly geometry.
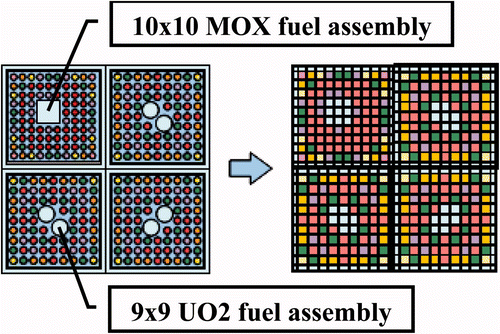
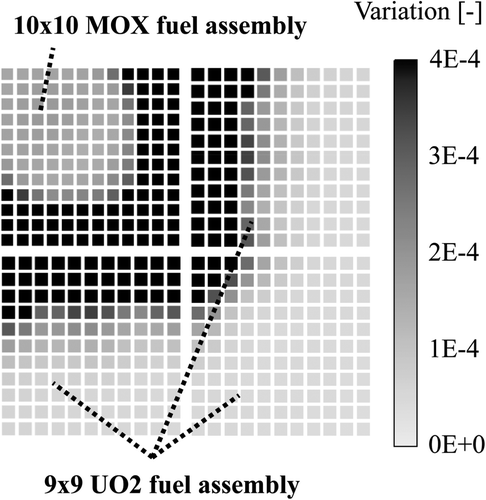
For example, as shown in , let us assume the 2 × 2 multi-assembly geometry, which consists of UO2 (9 × 9 with two large water rods) and MOX (10 × 10 with a large water channel) fuel assemblies, with the perfect reflective condition. The variation of the neutron spectrum between the single assembly and the 2 × 2 multi-assembly geometries is calculated by
Figure 1. Geometry of 2 × 2 multi-assembly.
and is qualitatively shown in . In Equation (6), Δ is an index to represent the variation of neutron spectrum. The subscripts of i and g represent the mesh and the energy group indexes, respectively. The superscripts single and multi represent the results obtained by the single assembly and the 2 × 2 multi-assembly calculations, respectively. w is the neutron flux, which is normalized in each mesh, and is defined by
Figure 2. Variation of neutron spectrum due to spectral interference effect.
The single assembly and the 2 × 2 multi-assembly calculations are performed in 40 energy groups.
As shown in , the variation of the neutron spectrum is mainly observed in the assembly peripheral regions. Such spectral interference effect is one of the main reasons for the energy collapsing error of the cross sections and it should be considered to establish an appropriate energy group structure.
The insertion of the control blade significantly affects the neutron spectrum in the core geometry. In order to appropriately consider the insertion of the control blade, larger geometries (e.g. 4 × 4 multi-assembly geometries) may be necessary. However, in the present paper, we focus on the spectral interference effect among fuel assemblies. When the control blade is inserted, neutrons are absorbed by the control blade that is located among fuel assemblies. Thus, the spectrum interference effect becomes smaller when the control blade is inserted. Due to the above reason, the insertion of the control blade is not considered in the present study and the 2 × 2 multi-assembly geometry is used.
2.2. Calculation procedure
2.2.1. Overview of the present approach
The energy collapsing error can be eliminated in a single assembly geometry by using the SPH method that can preserve reaction rates in each region. However, the spectrum interference effect in a multi-assembly geometry cannot be taken into account by using the SPH method since the SPH factor shown in Equation (5) is usually calculated in a lattice calculation assuming a single assembly geometry. Therefore, in order to establish an appropriate energy group structure, the variation of the coarse group cross sections due to the spectrum interference effect in a multi-assembly geometry should be taken into account.
The present study has the following three features. First, both of the calculation results, which are obtained before and after energy collapsing conditions, are considered to exactly capture the variation of the reaction rates. Namely, not only finer group calculations but also coarser group calculations are carried out to directly estimate the variation of the reaction rates. Second, the difference of the k-infinity or the pin-by-pin fission rate distribution due to the energy collapsing is directly used as an index to construct an appropriate energy group structure. Finally, the energy group structures for various number of energy groups are provided through the calculations based on the present approach.
In the present paper, we propose two different methods to establish an appropriate energy group structure. The first one is the successive decreasing of the number of energy groups from fine to coarse (i.e. the successive “collapsing” of cross sections). Let us assume the number of energy groups at the current calculation step is N. In the successive collapsing method, the differences of the k-infinity or the pin-by-pin fission rate distribution in a multi-assembly geometry between an (N − 1)-group calculation and a reference (fine) group calculation are compared to establish an appropriate (N − 1)-group structure. Another is the successive increasing of the number of energy groups from coarse to fine (i.e. the successive “expanding” of cross sections). In the successive expanding method, the differences of the k-infinity or the pin-by-pin fission rate distribution between an (N + 1)-group calculation and a reference (fine) group calculation are compared to establish an appropriate (N + 1)-group structure. The details of these methods are described in the following subsections.
The present approach may provide different energy group structures from the conventional ones. Such results might suggest a potential drawback of the conventional energy group structures for the BWR pin-by-pin fine mesh core analysis. Therefore, no additional constraint, which forces to adjust the energy boundaries to the conventional ones, is taken into account.
2.2.2. Successive collapsing method
First, we describe the detail of the successive collapsing method. In the successive collapsing method, the number of energy groups is decreased one by one from the reference (fine) group to the coarse group by removing an energy group boundary and the cross sections are collapsed into fewer energy groups. In the present study, starting from 40 groups, the number of energy groups are reduced to 39, 38, 37, …, 4, 3, and 2 groups. Consequently, all energy group structures from 40 to 2 energy groups are obtained through the above procedure. The concept of the successive collapsing method as described above is shown in .
Figure 3. Concept of successive collapsing method.
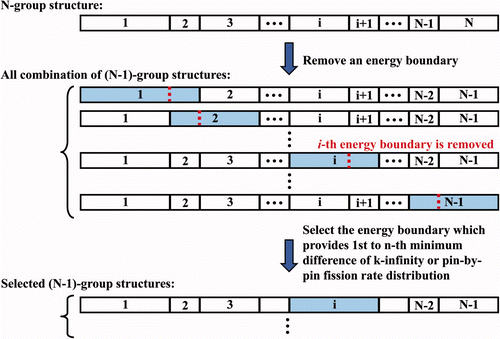
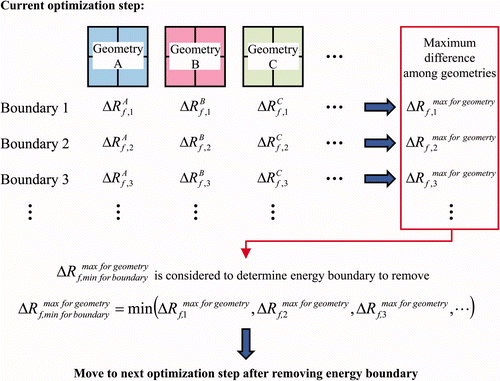
For example, let us assume that we have an N-group structure and we are going to collapse it into an (N − 1)-group structure. In this case, there are N − 1 possible candidates of (N − 1)-group structure since there are N − 1 energy group boundaries in an N-group structure. In other words, we can generate an (N − 1)-group structure by removing one of the N − 1 energy boundaries. Once we have an (N − 1)-group structure, the SPH method is utilized for the (N − 1)-group cross sections to preserve the reaction rates in the 40-group calculation. The spectrum calculation, collapsing of cross sections from 40 to N − 1 groups, and the application of the SPH method are carried out in the single assembly geometry. Then, (N − 1)-group multi-assembly calculations are carried out N − 1 times using the candidates of (N − 1)-group structure and (N − 1)-group cross sections, which are obtained in the single assembly calculation. The differences of the k-infinity and the pin-by-pin fission rate distribution between the (N − 1)-group calculation and the 40-group calculation in the 2 × 2 multi-assembly are estimated for each (N − 1)-group structure. Finally, the energy group boundary, which provides the minimum difference of the k-infinity or the pin-by-pin fission rate distribution in the above comparison, is removed to obtain an appropriate (N − 1)-group structure. In the above procedure, either the difference of the k-infinity or that of the pin-by-pin fission rate distribution is used as the index to choose a removed energy boundary. The above procedure is repeated until the number of energy group reaches to the target value.
However, we may obtain a local minimum solution for energy group structure in the above optimization method since we only consider the minimum difference of the k-infinity or the pin-by-pin fission rate distribution, which is equivalent to the steepest descent search. It is well-known that the steepest descent search may be trapped in local optimum for multi-modal problems. Therefore, in the present study, we consider not only the minimum difference of the k-infinity or the pin-by-pin fission rate distribution but also the n smallest differences (i.e. the n best candidate energy group structures) in each successive collapsing step. For example, when the value of the candidate number n is 5, 5 candidate energy group structures are retained for the next collapsing step.
2.2.3. Successive expanding method
Next, we describe the detail of the successive expanding method. In the successive expanding method, we estimate all possible two group structures at first and establish the best two group structure from the 40-group structure. After that, the number of energy groups is increased one by one and the cross sections are expanded from coarse to fine energy groups (i.e. the successive expanding method is a backward method of the successive collapsing method). The calculation procedure is almost identical with the successive collapsing method, except for the energy group boundary is added instead of removing it. The concept of the successive expanding method as described above is shown in .
Figure 4. Concept of successive expanding method.
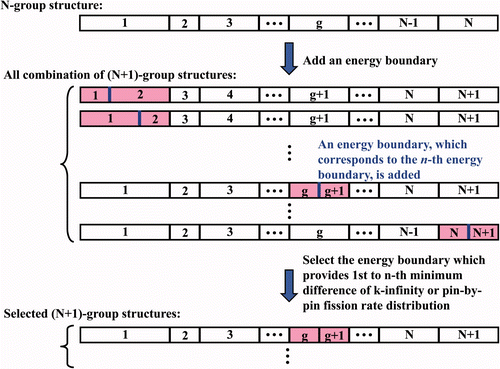
Note that the added energy group boundary is taken from the original 40-group structure and is determined to provide the minimum difference of the k-infinity or the pin-by-pin fission rate distribution from the 40-group calculation in 2 × 2 multi-assembly. For example, let us consider to add an energy group boundary to an N-group structure. We have 40 − N choices for adding energy boundary. Among these choices, an energy group boundary, which provides the minimum difference of the k-infinity or the pin-by-pin fission rate distribution between the (N + 1)-group calculation and the 40-group calculation in 2 × 2 multi-assembly, is finally selected. Moreover, we also consider not only the minimum difference of the k-infinity or the pin-by-pin fission rate distribution but also the n smallest differences in each successive expanding step as in the successive collapsing method.
3. Preliminary sensitivity analysis
In this section, we independently investigate the various calculation conditions – the optimization index (the k-infinity or the pin-by-pin fission rate distribution), the successive procedure (collapsing or expanding), and the number of candidates during collapsing or expanding. At first, we compare the calculation results obtained with the various calculation conditions. After that, we discuss on the calculation conditions to establish an appropriate energy group structure by applying the present approach.
3.1. Calculation conditions
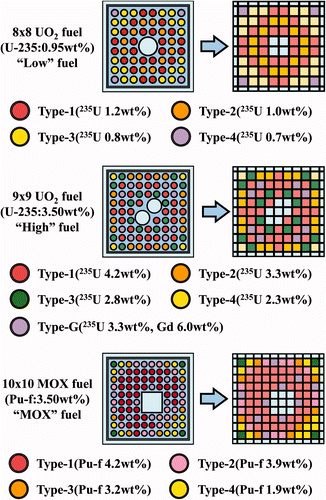
In this section, we use the three types of the 2 × 2 multi-assembly geometries shown in , which consist of the three types of typical BWR fuel assemblies shown in , to take into account the spectral interference effect among fuel assemblies. The geometrical configurations of these BWR fuel assemblies are given by [Citation13,Citation14], and the fuel rod enrichment distributions are manually decided.
Figure 5. Geometries of three types of 2 × 2 multi-assembly.
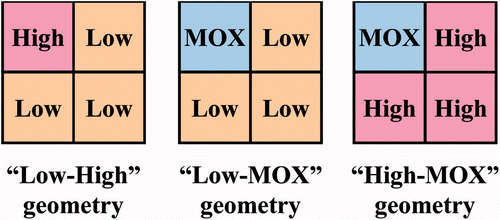
Figure 6. Geometries of three types of typical BWR fuel assemblies.
The pin-cell averaged cross sections used in the present study are calculated in 40 energy groups, in which the up-scattering is considered up to 4eV. The 40 energy group structure is established by adding one energy group into the 39 energy group shown in [Citation15]. The 40 energy group structure well reproduces the results of the finer energy group calculations (e.g. the 70 energy group calculation on the CASMO-4 code). In order to mitigate the error of the reaction rates due to the energy collapsing, the SPH method is utilized in a single assembly geometry [Citation12]. We also utilize the SPH method to generate the 40-group pin-by-pin homogenized cross sections in order to reproduce the reference (fine) heterogeneous results. Therefore, the calculation results with the 40 energy groups are comparable to the reference results.
The assembly averaged void fraction is 40% since it is the averaged value of the axial void fraction in typical BWR cores. In the present study, we do not take into account the void fraction distribution within the channel box in the fuel assembly, thus we assume that the void distribution inside a fuel assembly is uniform. The exposure of the fuel assembly is 0GWd/t in order not to consider the reduction of the spectral interference effect by the burn-up feedback effect.
The single assembly and the 2 × 2 multi-assembly calculations are performed by the SUBARU code, which is a pin-by-pin core analysis code for BWR under development and utilizes the semi-analytic nodal method with the simplified P3 (SP3) theory [Citation16].
In order to remove or to add energy group boundaries, the differences of the k-infinity and the pin-by-pin fission rate distribution in the 2 × 2 multi-assembly calculations are estimated since the k-infinity and the pin-by-pin fission rate distribution are important to evaluate important core parameters (e.g. core reactivity and power peaking factor). Since we focus on the pin-by-pin core calculation method in which the depletion and the feedback calculations are carried out in each pin, the pin-by-pin fission rate distribution is considered to be rather important than the local peaking factor itself. The root-mean-square (RMS) difference of the pin-by-pin fission rate distribution and the difference of k-infinity are calculated by
In Equations (8) and (9), ΔR f,RMS, R f.i , N fuel mesh , and Δk inf are the RMS difference of the pin-by-pin fission rate distribution, the fission rate on the fuel mesh i, the total number of the fuel mesh, and the difference of the k-infinity, respectively. The superscripts N-group and 40-group represent the results obtained by the N-group and the 40-group calculations, respectively.
3.2. Comparisons of results and discussions
3.2.1. Optimization indexes and optimization methods used to determine energy group structures
First, we compare the results obtained by the two optimization indexes used in the present approach (i.e. the differences of the k-infinity and the pin-by-pin fission rate distribution) and discuss the efficiencies of the two optimization indexes for the choice of the removed or added energy group boundary. For the above comparison, we carried out four types of calculations, which are the successive collapsing while minimizing the difference of the k-infinity or the pin-by-pin fission rate distribution and the successive expanding while minimizing the difference of the k-infinity or the pin-by-pin fission rate distribution, and these calculations are performed in the Low-High, the Low-MOX, and the High-MOX (2 × 2 multi-assembly) geometries shown in .
shows the absolute difference of the k-infinity and the RMS difference of the pin-by-pin fission rate distribution from the reference (40-group) results for the four types of calculations in the Low-High geometry. Similarly, and show the absolute difference of the k-infinity and the RMS difference of the pin-by-pin fission rate distribution from the reference (40-group) results for the four types of calculations in the Low-MOX and the High-MOX geometries, respectively.
Figure 7. Difference of k-infinity and pin-by-pin fission rate distribution in Low-High geometry using the energy group structures obtained by various calculation methods.
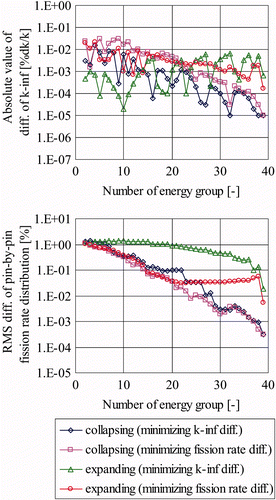
Figure 8. Difference of k-infinity and pin-by-pin fission rate distribution in Low-MOX geometry using the energy group structures obtained by various calculation methods.
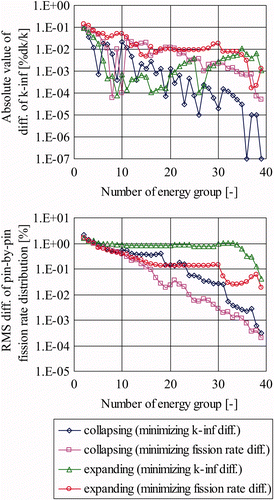
Figure 9. Difference of k-infinity and pin-by-pin fission rate distribution in High-MOX geometry using the energy group structures obtained by various calculation methods.
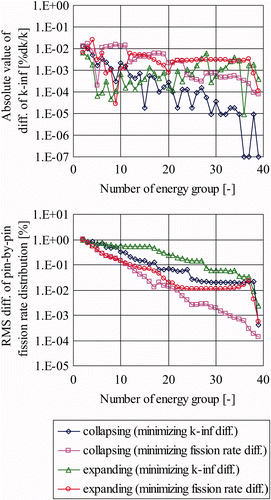
From to 9, the differences of the k-infinity become smaller when they are minimized, which is reasonable. When the number of energy groups is larger than 10, the differences of the k-infinity are sufficiently smaller than about 0.01%dk/k regardless of the methods and the optimization indexes used in the procedure. The differences of the pin-by-pin fission rate distribution become smaller when they are minimized, which is, again, reasonable. The differences of the pin-by-pin fission rate distribution gradually become larger as the number of energy groups becomes smaller.
Let us consider about the efficiency of the optimization indexes. From to 9, the differences of the k-infinity do not show large dependence on the optimization indexes from the practical point of view (e.g. they are smaller than 0.1%dk/k in any group calculations). On the other hand, the differences of the pin-by-pin fission rate significantly depend on the optimization indexes from the practical point of view (e.g. there are about from 0.2 to 0.5% in 10-group calculations).
Therefore, the above results suggest that the present approach using the difference of the pin-by-pin fission rate distribution as the optimization index is useful to establish an appropriate energy group structure from the practical point of view.
The difference of the pin-by-pin fission rate distribution obtained by the successive expanding method is much larger than that obtained by the successive collapsing method when the number of energy groups is larger than 10. When the number of energy groups is smaller than 10, these methods provide similar results, which is practically same. Consequently, the successive collapsing method (minimizing the difference of the pin-by-pin fission rate distribution) shows better performance than the successive expanding method (minimizing the difference of the pin-by-pin fission rate distribution).
3.2.2. Comparison of energy group structure
Second, we compare the energy group structures obtained by the two approaches (i.e. the successive collapsing and expanding methods shown in Section 2). The variation of the energy group structures during successive collapsing is shown in , in which only the minimum difference of the pin-by-pin fission rate distribution is considered as the optimization index in the Low-High geometry. shows similar results obtained by the successive expanding method. – show the variations of the energy group structures with the successive collapsing and expanding methods in the Low-MOX and the High-MOX geometries, respectively. In –, the 2, 5, 10, 15, 20, 25, 30, 35, and 40-group structures are shown and the arrows indicate that the corresponding energy group boundary is removed or added.
Figure 10. Energy group structure obtained by the successive collapsing method in Low-High geometry.
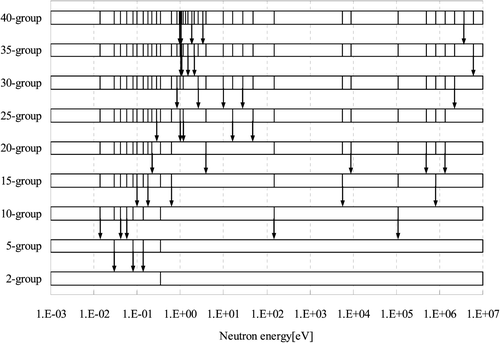
Figure 11. Energy group structure obtained by the successive expanding method in Low-High geometry.

Figure 12. Energy group structure obtained by the successive collapsing method in Low-MOX geometry.
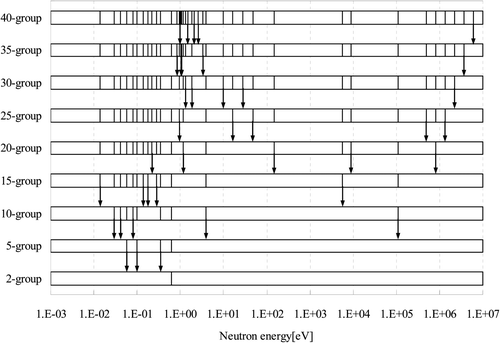
Figure 13. Energy group structure obtained by the successive expanding method in Low-MOX geometry.
Figure 14. Energy group structure obtained by the successive collapsing method in High-MOX geometry.
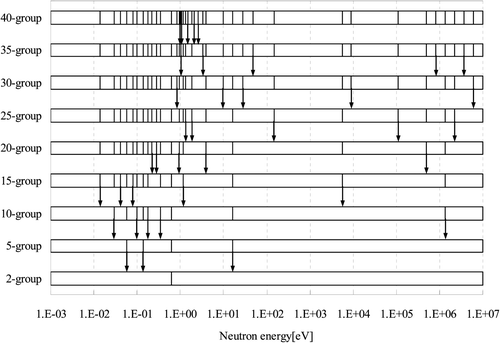
Figure 15. Energy group structure obtained by the successive expanding method in High-MOX geometry.
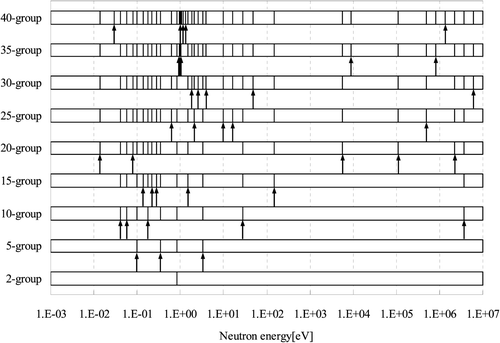
From , 12, and 14, the energy groups around 1eV, which have narrow energy widths to consider a resonance of Pu-240, are collapsed at the beginning stage of the process and those at the lower energy less than 1eV are collapsed in the latter stage of the process. From , 13, and 15, the energy boundaries at the lower energy less than 1eV are expanded in the beginning stage of the process and those around 1eV are ***expanded in the latter stage of the process. Moreover, the 10, 15, 20, and 25-group structures in – have similar energy group boundaries though their derivation processes are different.
The 2-group structures shown in , 13, and 15 (i.e. obtained by the successive expanding method) give the optimum 2-group structures for each geometries. The 2-group structures are also obtained by the successive collapsing method. With the successive collapsing method, the obtained 2-group results would not be the optimum results due to the limitation of the optimization method. However, the 2-group structures obtained by the successive collapsing method (, 12, and 14) are similar to the optimum structures, which suggests the validity of the successive collapsing method. This observation is supported by the results that the 2-group calculation results shown in – do not have significant differences.
3.2.3. Number of candidates considered in successive procedures
Finally, we compare the results obtained by the different number of candidates considered in the present approach. In the previous comparisons, the best energy group structure, which minimizes the difference of the k-infinity or the pin-by-pin fission rate distribution, is chosen during the calculation process. In other words, the steepest descent or the greedy strategy is adopted. In this comparison, we discuss effectiveness of the greedy strategy.
Instead of taking the best candidate in each choice, n best candidate structures, which give the n smallest differences of the k-infinity or the pin-by-pin fission rate distribution, are chosen in each calculation step. In the present paper, the value of n is 1, 5, or 10. When the value of n is set to be 5, 25 candidate structures (5 candidates for the present calculation step, 5 candidates for the next calculation step) are evaluated. Calculation results are shown in – . indicates the results obtained by the successive collapsing and expanding methods in the Low-High geometry. Similarly, and indicate the results obtained by the successive collapsing and expanding methods in the Low-MOX and the High-MOX geometries, respectively. In both of the successive collapsing and expanding methods, the difference of the pin-by-pin fission rate distribution is used as the optimization index.
Figure 16. Difference of k-infinity and pin-by-pin fission rate distribution in Low-High geometry using the energy group structures obtained with various numbers of candidates.
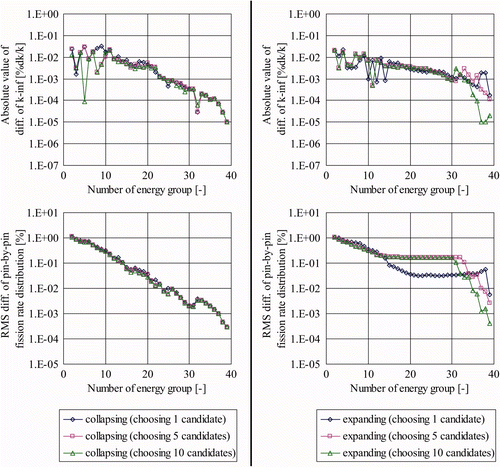
Figure 17. Difference of k-infinity and pin-by-pin fission rate distribution in Low-MOX geometry using the energy group structures obtained with various numbers of candidates.
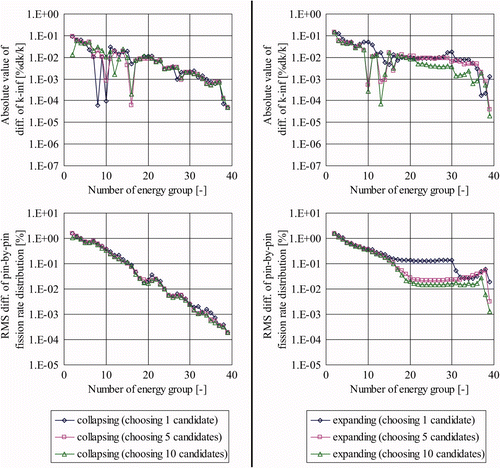
Figure 18. Difference of k-infinity and pin-by-pin fission rate distribution in High-MOX geometry using the energy group structures obtained with various numbers of candidates.
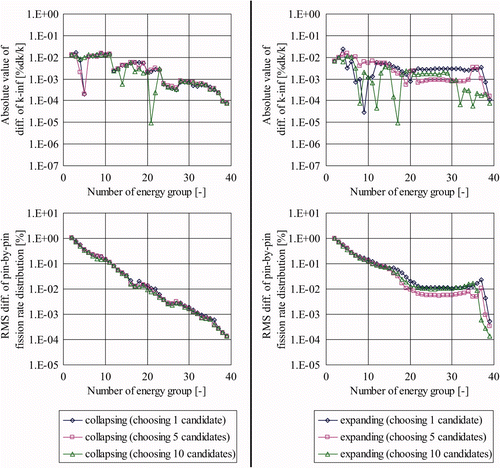
– show that the results are fairly insensitive to the number of candidates when the number of energy groups is approximately less than 15. Namely, the greedy strategy typically works well in the present optimization for energy group structures.
Therefore, the above results suggest that the greedy strategy, in which only the best candidate giving the minimum difference of the pin-by-pin fission rate distribution is chosen, is effective in both of the successive collapsing and expanding methods.
4. Evaluation of energy group structures
In the previous section, we compare the calculation results and the energy group structures obtained with the various calculation conditions – the optimization procedure (collapsing or expanding), the optimization index (the k-infinity or the pin-by-pin fission rate distribution), and the number of candidates during the optimization procedure. The results suggest that the successive collapsing method is efficient to construct an appropriate energy group structure. The greedy (steepest descent) strategy, which minimizes the difference of the pin-by-pin fission rate distribution, is efficient to establish an appropriate energy group structure.
Although a unified energy group structure is necessary for core calculations, the obtained energy group structures in the previous section depend on calculation configurations. Therefore, in this section, we simultaneously apply the present approach in various 2 × 2 multi-assembly geometries to determine a unified energy group structure, which is independent of calculation configurations. Then, we compare the results of the reference (40-group) and the coarse group calculations using the determined energy group structures to verify the usefulness of the present approach.
4.1. Construction of an appropriate energy group structure
4.1.1. Calculation conditions
We also use the three types of the 2 × 2 multi-assembly geometries as shown in , which consist of the three types of typical BWR fuel assemblies shown in [Citation13,Citation14]. The pin-cell averaged cross sections and the 40 energy group structure, which is the reference (fine) energy group structure, are the same as those described in the Subsection 3.1. The assembly averaged void fraction and the exposure of fuel assemblies are chosen from the combination of 0, 40, or 80% and 0, 10, 20, 30, 40, 50, or 60GWd/t. The assembly averaged void fraction and the exposure of fuel assemblies for the four fuel assemblies, which construct the 2 × 2 multi-assembly geometry, are the same. Namely, we use 63 calculation geometries (three types of the 2 × 2 multi-assembly geometries, three different patterns for the assembly averaged void fraction, seven different patterns for the exposure of fuel assemblies). The radial void distribution inside a fuel assembly is assumed to be uniform. The single assembly and the 2 × 2 multi-assembly calculations are performed by the SUBARU code [Citation16]. In order to remove energy group boundaries, the RMS difference of the pin-by-pin fission rate distribution in the 2 × 2 multi-assembly geometry, which is evaluated by Equation (8), is used as the optimization index since the difference of the pin-by-pin fission rate distribution is more efficient than that of the k-infinity as discussed in Section 3.
4.1.2. Energy group structures and their calculation accuracies
In order to establish an appropriate unified energy group structure, we simultaneously consider the 63 types of the 2 × 2 multi-assembly geometries during the optimization of energy group structures to take into account the typical situations of the fuel loading in BWR cores. More specifically, we obtain the 63 RMS differences of the pin-by-pin fission rate distribution for each energy group boundary at first. Then, the maximum RMS difference of the pin-by-pin fission rate distribution among the 63 RMS differences is chosen as the optimization index. Finally, the energy group boundary, which minimizes the maximum RMS difference among the 63 RMS differences, is removed. The concept of above calculation procedure is shown in .
Figure 19. Concept of simultaneous application of the present approach for various configurations.
The variation of energy group structures during successive collapsing is shown in , in which 2, 5, 10, 15, 20, 25, 30, 35, and 40-group structures are shown. shows the absolute difference of the k-infinity and the RMS difference of the pin-by-pin fission rate distribution from the reference (40-group) results.
Figure 21. Difference of k-infinity and pin-by-pin fission rate distribution in multi-assemblies geometry using the energy group structures obtained by the successive collapsing method (simultaneously applied in 63 configurations).
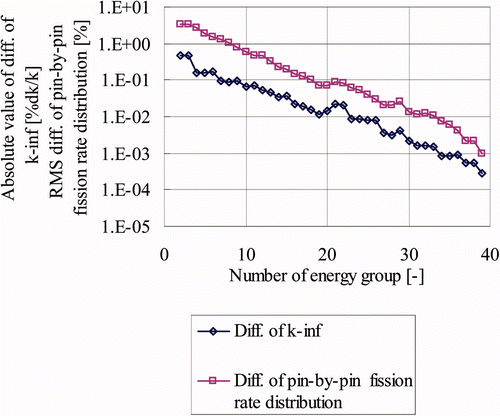
From , the energy groups around 1eV, which have narrow energy widths, are removed in the beginning stage of the process and those on the lower energy less than 1eV are removed in the latter stage of the process. These tendencies are similar to , 12, and 14, in which the successive collapsing method is applied in the Low-High, the Low-MOX, and the High-MOX geometries. When the successive collapsing method is applied, the differences of the k-infinity and the pin-by-pin fission rate distribution typically decrease as the number of energy groups increases as shown in .
The RMS difference of the pin-by-pin fission rate distribution and the absolute difference of k-infinity, which are obtained in the evaluation process of the successive collapsing method, are summarized in . In , the maximum and average values of the differences of the pin-by-pin fission rate distribution and the k-infinity among the 63 differences are shown. In the verification of the energy group structures shown in the next subsection, we carry out various 2 × 2 multi-assembly calculations and calculation accuracies are statistically estimated. Therefore, the values shown in are considered as the baseline and are used as the quantitative indexes to evaluate the adequacy of the energy group structures.
Table 1. Differences of k-infinity and pin-by-pin fission rate distribution for various energy group structures obtained in the process of the successive collapsing method.
4.2. Verification in various 2 × 2 multi-assembly geometries
In the previous subsection, the energy group structures for the various numbers of energy groups are established by the successive collapsing method, in which the 2 × 2 multi-assembly geometries with the various fuel types, the assembly averaged void fraction, and the exposure of fuel assemblies are simultaneously taken into account.
In this subsection, we verify the validity of the energy group structures that are obtained by the successive collapsing method. Extensive 2 × 2 multi-assembly calculations with various conditions are carried out with the established energy group structures and the calculation results are compared with those of the reference (40-group) calculations.
4.2.1. Calculation conditions
We carry out various 2 × 2 multi-assembly calculations, which consist of the three types of typical BWR fuel assemblies shown in [Citation13,Citation14]. The fuel assemblies in the 2 × 2 multi-assembly geometry are selected to consider all possible combinations of the four fuel assemblies, in which the Low-High, the Low-MOX, and the High-MOX geometries shown in are also included. The pin-cell averaged cross sections and the 40 energy group structure, which is the reference (fine) energy group structure, are the same as those described in Subsection 3.1. The numbers of the coarse energy group structures are 2, 5, 8, and 15 and their energy group structures are shown in . These energy group boundaries in are obtained in the previous subsection.
Table 2. Energy group structures determined by the successive collapsing method.
The assembly averaged void fraction is chosen from 0, 40, or 80%. The radial void distribution inside a fuel assembly is assumed to be uniform. In order to assume typical BWR core conditions in the beginning of cycle, the exposure of fuel assemblies is chosen from 0, 15, or 30GWd/t. The void fractions and the exposure of the four fuel assemblies constructing the 2 × 2 multi-assembly geometry may be different. Namely, we also consider all possible combinations of the void fraction and the exposure in the 2 × 2 multi-assembly geometries.
The single assembly and the 2 × 2 multi-assembly calculations are performed by the SUBARU code [Citation16]. In order to verify the calculation accuracy of the coarse energy group structure, we compare the differences of the pin-by-pin fission rate distribution and the k-infinity between the reference (fine) group and the coarse group calculations. The differences of the pin-by-pin fission rate and the k-infinity are calculated by Equations (8) and (9), respectively. The calculation results with 40-group calculation are considered as the reference results.
4.2.2. Calculation results
summarizes the differences obtained by the 2 × 2 multi-assembly calculations considering all possible combinations of types of fuel assemblies, the void fraction, and the average exposure. In , the thick solid and dotted lines indicate the maximum and the average values of the differences obtained in the process of the successive collapsing method, which are shown in , respectively. The average and the maximum values of the differences in are summarized in .
Figure 20. Energy group structures obtained by the successive collapsing method (simultaneously applied in 63 configurations).
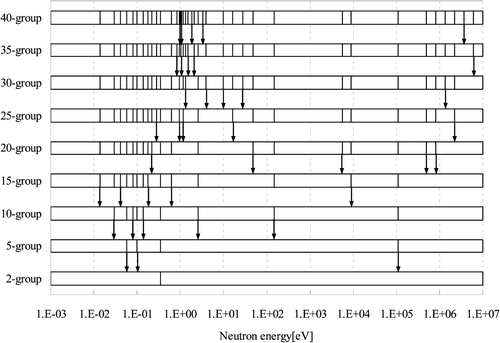
Figure 22. Differences of k-infinity and pin-by-pin fission rate obtained with the determined 2-, 5-, 8-, and 15-group energy structures.
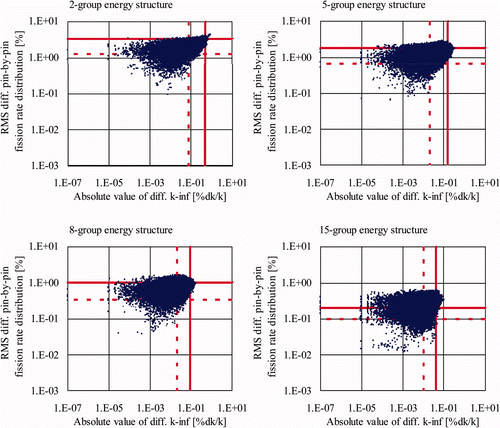
Table 3. Average values and maximum values of differences of k-infinity and pin-by-pin fission rate distribution in the verification calculation.
From , the RMS differences of the pin-by-pin fission rate distribution and the absolute differences of the k-infinity are generally smaller than the solid lines, which indicate the maximum differences shown in . The 2 × 2 multi-assembly geometries shown in is used in the evaluation of , which is performed in Subsection 4.1.2. The 2 × 2 multi-assembly geometries shown in have the significant spectral interference effect. On the other hand, since all possible combinations of fuel assemblies are considered in the present verification calculation, similar fuel assemblies would be loaded in the 2 × 2 multi-assembly geometries in this verification calculation. Therefore, the spectral interference effect is generally smaller than the previous calculation as shown in . Consequently, the differences of pin-by-pin fission rate and the k-infinity appeared in are generally smaller than the maximum differences as shown in .
In order to evaluate the adequacy of the determined energy group structures, we compare the calculation results obtained by the 8-group structure determined in the present study and the 8-group structure used in the previous study [Citation5,Citation6]. The 8-group structure used in the previous study is manually optimized. Note that the 8-group structure in the previous study is slightly modified in order to be consistent with the energy boundaries used in the present study. Both of the 8-group structures are shown in . The average and the maximum values of the differences, which are obtained by the 2 × 2 multi-assembly calculations considering all possible combinations of types of fuel assemblies, the void fraction, and the average exposure, are described in .
Table 4. 8-group structures determined in the present study and that used in the previous study.
From , most results obtained by the determined 8-group structure in the present study are better than those obtained by the 8-group structure used in the previous study. For the maximum value of the difference of the k-infinity, the result obtained by the determined 8-group structure is slightly worse than that obtained by the 8-group structure used in the previous study. However, the difference between them is about 0.04%dk/k and is very small from the practical point of view. Therefore, we conclude that the present approach (i.e. the successive collapsing method) is very efficient to establish an appropriate energy group structure for BWR pin-by-pin core analysis.
Table 5. Average values and maximum values of differences of k-infinity and pin-by-pin fission rate distribution in the 8-group calculations.
5. Conclusions and remarks
In the present paper, an optimization approach to establish an appropriate energy group structure for BWR pin-by-pin fine mesh core analysis is proposed and its performance is confirmed through the verification calculations with the use of various 2 × 2 multi-assembly geometries.
First, we investigate two different methods to establish an appropriate energy group structure (i.e. the successive collapsing and expanding methods). In the successive collapsing method, the number of energy groups is decreased one by one and cross sections are collapsed into coarser energy groups in this process. In the successive expanding method, the number of energy groups is increased one by one and cross sections are expanded into finer energy groups in this process. In these methods, energy group boundaries, which provide the n smallest differences of the k-infinity or the pin-by-pin fission rate distribution between the coarse group calculation and the reference (40-group) calculation in the 2 × 2 multi-assembly, are removed or added.
Second, the sensitivity analyses of the present approach are carried out focusing on the following points:
| 1. | Approach to establish energy group structure (collapsing or expanding), | ||||
| 2. | Optimization index (difference of k-infinity or pin-by-pin fission rate distribution), | ||||
| 3. | Number of candidates considered in the successive collapsing/expanding procedure. | ||||
From the sensitivity analyses, the following points are confirmed:
| 1. | The successive collapsing method can determine the optimum or quasi-optimum energy group structures, since the 2-group energy group structures and the 2-group calculation results obtained by the successive collapsing and expanding methods do not have significant differences even though the successive expanding method gives the optimum solution in the case of the 2-group problem. | ||||
| 2. | The successive collapsing method is superior to the successive expanding method to determine an appropriate energy group structure. | ||||
| 3. | The difference of the k-infinity from the reference (fine) group result gradually decreases as the number of energy groups becomes larger. | ||||
| 4. | The difference of the pin-by-pin fission rate distribution from the reference (fine) group result gradually decreases as the number of energy groups becomes larger and is more sensitive than that of the k-infinity. | ||||
| 5. | The greedy (steepest decent) strategy, in which the best candidate providing the minimum difference of the k-infinity or the pin-by-pin fission rate distribution is chosen, works well in both of the successive collapsing and expanding methods. | ||||
| 6. | The above tendencies are observed in all three types of the 2 × 2 multi-assembly geometries considered in the present study (i.e. the Low-High, the Low-MOX, and the High-MOX geometries shown in ). | ||||
From the above results of the sensitivity analyses, we decide the calculation conditions of the present approach as shown in follows:
| • | Successive collapsing method (optimization procedure), | ||||
| • | Pin-by-pin fission rate distribution (optimization index), | ||||
| • | Considering only the best candidate of the energy group structure (i.e. the greedy or steepest decent strategy) (the number of candidates considered in the successive procedure). | ||||
Finally, in order to verify the applicability of the present approach, we simultaneously apply the present approach in the various 2 × 2 multi-assembly geometries to establish unified coarse energy group structures that are suitable for BWR pin-by-pin core analysis. Then, the performance of the established coarse energy group structures is confirmed through the statistical analyses on the differences of the k-infinity and the pin-by-pin fission rate distribution in the various configurations, which simulate typical BWR core conditions in the beginning of cycle. The comparison of statistical analysis results with the coarse energy group structure, which is used in the previous study and is manually optimized, is also carried out.
The following points are confirmed through the verification calculations:
| 1. | The successive collapsing method can determine the appropriate energy group structures for the various numbers of energy groups when we simultaneously apply it in the various 2 × 2 multi-assembly geometries. | ||||
| 2. | Accuracy of the 8-group structure determined in present study is better than that obtained by the 8-group structure used in the previous study. | ||||
The present approach would be applicable to establish an appropriate multi-group energy structure from finer energy group (e.g. more than 100 groups), although the computational time and the required memory become larger as the number of energy groups becomes larger. For example, if the number of reference (fine) energy groups is 100, approximately 20 ∼ 30 times longer computational time will be necessary, compared to the calculation conditions described in the present paper.
References
- Rempe , K.R. and Smith , K.S. 1989 . SIMULATE-3 pin power reconstruction: methodology and benchmarking . Nucl. Sci. Eng , 103 : 334 – 342 .
- Iwamoto , T. and Yamamoto , M. 1999 . Pin power reconstruction methods of the few-group BWR core simulator NEREUS . J. Nucl. Sci. Technol , 36 : 1141 – 1152 .
- Bahadir , T. , Lindahl , S-Ö. and Palmtag , S. SIMULATE-4 multigroup nodal code with microscopic depletion model . Proc. Mathematics and Computation, (M&C 2005) . September 12–15 . [CD-ROM]
- Yamaji , K. , Matsumoto , H. and Nakano , M. Development of the new pin-by-pin core calculation method with embedded heterogeneous assembly calculation . Proc. Int. Conf. on Physics of Reactors (PHYSOR-2006) . September 10–14 . [CD-ROM]
- Tada , K. , Yamamoto , A. and Yamane , Y. 2008 . Applicability of the diffusion and simplified P3 theories for pin-by-pin geometry of BWR . J. Nucl. Sci. Technol , 45 : 997 – 1008 .
- Tada , K. , Yamamoto , A. and Yamane , Y. 2009 . Treatment of staggered mesh for BWR pin-by-pin core analysis . J. Nucl. Sci. Technol , 46 : 163 – 174 .
- Tatsumi , M. and Yamamoto , A. 2003 . Advanced PWR core calculation based on multi-group nodal-transport method in three-dimensional pin-by-pin geometry . J. Nucl. Sci. Technol , 40 : 376 – 387 .
- Hoareau , F. , Fiscounakis , M. and Couyras , D. A pin by pin microscopic depletion scheme using an homogeneous core calculation with pin-power reconstruction . Proc. 2009 Int. Congress on the Advances in Nuclear Power Plants (ICAPP ’09) . May 10–14 . [CD-ROM]
- Yi , C. , Sjoden , G. and Mattingly , J. Computationally optimized multi-group cross section data collapsing using the YGROUP code . Proc. Int. Conf. on the Physics of Reactors (PHYSOR 2010) . May 9–14 . [CD-ROM]
- Williams , M.L. 1991 . Generalized contribution response theory . Nucl. Sci. Eng , 108 : 355 – 383 .
- Mosca , P. , Mounier , C. and Sanchez , R. 2011 . An adaptive energy mesh constructor for multigroup library generation for transport codes . Nucl. Sci. Eng , 167 : 40 – 60 .
- Hébert , A. 1991 . A consistent technique for the pin-by-pin homogenization of a pressurized water reactor assembly . Nucl. Sci. Eng , 113 : 227 – 238 .
- Okuno , H. , Naito , Y. and Suyama , K. 2002 . OECD/NEA Burnup Credit Criticality Benchmarks Phase IIIB: Burnup Calculations of BWR Fuel Assemblies for Storage and Transport JAERI-Research 2002-001, Japan Atomic Energy Research Institute (JAERI)
- Yamamoto , A. , Ikehara , T. and Ito , T. 2002 . Benchmark problem suite for reactor physics study of LWR next generation fuels . J. Nucl. Sci. Technol , 39 : 900 – 912 .
- Tani , F. , Jatuff , F. and Chawla , R. 2006 . Study of spectral heterogeneities for the interpretation of calculational trends in predicting pin power distributions in a SVEA-96 + BWR assembly . Ann. Nucl. Energy , 33 : 490 – 498 .
- Tada , K. , Yamamoto , A. and Kosaka , S. Development of a prototype pin-by-pin fine mesh calculation code for BWR core analysis . Proc. Int. Conf. on Physics of Reactors (PHYSOR ’08) . September 14–19 . [CD-ROM]