Abstract
The energy resolved computed tomography (CT), which had advantage over conventional CT (twofold higher CT value for iodine contrast agent and being free from beam hardening effect), was shown practical by employing the transXend detector: it measured X-rays as electric current and gave energy distribution of incident X-rays after analysis. This article shows a new application of the transXend detector for estimating the thicknesses of acrylic, iodine, and aluminum in a phantom. For this purpose, the responses of the segment detectors in the transXend detector are changed intentionally with inserting filters. With previously obtained two-dimensional maps for acrylic–iodine and acrylic–aluminum thicknesses, which are shown by the ratios of electric currents measured by the segment detectors, the thickness of materials on the path of the X-rays are obtained by a transmission measurement.
1. Introduction
X-ray computed tomography (CT) is a powerful tool for finding tumors, including cancers. To observe cancers more clearly, contrast agent such as iodine is injected into a blood vessel. There are many more blood vessels in cancer tissue than in normal tissue; as a result, the iodine concentration is higher in cancer tissue than in normal tissue. This method of examination is called contrast-enhanced CT. The estimated iodine thickness in 1 cm thick cancer in the direction of X-ray transmission ranges from 1 to 60 μm [1,2].
Iodine has X-ray absorption K-edge at the energy of 33.2 keV. The X-rays with their energy higher than 33.2 keV are absorbed by iodine strongly. The numbers of X-rays passing through cancer tissue with iodine and through normal tissue differ much. As a result, the CT values of cancer tissue and normal tissue have different values.
Contrast-enhanced CT has two major problems: high dose exposure and side effects of the iodine contrast agent [3]. Another problem is a beam hardening effect: X-ray absorption by iodine is difficult to detect with high X-ray tube voltage and a large subject [4].
We have been working on solving these problems by measuring the energy of X-rays: conventional X-ray CT measures X-rays as electric current and does not use energy information of X-rays. The use of energy information of X-rays gives following advantages: (1) X-ray absorption by iodine is observed in the same way despite of the X-ray tube voltage and of the thickness of the subject (beam hardening effect free) [2]; (2) CT value of iodine is nearly twofold higher than the one obtained by current measurement CT [5]; (3) dose exposure is reduced to 1/2 to 1/3 when an X-ray filter, such as a lanthanum filter, is applied at the exit of X-ray tube [1].
Measuring energy of X-rays, however, takes long time due to the limitation of time duration of electric carriers to reach positive and negative electrodes in any type of X-ray detectors. On the other hand, CT measurements should be performed in a very short time, in the order of seconds. The X-ray detectors with high counting rate are under development intensively, such as Medipix-2: it can measure one million X-rays in a second; however, the energy of X-rays should be less than 30 keV, while the maximum energy of X-rays used in diagnosis ranges 80–150 keV [6].
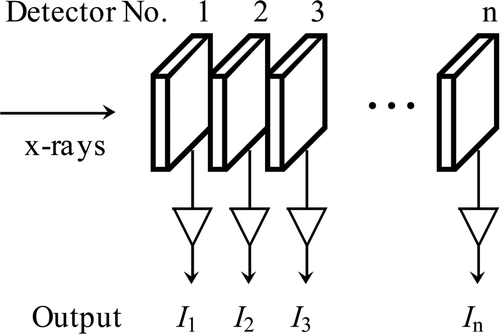
As an X-ray detector to give energy information for CT measurements, we invented a novel system, called the transXend detector, which measures X-rays as electric current and, after analysis, provides the energy distribution of X-rays [7]. The transXend detector consists of several segment detectors aligned along the direction of the X-ray incidence, as shown in . Each segment detector measures X-rays as electric current. Segment detectors in the forward absorb low energy X-rays, and some portion of high energy X-rays. The rearward segment detectors do not have low energy X-rays much, but have higher energy X-rays. According to the materials and the position of segment detectors, the responses of the segment detectors to X-rays change. With previously obtained response functions for segment detectors, the energy distribution of incident X-rays is obtained by unfolding a matrix equation. The substrate of segment detectors can be semiconductors, scintillators, and any other materials that have been employed for radiation detectors.
The response functions for segment detectors are desired not to be similar: otherwise, obtained X-ray energy distribution strongly depends on an initial guess in the unfolding process. To change response functions of segment detectors, scintillators with various atomic numbers and densities were employed. Comparing to the transXend detector with various scintillator segment detectors to the one with the same scintillator segment detectors, X-ray energy distribution which did not depend on the initial guess was obtained by various scintillator transXend detectors with even less amount of the product of X-ray tube current and time, i.e., mA s [8].
The energy resolved CT has advantages over conventional current measurement CT; however, it requires X-ray exposures through 360° around a subject, the same as in the conventional CT measurements: the conventional CT takes nearly 1000 transmission images in 360° rotation [9]. In this article, we propose a novel method for estimating thicknesses of known materials in a subject with one X-ray transmission measurement, with using two-dimensional maps made of the ratio of electric currents measured by the segment detectors of the transXend detector. The two-dimensional maps are equivalent to the response functions employed in the unfolding process in the analysis of transXend detector measurements.
2. Two-dimensional map using the outputs of the transXend detector
For the transXend detector with three segment detectors made of Si(Li), simulation study was performed. The thickness of Si(Li) detector was 1 mm. With the tube voltage 120 kV, X-rays were emitted through 2 mm thick aluminum filter and 20 cm thick air before entering a phantom, which consisted of acrylic (a substitute of soft tissue) layer and iodine layer (a substitute of cancer tissue marked with iodine) with various thicknesses. The X-ray energy spectrum was calculated according to [10].
The energy spectrum of X-rays before entering the first segment detector, Y 1(E), is described as
Here, Y 0(E) is the number of X-rays with energy E before entering into acrylic and iodine layers; μA(E)/ ρA, μI(E)/ ρI, ρA, ρI, t A, and t I are the mass attenuation coefficients, densities, and thicknesses of acrylic and iodine, respectively. The electric current measured by the first segment detector is written as
Here, μen(E)/ ρS, ρS, and t S are the mass–energy absorption coefficient, density, and thickness of detector substrate, i.e., silicon. The electric currents measured by the second and third segment detectors can be calculated in the same way but the incident number of X-rays is decreased by the absorption of forward segment detectors. With defining the currents measured by the first, second, and third segment detectors as I 1, I 2, and I 3, the current ratios I 2/I 1 and I 3/I 1 are calculated.
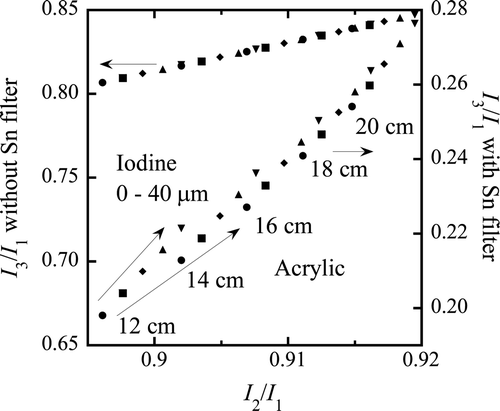
Similar calculations are carried out for the transXend detector with a 300 μm thick Sn filter in front of the third segment detector. Simulation results are shown in for the cases with and without the Sn filter. Without the Sn filter, the increments of acrylic and iodine thicknesses in the two-dimensional map would fall on the same line. The current ratios measured by the transXend detector with the Sn filter, however, showed different directions for acrylic and iodine increments. This two-dimensional map for acrylic–iodine thickness means that a simple X-ray transmission measurement is enough to give information regarding tissues marked with iodine contrast agent.
Figure 2. Calculated two-dimensional map of I 2/I 1–I 3/I 1 for the cases without and with a Sn filter. The X-ray tube voltage and Sn filter thickness are 120 kV and 300 μm, respectively. The acrylic thickness is indicated in this figure. The iodine thicknesses are 0 μm (dots), 10 μm (squares), 20 μm (diamonds), 30 μm (up triangles), and 40 μm (down triangles), respectively.
3. Experiments
3.1. Two materials' identification
Experimental setup is shown in . Employed transXend detector consists of three Si(Li) segment detectors. The dimensions of Si(Li) are 10 × 10 × 1 mm3. Bias voltage is not applied to Si(Li) detectors during operation: the mean free paths of electrons and holes in Si are greater than 1 mm [11]. The Si(Li) transXend detector was operated at room temperature.
Figure 3. Experimental setup. Acrylic slabs, an acrylic with iodine regions in it, and step phantom of aluminum are employed for two-dimensional map measurements. For the scanning measurements, cylindrical phantoms in Figure 5 are used.
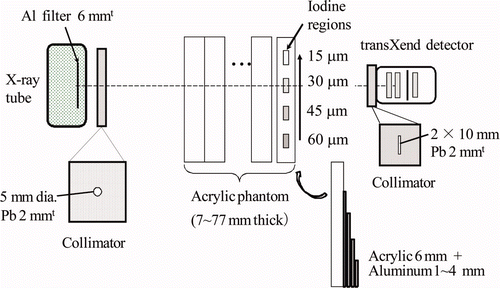
The transXend detector has two configurations: with and without a Sn filter (58 μm in thickness) in front of the third Si(Li) segment detector. The X-ray tube is TRIX-150S (Toreck Co. Ltd., Japan). The tube voltage and current are 120 kV and 2.4 mA, respectively. Collimators are placed at the exit of the X-ray tube and the entrance of the transXend detector.
The X-ray tube voltage, the thicknesses of acrylic phantom, and the Sn filter were chosen with considering the maximum current of the X-ray tube: for medical diagnosis, X-ray tubes with 200–300 mA of tube current are employed to inspect a human body with the thickness of nearly 20 cm. For current measurement of X-rays (a number of X-rays should come into an X-ray detector simultaneously) with using a low current X-ray tube, a phantom much thinner than the human body must be employed.
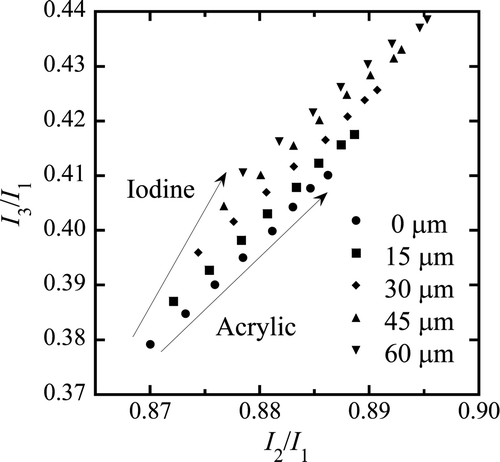
The X-rays after passing a phantom, which consists of acrylic slabs and an iodine region, are measured by three segment detectors, as electric currents, I 1, I 2, and I 3. The thickness of acrylic is changed from 7 to 77 mm with the interval of 10 mm. Also, four iodine regions are prepared in an acrylic slab. The iodine thicknesses are adjusted to be 15–60 μm with the interval of 15 μm by thinning iodine tincture with water. With taking the current ratios I 2/I 1 and I 3/I 1 as x- and y-axes, measured results by the transXend detector with the Sn filter are plotted as shown in . With inserting the Sn filter, the directions of acrylic and iodine increments change apart each other, and result in two-dimensional map, as predicted by the simulation study.
Figure 4. Two-dimensional map for acrylic and iodine thickness estimation. Acrylic phantom thickness ranges from 7 to 77 mm with 10 mm intervals. Iodine thickness is shown in this figure.
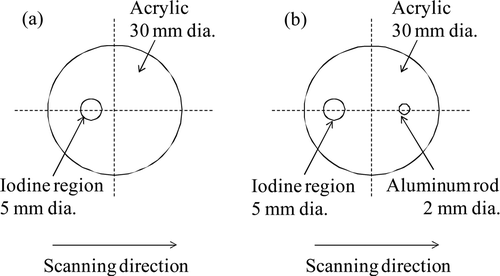
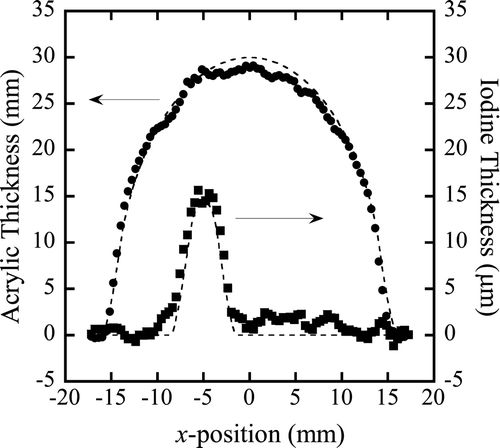
Because we have only one set of the transXend detector, we performed scanning measurements of a phantom. The phantom is a cylindrical acrylic with the diameter of 30 mm and has a 5 mm diameter hole for thinned iodine tincture 5 mm apart from the phantom center, as shown in (a). The thickness of iodine is 15 μm in 5 mm distance of X-ray transmission. The scanning step is 0.4 mm. Obtained current ratios are put into the two-dimensional map shown in and the acrylic and iodine thicknesses are estimated. The thickness distributions for acrylic and iodine are shown in .
3.2. Three materials' identification
For taking into account of bone in the human body, an aluminum rod is inserted in an acrylic phantom as a substitute for bone. The schematic drawing of the acrylic phantom is shown in (b). The diameter of the aluminum rod is 2 mm. The centers of the iodine region and the aluminum rod are 7.5 mm from the center of the phantom in the opposite directions. The thickness of iodine is the same as described in Section 3.1.
Employed transXend detector is the same one used in Section 3.1, but the fourth Si(Li) segment detector is added with Gd filter in front of it. The thickness of the Gd filter is 75 μm. In this measurement of estimating acrylic, iodine, and aluminum thicknesses, acrylic–iodine and acrylic–aluminum maps are necessary. For the acrylic–iodine map, the same procedure described in the previous section is repeated. For the acrylic–aluminum map, electric currents induced by X-rays after passing acrylic with the thickness of 6–66 mm with 10 mm interval and aluminum with the thickness of 1–4 mm with 1 mm interval are measured. Obtained two-dimensional maps are shown in (a) and 7(b) for acrylic–iodine and acrylic–aluminum, respectively. (a) is the same as , but drawn for small values of I 2/I 1 and I 3/I 1. In (b), I 3/I 1 and I 4/I 3 are employed for x- and y-axes: the current value of I 4 is very small comparing to I 1.
Figure 7. Two-dimensional maps for (a) acrylic–iodine and (b) acrylic–aluminum thickness distribution estimation. “Ref.” means the reference points a–f described in . “Air” means the measured points without acrylic phantom. Solid lines are the scanned results for the acrylic phantom shown in Figure 5(b).
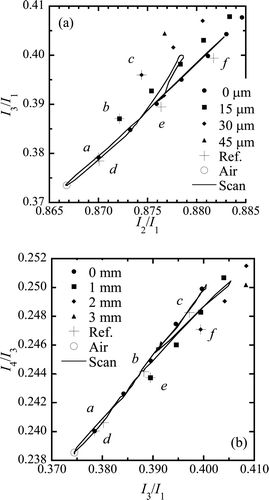
As with the same way, the acrylic phantom with iodine and aluminum is scanned with a step of 0.4 mm. Obtained current ratios of scanned results are plotted in (a) and 7(b) by solid lines. The results are analyzed in the same way as in the previous section.
4. Results and discussions
4.1. Thickness distributions of acrylic and iodine
In , the expected thickness distributions of acrylic and iodine are shown by dashed lines. Because the collimator in front of the transXend detector has 2 mm width, the theoretical thickness at the position x, tk (x), is the averaged ones from x − 1 mm to x + 1 mm. Here, k means the acrylic or iodine.
In the case of the thickness distribution of acrylic, the thicknesses close to x = ± 15 mm agree very nicely to the theoretical acrylic thickness. The thicknesses of acrylic close to the center slightly deviate from the theoretical ones.
The iodine thicknesses in the iodine region show excellent agreement with the theoretical ones. The iodine thicknesses at both ends of the iodine region, however, are overestimated to some extent. These overestimated iodine thicknesses result in the underestimation of corresponding acrylic thicknesses. The iodine thicknesses at positive x show positive values, although they should be zero. We suspect that this phenomenon is the result of energy spectrum change of X-rays during experiment: a simple change in X-ray tube current does not give any harm to the measurements, because the change of X-ray numbers emitted in the unit time is canceled using the current ratios, I 2/I 1 and I 3/I 1. The correction method for X-ray energy spectrum change is the theme of study for practical use of this method.
4.2. Thickness distributions of acrylic, iodine, and aluminum
4.2.1. Effect of hidden materials
In (a) and 7(b), two-dimensional maps for acrylic–iodine and acrylic–aluminum are plotted as well as the scanned traces by solid lines. Also, measurement results for reference points (see ) are plotted by pluses (+). In (a), points a, b, and c are on the symbols, and points d, e, and f are on the symbols in (b).
Table 1. Reference points for the correction of hidden materials in two-dimensional maps.
In (a), the scanned trace starts from the point at which there is air only and goes to point a (with 7 mm thick acrylic). After point a, the scan moves to the point with 17 mm thick acrylic and then goes slightly upward to the part with iodine (acrylic thickness between 17 and 27 mm). After passing the iodine region, the scan comes back on the line with no iodine and reaches to the center of acrylic phantom. Although the X-ray passing distance becomes shorter after leaving the center, the scanned points are in a region where the acrylic thickness is greater than 30 mm as seen at the points close to f, where the acrylic thickness is 47 mm. The scan results around here have the effect of X-ray absorption by aluminum but are observed as the results for acrylic because the two-dimensional map of (a) does not include the X-ray absorption by aluminum.
In (b), the scanned points pass d and go through the point close to b. The scan then moves to a point close to c and reaches the point where acrylic has 46 mm thickness, close to the point (0.400, 0.250). This is the effect of X-ray absorption by iodine. The scan comes back to the point between 26 and 36 mm acrylic thickness when the X-rays pass the center of the acrylic phantom. After leaving the center, X-rays are absorbed by aluminum. At this stage, the scanned data comes close to the square symbol (0.400, 0.248) and reaches a point close to (0.405, 0.250). After passing the center of the aluminum rod, the scan comes back to the part with acrylic only, then to the point with only air.
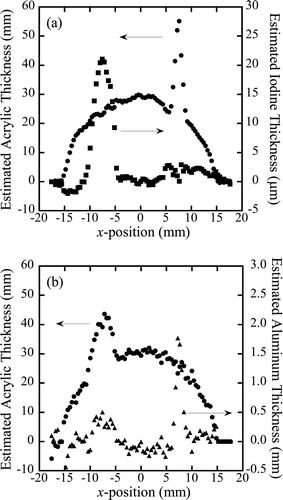
With neglecting the effects of hidden materials and taking the scanned data as the absorption of X-rays by acrylic and iodine in (a), and by acrylic and aluminum in (b), acrylic–iodine and acrylic–aluminum thickness distributions are obtained and shown in (a) and 8(b). In (a), the thickness of acrylic is overestimated at x = +7.5 mm, where the aluminum rod is in the phantom. In contrast, the iodine thickness distribution has a dip at the same position. The overestimation and underestimation described above are attributed to the aluminum rod, which is hidden in this figure but is seen in (a). The same phenomena are seen in (b): The acrylic and aluminum thicknesses are overestimated at x = −7.5 mm, where the iodine region is in the phantom.
4.2.2. Estimation of hidden materials
To estimate X-ray absorption by hidden materials (i.e., aluminum in (a) and iodine in (b)), the estimated acrylic, iodine, and aluminum thicknesses of reference points a–f shown in are plotted in (a) and 9(b). In (a), points a, b, and c are aligned vertically because the iodine thickness is measured in the vertical axis. At point d, the iodine thickness should be zero, but it had a slightly negative value due to the change of X-ray energy spectrum as described in Section 4.1. This X-ray tube is known to have instability of this magnitude. From point d to f, the aluminum thickness increases 2 mm. With fitting the points d to f by the least square method, the change in aluminum thickness is shown comparable to an acrylic thickness of 41 mm and an iodine thickness of −3.5 μm.
Figure 9. Schematics for estimating hidden materials: (a) aluminum in Figure 7(a), and (b) iodine in Figure 7(b).
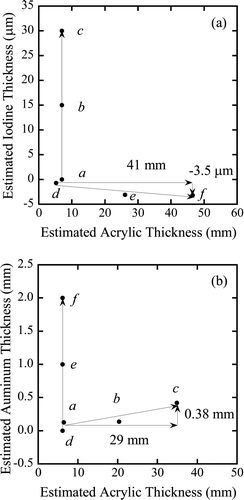
Also, the iodine thickness increases 30 μm from points a to c, in (b). With fitting the points a, b, and c, the iodine thickness increment results in acrylic with 29 mm thickness, and 0.38 mm aluminum thickness.
We assume that the thicknesses of acrylic and iodine are described as vectors and
, which are independent each other, as shown in (a). The estimated thickness distributions of acrylic and iodine in (a) are denoted
and
, where x indicates the phantom position. Similarly, acrylic and aluminum thickness distributions in (b) are denoted
and
.
With the estimation of X-ray absorption by hidden materials described above, the effect of aluminum in (a) is estimated as and that for iodine in (b) is
. Here, 41,000/2000 and − 3.5/2000 mean that the increase of aluminum thickness 2 mm is reflected in the increase in acrylic thickness of 41 mm, and for that of iodine thickness − 3.5 μm, respectively. Writing the thickness distributions of acrylic, iodine, and aluminum as A(x), B(x), and C(x), we have following equations:
With these two equations, we have
After solving these simultaneous equations, A(x), B(x), and C(x) are obtained as shown in .
4.2.3. Estimated results
Similar to , theoretical thickness distributions for acrylic, iodine, and aluminum are shown by dashed lines in . Here, aluminum thickness 1 mm is normalized to 15 μm thick iodine for easy comparison. The thickness distribution of aluminum shows excellent agreement with the theoretical one at the place where the aluminum rod is in. On the contrary, the iodine thickness distribution in the iodine region is overestimated. This phenomenon is expected from (a): the scan data exceeds the iodine thickness 15 μm at the point (0.878, 0.40). This overestimation is related to the underestimation of the acrylic thickness distribution at x = −7.5 mm. Also, the iodine thickness in the positive positions results in the underestimation of corresponding acrylic thickness. Although we have some deviations from the theoretical thickness distributions, we can find iodine and aluminum in their places.
4.3. Origin of two-dimensional map
The photon numbers deposited in a Si(Li) segment detector, Y(E), are calculated for the changes of acrylic and iodine thicknesses with the same conditions of . The calculated results are shown in and for acrylic and iodine thickness increments for the (a) first, (b) second, and (c) third segment detectors and the (d) third segment detectors with Sn filter in front of it, respectively. Without the Sn filter, the energy spectra of deposited X-rays slightly become harder as the X-rays pass through segment detectors. With the Sn filter, the deposited X-rays change their energy spectra drastically.
Figure 10. Corrected thickness distributions for acrylic (dots), iodine (squares), and aluminum (triangles). Aluminum thickness 1 mm is normalized to 15 μm thick iodine for easy comparison. Dashed lines are the theoretical thickness distributions.
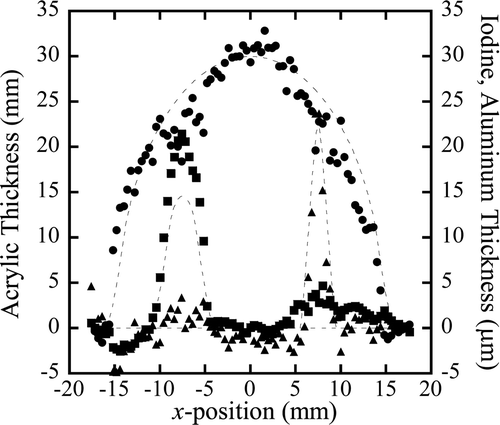
Figure 11. Calculated number of photons deposited in (a) the first, (b) the second, and (c) the third segment detector, and (d) the third segment detector with 300 μm thick Sn filter in front of it as a function of energy. The solid, dashed, and broken lines show the photons after passing 16, 18, and 20 cm of acrylic.
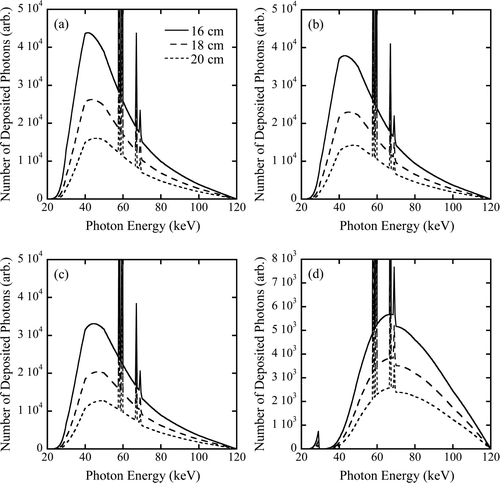
Figure 12. Calculated number of photons deposited in (a) the first, (b) the second, (c) the third segment detector, and (d) the third segment detector with 300 μm thick Sn filter in front of it as a function of energy. The solid, dashed, and broken lines show the photons after passing 0, 20, and 40 μm thick iodine as well as 20 cm of acrylic.
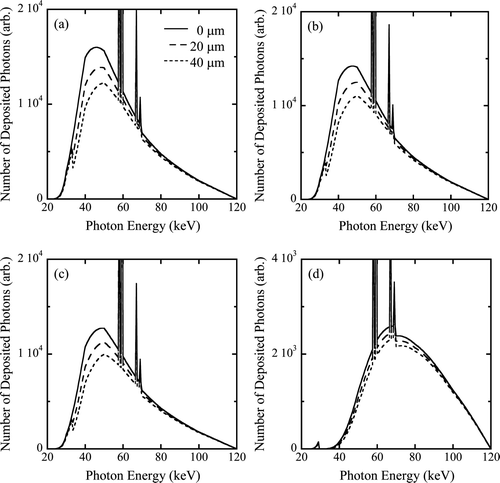
The decrease of X-ray numbers as a function of acrylic thickness increment is nearly the same for the cases with and without Sn filter as seen in . On the contrary, the iodine thickness increase with the Sn filter ((d)) shows less decrement, comparing with the ones without the Sn filter ((a)–(c)).
The electric current, I, is the integral of the product of the number of X-rays, Y(E), and their energy, E. Without the Sn filter, the decrements of I 1, I 2, and I 3 are nearly the same as functions of acrylic and iodine thicknesses and result in the symbols in which are on the same line. In the case of placing the Sn filter in front of the third segment detector, the decrement of I 3 as a function of iodine thickness is smaller than the one as a function of acrylic thickness. These differences make the two-dimensional map for acrylic–iodine thicknesses in .
4.4. Three-dimensional map
In this article, two-dimensional maps for acrylic–iodine and acrylic–aluminum are prepared before estimating the thickness distributions of these materials in the phantom. As a result, effects of hidden materials should be taken into account in the analysis. If a three-dimensional map for acrylic, iodine, and aluminum can be prepared, thickness distributions of these materials are obtained directly. The number of measurements for obtaining a necessary map, however, increases drastically as m × n × l, instead of m × (n + l), where m, n, and l are the numbers of thickness change for acrylic, iodine, and aluminum, respectively.
5. Conclusion
The energy resolved CT has been demonstrated its possibility in reducing the amount of iodine contrast agent, and being free from the beam hardening effect. The transXend detector makes the energy resolved CT a practical diagnosis method.
In this article, we proposed a novel method of applying the transXend detector for estimating the thicknesses of known materials in a phantom. With the previously obtained two-dimensional maps for the combinations of thicknesses of two materials in the phantom, the thicknesses of materials in the X-ray transmission path are estimated: the two-dimensional maps correspond to the response functions employed in the unfolding process of the output electric currents of the transXend detector. Although we have over- and underestimations in the thickness distributions, we can detect the places where we have iodine and aluminum in the acrylic phantom. This method requires only one transmission measurement for detecting iodine-marked tissue and reduces the dose exposure much. With a small number of transmission measurements for different angles to the subject, the shape and the position of cancer tissue can be visualized.
Acknowledgements
The authors are thankful to Prof. K. Watanabe, Nagoya University, for discussion. A part of this work was supported by the Suzuken Memorial Foundation.
References
- Kanno , I. , Maetaki , S. , Aoki , H. , Nomiya , S. and Onabe , H. 2003 . Low exposure X-ray transmission measurements for contrast media detection with filtered X-rays . J. Nucl. Sci. Technol , 40 : 457 – 463 .
- Kanno , I. , Uesaka , A. , Nomiya , S. and Onabe , H. 2008 . Energy measurement of X-rays in computed tomography for detecting contrast media . J. Nucl. Sci. Technol , 45 : 15 – 24 .
- Katayama , H. , Yamaguchi , K. , Kozuka , T. , Takashima , T. , Seez , P. and Matsuura , K. 1990 . Adverse reactions to ionic and nonionic contrast media. A report from the Japanese committee on the safety of contrast media . Radiology , 175 : 621 – 628 .
- Brooks , R.A. and Di Chiro , G. 1976 . Beam hardening in X-ray reconstructive tomography . Phys. Med. Biol , 21 : 390 – 398 .
- Kanno , I. , Uesaka , A. , Nomiya , S. and Onabe , H. 2007 . Comparison of current and energy X-ray measurement methods in contrast media detection . Nucl. Instrum. Methods Phys. Res , A580 : 534 – 536 .
- Butler , A.P.H. , Anderson , N.G. , Tipples , R. , Cook , N. , Watts , R. , Meyer , J. , Bell , A.J. , Melzer , T.R. and Butler , P.H. 2008 . Bio-medical X-ray imaging with spectroscopic pixel detectors . Nucl. Instrum. Methods Phys. Res , A591 : 141 – 146 .
- Kanno , I. , Imamura , R. , Mikami , K. , Uesaka , A. , Hashimoto , M. , Ohtaka , M. , Ara , K. , Nomiya , S. and Onabe , H. 2008 . A current-mode detector for unfolding X-ray energy distribution . J. Nucl. Sci. Technol , 45 : 1165 – 1170 .
- Kanno , I. , Minami , Y. , Imamura , R. , Shimazaki , H. , Fukuda , K. , Ohtaka , M. , Hashimoto , M. , Ara , K. and Onabe , H. 2011 . Advantages of response function change in a transXend detector with various scintillators as substrates of segment detectors . J. Nucl. Sci. Technol , 48 : 1377 – 1384 .
- Ramani , S. and Fessler , J.A. 2012 . A splitting-based iterative algorithm for accelerated statistical X-ray CT reconstruction . IEEE Trans. Med. Imaging , 31 : 677 – 688 .
- Birch , R. and Marshall , M. 1979 . Computation of bremsstrahlung X-ray spectra and comparison with spectra measured with a Ge(Li) detector . Phys. Med. Biol , 24 : 505 – 517 .
- Naruse , Y. and Kobayashi , T. 1982 . Multichannel semiconductor detectors for high energy X-ray and electron beams . Nucl. Instrum. Methods , 191 : 173 – 175 .
