Abstract
An uncertainty reduction method for core safety parameters, for which measurement values are not obtained, is proposed. We empirically recognize that there exist some correlations among the prediction errors of core safety parameters, e.g., a correlation between the control rod worth and the assembly relative power at corresponding position. Correlations of errors among core safety parameters are theoretically estimated using the covariance of cross sections and sensitivity coefficients of core parameters. The estimated correlations of errors among core safety parameters are verified through the direct Monte Carlo sampling method. Once the correlation of errors among core safety parameters is known, we can estimate the uncertainty of a safety parameter for which measurement value is not obtained.
1. Introduction
The safety of a nuclear reactor is guaranteed by design (prediction) calculations. In this context, prediction accuracy or uncertainty of a core analysis code is crucial for reactor safety [Citation1]. However, there are various sources of prediction errors in a calculation code, e.g., uncertainties of cross section, geometry, material density, thermal-hydraulics condition, and analysis methods. Therefore, uncertainties of safety parameters of a core analysis code should be confirmed before the design process. The actual uncertainties can be directly estimated when measurement results are available for the safety parameter in focus. However, there are also other safety parameters for which direct verification by measurement results would be difficult due to lack of experimental results. In such case, a “numerical experiment” using a continuous-energy Monte Carlo code would be used instead of actual experiments.
In the present work, an uncertainty evaluation technique for core safety parameters, for which direct measurement results through an experiment are not obtained, is proposed. Such uncertainty evaluation has a significant meaning when we remind the above discussion.
The errors of core safety parameters calculated by a core analysis code are not independent but inevitably have correlations among them. This is the key concept behind the present work. For example, the error of control rod worth has correlation to the error of relative assembly power at the same position. Such correlations of errors seem to be empirically recognized, but they are not explicitly taken into account in the current safety evaluation.
The uncertainties of predicted core safety parameters are, of course, considered in core analysis through design margins. The uncertainty of a safety parameter is represented by the variance, which is a diagonal element of a variance–covariance matrix. The correlations of errors (in statistical context, uncertainties) of core safety parameters, which correspond to off-diagonal elements in a variance–covariance matrix, have not been explicitly used in the current safety analysis. The present study tries to utilize the off-diagonal elements of a variance–covariance matrix for core safety parameters.
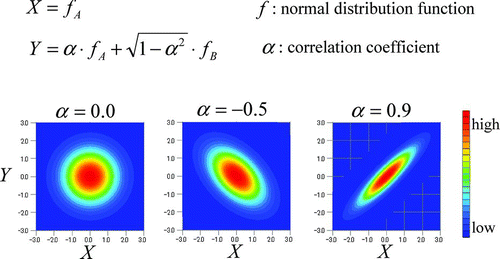
Let us assume that the error of a specific core parameter “X” is identified through an experiment, e.g., a start-up test for a commercial reactor. If we have prior knowledge on the correlation between the errors of core parameters “X” and “Y”, we can estimate the uncertainty of the core parameter “Y”, even if no experimental result exists for “Y”, as shown in . depicts examples of frequency distribution for two parameters (X and Y) having various correlations between them.
Figure 1 Correlation of errors between safety parameters “X” and “Y”
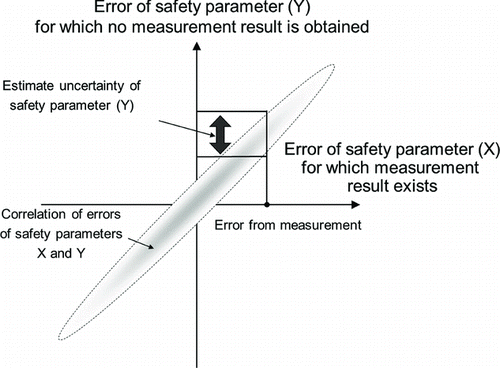
Figure 2 Correlation coefficients and frequency distributions of core parameters X and Y
By utilizing the present method, several applications would be expected, for example:
| • | Estimate the error of control rod worth using the correlation between the errors of control rod worth and assembly power. Such estimation might eliminate the necessity of control rod worth measurement. | ||||
| • | Estimate uncertainty of reload safety parameters (e.g., shutdown margin, local peaking factor/ control rod worth of dropped or ejected control rods) using the correlation of errors between safety parameters and assembly relative power. Through this practice, fidelity of the reload safety parameters can be confirmed. | ||||
| • | Estimate uncertainties of various safety parameters in advanced reactors, for which limited experimental results exist, using the correlations. | ||||
The remaining part of the present paper is organized as follows. In Section 2, theoretical framework of the present method is described as well as brief review of the evaluation method of sensitivity coefficients based on the generalized perturbation theory (GPT). In Section 3, numerical results are presented. Verification of the proposed numerical scheme is carried out through the comparison with the direct sampling method by the Monte Carlo approach. Then application of the present method to an LWR geometry is described. Finally, concluding remarks are summarized in Section 4.
2. Theory
2.1. Correlation of errors among core safety parameters
A variance–covariance matrix for parameters {x1 , x2 ,…, xn } is defined by
The diagonal and off-diagonal elements of the matrix C are the variance and the covariance of parameters, respectively. The diagonal elements correspond to the uncertainties of parameters and the off-diagonal elements represent the correlation among them. It should be noted that the diagonal and off-diagonal elements of the matrix C can be viewed as the variance and the covariance of errors of parameters as shown in Equation (Equation1), since the following relation holds: 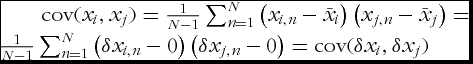 . In the present study, we focus on the correlations of errors of core safety parameters.
The correlation of errors of two parameters is expressed by the correlation coefficient as
The correlation coefficient approaches to +1 and −1 when the two parameters have positive and negative correlations, respectively. When no correlation exists between them, the correlation coefficient goes to zero. Again, the correlation coefficient can be considered as the correlation between errors of core parameters.
The propagation of a variance–covariance matrix is written by the product of a sensitivity and variance–covariance matrixes as [Citation2,Citation3]
In the case of core analysis, the following relations can be used:
It should be noted that Equations (Equation3) and (Equation4) are valid for small perturbation in which responses of target parameters (i.e., parameters after propagation) are accurately expressed by linear functions of input parameters (i.e., parameters before propagation).
As a simple example, we consider three core parameters (k-effective, assembly relative power, and control rod worth at specific position) and two cross sections. In this example, the variance–covariance matrix for the core parameters can be written as follows:
Equation (Equation5) indicates that the correlation among the errors of three core parameters is estimated by the variance–covariance matrix of macroscopic cross sections and the sensitivity coefficients of core parameters.
In the present paper, two different verification calculations will be carried out. In the first case, which is a simplified small LWR case described in Section 3.1, the covariance matrix for macroscopic cross sections for fuel assemblies are provided and then the covariance of core parameters will be estimated by Equation (Equation4). In the second case, which is a commercial PWR case described in Section 3.2, the covariance matrix for microscopic cross section is estimated and then it is propagated to core parameters via heterogeneous macroscopic cross section and assembly-wise homogeneous cross sections. The detailed calculation procedure is described in Section 3.
2.2. Calculation of sensitivity coefficient
The sensitivity coefficient is defined by Equation (Equation6) and represents the relative variation of core parameters due to normalized relative cross section change:
Since a sensitivity coefficient is a variation of a core parameter due to cross section change, it can be calculated by the direct method, i.e., variation of a core parameter is directly estimated using a perturbed cross section. However, when the number of cross sections is increased, the direct calculation of sensitivity coefficients becomes impractical due to heavy computational burden. Instead, the generalized perturbation theory is often used to evaluate sensitivity coefficients [Citation4–Citation6].
Now we consider the following reaction rate ratio, which represents a target core parameter:
By substituting Equation (Equation7) into Equation (Equation6), we have the following:
With the generalized adjoint flux, Equation (Equation8) can be transformed into
The generalized adjoint flux Γ† is defined by
The generalized adjoint equation of Equation (Equation10) can be solved by the Neumann series method [Citation6] or the Hotteling method [Citation7]. In the present study, the Neumann series method is used.
The reaction rate ratio defined by Equation (Equation7) depends on a core parameter in focus. For example, when the assembly relative fission rate at the specific core position is considered as the target parameter, it is defined as follows:
In the case of k-effective, the reaction rate ratio is defined as
In the case of k-effective, the fixed source term in Equation (Equation11) reduces to zero and only the conventional adjoint flux is necessary to estimate the sensitivity coefficient for reactivity.
It should be noted that estimation of the sensitivity coefficient for the control rod worth requires particular consideration in LWR analysis. A detailed description on the estimation method of sensitivity coefficient for control rod worth is provided in the Appendix.
2.3. Uncertainty reduction
In this sub-section, basic theory of uncertainty reduction using correlations among uncertainties is described. Now we consider two different core characteristics, x and y. If they obey the normal distributions with a correlation between them, they are expressed as follows:
By substituting Equation (Equation17) into Equation (Equation18), we obtain the following equation:
Let us assume that value of a core parameter x meas (e.g., the relative power of specific fuel assembly) is known by a measurement. Then Equation (Equation19) can be transformed into
Since the first term of the right-hand side of Equation (Equation20) is a constant value, uncertainty for the core parameter y becomes ![]() . The original uncertainty for y is δy when the correlation between x and y is not taken into account. Therefore, reduction factor of uncertainty for y is
. The original uncertainty for y is δy when the correlation between x and y is not taken into account. Therefore, reduction factor of uncertainty for y is ![]() . When the range of α(−1⩽α⩽1) is taken into account, the reduction factor is always less than or equal to 1. It is also worth noting that the systematic bias (error) of y is estimated by
. When the range of α(−1⩽α⩽1) is taken into account, the reduction factor is always less than or equal to 1. It is also worth noting that the systematic bias (error) of y is estimated by ![]() . The systematic bias (error) is a constant value, since the components of this term, i.e., δy, α, x
meas,
. The systematic bias (error) is a constant value, since the components of this term, i.e., δy, α, x
meas, ![]() , δx, are constants. By utilizing the above theory, uncertainty of a core parameter, which may not have a measured value, can be reduced.
, δx, are constants. By utilizing the above theory, uncertainty of a core parameter, which may not have a measured value, can be reduced.
3. Numerical calculations
3.1. Simplified small LWR
In this verification calculation, the validity of the proposed method is confirmed from three different aspects. First, the correlation among errors of core parameters, which are derived by the method described in Section 2.1, is compared with those obtained by the direct Monte Carlo sampling approach. Second, the validity of the derived correlations among errors of core parameters is discussed through considerations based on reactor physics. Finally, uncertainty reduction of a particular core safety parameter is preliminary evaluated using the correlation of errors in order to show the validity of the present approach.
3.1.1. Calculation conditions
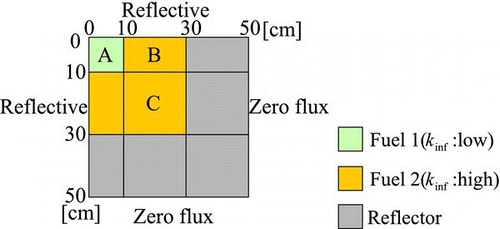
Calculations are carried out in a two-dimensional simple small LWR geometry shown in . Two-group macroscopic cross section set, which is based on the IAEA LWR benchmark problem [Citation8], is given in . Since the present calculation is carried out to confirm the validity of the proposed method, the values of variance–covariance matrix is set to be artificial ones, i.e., the standard deviation (uncertainty) of the thermal capture and fission cross sections are assumed to be 1%, respectively, and the correlation coefficient among them is assumed to be 0.5 for Fuel 2. No cross section uncertainty is assigned for cross sections of Fuel 1 and Reflector.
Table 1 Two-group cross sections used in the benchmark problem (unit:1/cm)
Two-group diffusion theory is used to evaluate core characteristics. Therefore, the generalized adjoint flux is also calculated by the two-group diffusion theory. Three typical core parameters are chosen for estimation of uncertainties, i.e., the multiplication factor (k), the relative power of a region (RP), and the control rod worth (CR).
3.1.2. Comparison with direct Monte Carlo sampling method
In order to verify the validity of the present method, estimated correlations among errors of core parameters are compared with those obtained by the direct Monte Carlo sampling method. More specifically, the following procedure is adopted in the Monte Carlo method to estimate the correlations among errors of core parameters.
| 1. | Randomly sample the capture and the fission thermal cross sections of Fuel 2 by | ||||
| 2. | Perform forward core calculations using two-dimensional diffusion theory with the perturbed cross section generated in Step (1) and then estimate core characteristics, i.e., k-effective, relative power of each region, and control rod worth of each region. | ||||
| 3. | Repeat Steps (1) and (2) for 10,000 times. | ||||
| 4. | Statistically evaluate the variance and covariance of variation of core parameters using Equations (Equation23) and (Equation24), respectively: | ||||
| 5. | Evaluate the correlation coefficient using Equation (Equation2). | ||||
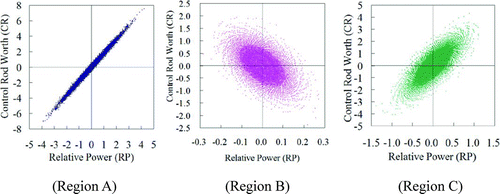
Variations of relative power and control rod worth in Regions A–C due to cross section perturbation in Fuel 2, which are obtained by the direct Monte Carlo Sampling method described above, are plotted in . Note that variations (error) of core parameters are defined by the difference from the average values, i.e., the average value of a core parameter corresponds to the origin in each figure. Apparently, we can observe various correlations between the errors of relative power and the control rod worth. These correlations will be discussed in more detail in the following part.
Figure 4 Variation of relative power and control rod worth (unit:%)
Correlation coefficients among errors of core neutronics parameters obtained by the direct Monte Carlo sampling and the present method based on the GPT are summarized in . The results obtained by the Monte Carlo method and those by the GPT show good agreement. Note that statistical uncertainty of the direct Monte Carlo sampling method is less than 0.01. Therefore, the validity of the present method is verified.
Table 2 Correlations of errors obtained by the direct Monte Carlo sampling and the present method based on the GPT
The variance and covariance of core parameters are shown in and , respectively. The upper and lower triangle parts in correspond to those obtained by the direct Monte Carlo sampling method and those by the GPT, respectively. For example, shows that the variances of control rod worth in Region A obtained by the Monte Carlo method and the GPT are 4.23% and 4.21%, respectively. The correlation coefficients shown in can be derived from and using Equation (Equation2).
Table 3 Variance of core parameters (×10−4)
Table 4 Covariance of core parameters (×10−4)
3.1.3. Discussion on correlations of errors
From , we can see several observations on the correlation of errors among core parameters. It should be reminded that Fuel 2 (loaded Regions B and C) has uncertainty; thus, its cross section is perturbed. However, no uncertainty is assigned to Fuel 1 (loaded Region A) and Reflector; thus, these cross section is fixed. It is also noted that error of core characteristics is defined by the variation of core characteristics due to cross section perturbation. Namely, the errors of core characteristics are zero in the unperturbed cross section case.
| • | Many errors of core parameters are highly correlated. It means that errors of many core parameters can be estimated using errors of other core parameters. | ||||
| • | Errors of k-effective and relative power (RP) in Region A has negative correlation while we can observe opposite correlation for Regions B and C. K-infinity of the fuel loaded in Region A is lower than those in Regions B and C. When the relative power in Region A increases, k-effective of the core decreases since importance of the low k-infinity fuel (Region A) increases. Thus, the relative power in Region A and k-effective has negative correlation. When the relative power of Regions B and C increases, that of Region A inevitably decreases since the relative power is normalized unity throughout Regions A–C. Therefore, the correlations between core k-effective and the relative power show opposite trend between Region A and Regions B, C. | ||||
| • | Error of control rod worth (CR) in Regions A and C has positive correlation with those of relative power (RP) in Regions A and C. Therefore, when the relative power of Regions A and C increase due to a variation of cross section in Fuel 2, the control rod worth in Regions A and C also increases. This correlation is intuitively expected from the basic reactor physics theory. | ||||
| • | However, error of control rod worth in Region B has negative correlation with that of relative power in Region B. This correlation is not intuitively understandable; thus, we investigated the reason for the negative correlation as follows. | ||||
shows neutron flux distribution before cross section perturbation in the present configuration. Let us assume that the thermal fission cross section in Fuel 2 is increased due to perturbation. Since the absorption cross section is defined by the sum of fission and capture cross sections, the absorption cross section also increases with the perturbation (increase) of fission cross section. Variation of neutron flux due to the present perturbation is shown in . It should be reminded that the thermal neutron flux at Region B is decreased in . Now we consider the response of core characteristics. The relative power of Region B has the following two opposite effects due to the perturbation (increase) of fission cross section of Fuel 2. At first, the relative power tends to increase since thermal fission cross section is increased. Second, the relative power tends to decrease since the thermal neutron flux decreases. In the present study, the first effect is superior to that of the second. Consequently, the relative power increases due to increase of fission cross section. In contrast, the control rod worth decreases since thermal flux at Region B decreases.
Figure 5 Neutron flux distribution in the present benchmark configuration
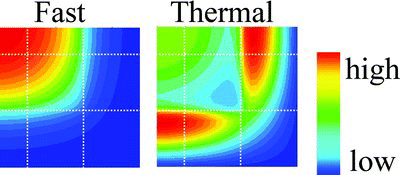
Figure 6 Perturbation of neutron flux distribution due to cross section perturbation in Fuel 2
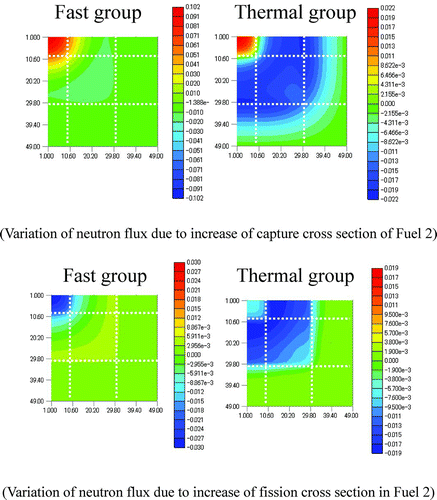
Next we consider variation (increase) of capture cross section in Fuel 2. In this case, variation of the relative power and the control rod worth is not very large compared to those obtained by the variation of fission cross section. Namely, the variation of fission cross section yields a dominant effect for uncertainties of the relative power and the control rod worth in the present condition.
Consequently, the variation of control rod worth (decrease) has opposite trend that of the relative power (increase) in Region B.
In the case of Region C, though the thermal flux becomes lower as in Region B, depression of the thermal flux Region C is smaller than that of Region B. Therefore, relative power increases due to increase of fission cross section. Therefore, variation of relative power (increase) has the same trend to that of control rod worth (increase) in Region C.
3.1.4. Uncertainty reduction
In this sub-section, preliminary estimation of uncertainty reduction using correlations among errors is carried out.
In the benchmark calculation shown in the previous sub-section, the uncertainty of control rod worth in Region A due to cross section variation of Fuel 2 is 2.06% (= ![]() ) when the correlation is not taken into account. The correlation coefficient between the relative power in Region A and control rod worth in Region A is 0.995; thus, the uncertainty of the control rod worth in Region A is decreased to 0.21% as shown in Equation (Equation25), which is based on the discussion for Equation (Equation20)
) when the correlation is not taken into account. The correlation coefficient between the relative power in Region A and control rod worth in Region A is 0.995; thus, the uncertainty of the control rod worth in Region A is decreased to 0.21% as shown in Equation (Equation25), which is based on the discussion for Equation (Equation20)
Namely, the uncertainty reduction of control rod worth is approximately 90% in this case. Furthermore, we can also estimate the systematic bias of core parameter y appears in Equation (Equation20), i.e., ![]() . For example, let us assume that the error of the relative power in Region A is 1%. In this case, the systematic bias of the control rod worth in Region A is calculated as
. For example, let us assume that the error of the relative power in Region A is 1%. In this case, the systematic bias of the control rod worth in Region A is calculated as
Therefore, the error of control rod worth in Region A is expected as 1.80±0.21(\%;). If the correlation between uncertainties of core parameters is not taken into account, the error of the control rod worth in Region A is estimated as 0.0±2.06(\%;). Apparently, uncertainty of a core parameter without measurement value can be reduced.
It should be reminded that we should consider uncertainties not only from cross sections but also from prediction methods, thermal-hydraulics, fabrication tolerance, operation parameters, and so on, in the actual (or real) core simulation. It will be an issue to be addressed in future study. The present study focuses on the confirmation of fundamental feasibility of uncertainty reduction using correlation of errors among core parameters. Thus, the uncertainty only from cross section data is considered for simplicity. In the present ideal situation, Equation (Equation26) gives the systematic bias.
The above approach can be utilized in various situations. For example, in the advanced reactor development, we usually have limited measurements on specific core parameters. However, errors of other core parameters could be estimated using the present method. Thus, the present method will contribute to increase fidelity of a neutronics calculation method especially when its validation with the measurement value is difficult.
3.2. Commercial PWR
As the second numerical calculation, a typical commercial PWR is treated in order to confirm the applicability of the present method to real world problems.
3.2.1. Calculation flow
A typical core analysis of LWRs is carried out in the two-step approach, i.e., the assembly and core calculations. In this numerical calculation, a similar but somewhat simplified approach is adopted as shown in . The effective microscopic cross sections in heterogeneous geometry are generated through resonance calculation. The SRAC code is used for this calculation [Citation9]. No energy condensation or spatial homogenization is carried out. Thus, the number of energy groups is 107. Then the effective macroscopic cross sections in heterogeneous geometry are generated with the microscopic cross sections obtained by the SRAC code. Next, pincell calculations are carried out by the AEGIS code, which is a neutron transport code based on the method of characteristics [Citation10]. In an actual LWR analysis, assembly calculations are carried out to generate assembly homogenized cross sections. However, in this study, pincell calculation is used as a substitute of the assembly calculation in order to simplify the calculation procedure. Two-group “assembly” average cross sections are generated by the pincell calculation. These calculation steps correspond to the ordinary lattice calculation to generate assembly homogeneous cross section.
Figure 7 Typical calculation scheme for commercial PWR geometry
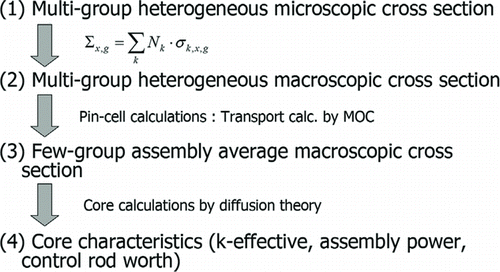
Then the core calculation using the two-group cross section is carried out with diffusion theory in order to obtain core characteristics such as k-effective, assembly relative power, and control rod worth.
In actual power reactor calculations, burnup and feedback effect should be taken into account. However, estimation of sensitivity coefficients considering the burnup and the feedback effect still requires further development. Therefore, beginning of cycle condition of initial core without feedback effect is considered in the present analysis for simplicity.
Propagation of covariance matrix is also carried out along with the core calculation procedure described above as shown in . The covariance matrices for each nuclide are generated by the ERROR module of the NJOY code [Citation11]. The energy group structure for the covariance matrix of each nuclide is adjusted to the 107 group structure of the SRAC code system. The covariance matrix for heterogeneous macroscopic cross section is generated by
Figure 8 Calculation scheme for estimation of correlation in commercial PWR geometry
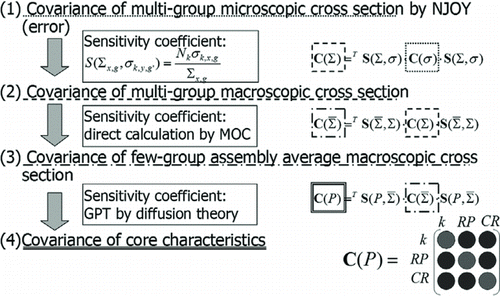
The covariance matrix of assembly average cross section is given by
In the present study, ![]() is estimated by the direct method. Namely, each component of multi-group heterogeneous macroscopic cross sections are perturbed and then the variations of few group macroscopic cross sections are evaluated through forward calculations. Therefore, forward calculations are repeatedly carried out as the number of multi-group cross sections. As described in the previous section, the assembly calculation is approximately treated by pincell calculation which represents a whole assembly. Neutron transport calculation based on the method of characteristics with the AEGIS code is carried out with multi-group (107 groups) heterogeneous cross section. Then the heterogeneous multi-group cross sections are spatially homogenized and energetically collapsed into two groups for subsequent core calculations.
is estimated by the direct method. Namely, each component of multi-group heterogeneous macroscopic cross sections are perturbed and then the variations of few group macroscopic cross sections are evaluated through forward calculations. Therefore, forward calculations are repeatedly carried out as the number of multi-group cross sections. As described in the previous section, the assembly calculation is approximately treated by pincell calculation which represents a whole assembly. Neutron transport calculation based on the method of characteristics with the AEGIS code is carried out with multi-group (107 groups) heterogeneous cross section. Then the heterogeneous multi-group cross sections are spatially homogenized and energetically collapsed into two groups for subsequent core calculations.
Finally, covariance matrix for two-group assembly homogeneous cross section is propagated to core characteristics using
The GPT based on diffusion theory was used to estimate ![]() in this study. Fundamental theoretical description is provided in Section 2.2. K-effective, assembly relative power, and control rod worth are considered as the core characteristics.
in this study. Fundamental theoretical description is provided in Section 2.2. K-effective, assembly relative power, and control rod worth are considered as the core characteristics.
3.2.2. Calculation conditions
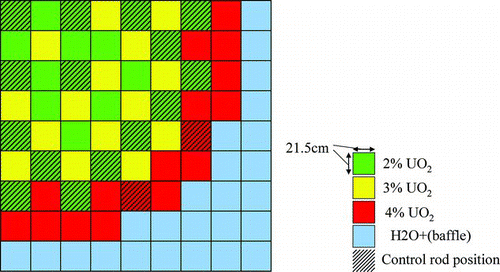
Calculation geometry is shown in , which is a typical four-loop type PWR. Two-dimensional geometry with quarter core symmetry is used. Initial core without burnup is considered. Hot-full power condition is assumed, but no thermal-hydraulics feedback is taken into account in this study. JENDL4.0 is used for the cross section and associate covariance data [Citation12]. In this study, cross section covariance matrices for 235U, 238U, and 16O were taken into account.
Figure 9 Calculation geometry of commercial PWR
3.2.3. Correlations of errors
Correlations of errors of core parameters are estimated by the calculation procedure described in the previous two sections. Though various correlations can be observed through the present result, the correlation between the errors of relative assembly power and the errors of control rod worth in the octant core, which is shown in , is discussed. We can observe clear correlation among the errors of relative assembly power and control rod worth. In general sense, positive correlation might be expected among the errors of relative assembly power and control rod worth, since both are related to the level of thermal neutron flux at the corresponding position. However, we can also see the negative correlation in .
Figure 10 Correlation among the errors of relative assembly power and control rod worth in octant core
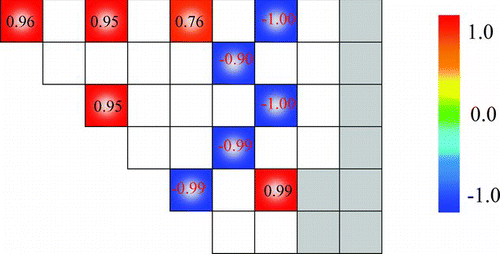
Explanation of this observation is somewhat complicated but would be explained as follows. At first, we should remind that we consider cross section uncertainty of multi-group microscopic cross sections. If we consider perturbation of macroscopic cross section of particular fuel assembly, the errors of relative assembly power and control rod worth would have only positive correlations. Namely, the relative assembly power and control rod worth would generally have direct proportional relationship. However, we now consider the perturbation of multi-group microscopic cross sections. Thus, properties of all fuel assemblies are simultaneously affected by the cross section perturbation. Now we consider the perturbation of microscopic fission cross section of 235U, which is a dominant contributor to the variation of core characteristics. Let us assume that the fission cross section of 235U increases. In this case, fission cross sections of all fuels (2wt%, 3wt%, and 4wt% enrichments) increase. However, neutron spectrum of low enrichment fuel is softer than those of high enrichment fuels. Therefore, even if the relative perturbation of fission cross section of 235U is the same, relative increase of reactivity for low enrichment fuel is larger than those for high enrichment fuels. Now we recall the loading pattern used in the present analysis. Low enrichment fuels are loaded inside of the core and high enrichment fuels are loaded at the peripheral region. Thus, when the fission cross section of 235U increases, power distribution in the core skews to the center, i.e., power distribution at the center region of the core increases and that at peripheral region of the core decreases. The variation of core power distribution also affects the control rod worth. Neutron flux at the center of core increases and that at peripheral of core decreases. Thus, the control rod worth of core center region increases and that of core peripheral region decreases. Consequently, at the center region of a core, both the control rod worth and assembly relative power increase; thus, the positive correlation is observed. At the peripheral region of a core, both control rod worth and assembly relative power decrease; thus, the positive correlation is also observed. The situation is rather complicated at the middle region (the region between the core center and the peripheral regions). In this region, control rod worth decreases since neutron flux decreases. On the other hand, two different factors should be considered regarding to the relative assembly power. The first one is the variation of flux level. As discussed above, level of neutron flux decreases; thus, the assembly power tends to decrease. The second one is the variation of fission cross section. Since fission cross section increases, the assembly power tends to increase. These two factors offset each other, but the second factor has larger impact; thus, the assembly power increases. To sum up, when the fission cross section of 235U increases, the control rod worth decreases and the assembly power increases at the middle region of the core. Therefore, the negative trend between the errors of the relative assembly power and the control rod worth is observed at the middle region of the core. It should be reminded that when we consider other cross section perturbations, e.g., perturbation on capture cross section of 238U, different correlations between the errors of relative assembly power and control rod worth would be observed.
The present result suggests that the error of control rod worth would be estimated by the error of assembly relative power, which can be obtained by an in-core mapping measurement.
3.2.4. Uncertainty reduction
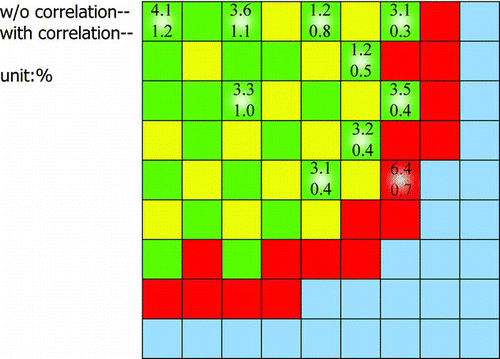
With the correlation between the errors of control rod worth and relative assembly power obtained in the previous section, uncertainty reduction of control rod worth is discussed. Typically, the assembly relative power distribution is measured in commercial PWRs as a part of reactor physics test during start-up. Thus, actual error of assembly power distribution can be obtained by the measurement. Once the error of relative power for each fuel assembly is known, we can reduce uncertainty of control rod worth according to the procedure described in Section 2.3.
Estimated uncertainty of control rod worth is shown in . The upper column corresponds to the uncertainties of control rod worth without consideration of correlation between the errors of relative power and control rod worth, i.e., the uncertainty of control rod worth due to cross section uncertainty. The lower column corresponds to the reduced uncertainty of control rod worth with consideration of correlation between the errors of relative power and control rod worth. clearly indicates that the uncertainty of control rod worth due to cross section uncertainty can be reduced by taking into account the error of assembly power. The present result suggests that the proposed approach to reduce uncertainty of core parameters would be useful in practical applications.
Figure 11 Uncertainty reduction of control rod worth with or without the prior knowledge of the error of assembly relative power
4. Conclusions
The uncertainty estimation method considering the correlations among the errors of core neutronics parameters has been proposed. When the correlations among errors are taken into account, we can estimate and reduce the uncertainties of core parameters for which measurement value do not exist.
The correlations of errors are calculated by the variance–covariance matrix of cross section and the sensitivity matrices. A brief explanation on the theoretical basis for the estimation method is described.
The validity of the present method is confirmed through comparison with the direct Monte Carlo sampling method. Furthermore, a preliminary estimation on the correlations among errors of core parameters, i.e., k-effective, the relative power, and the control rod worth, is carried out in two cases: simplified small LWR geometry using an artificial variance–covariance matrix for cross sections and actual PWR geometry using variance–covariance matrix obtained by JENDL4.0. Physical interpretations of the estimated results are discussed. With the present method, actual uncertainty of core parameters, which are difficult to quantify through measurement, can be estimated. The uncertainty reduction of core parameters using measurement values of other core parameters is also demonstrated.
The present method will improve reliability of core simulation method with utilization of a variance–covariance matrix of cross sections and sensitivity coefficients.
Additional studies are still necessary as future works. Though only three parameters (k-effective, relative power distribution, and control rod worth) are taken into account in this study, other core parameters (e.g., reactivity coefficient, power peaking factor, shutdown margin) would be taken into account. A similar correlation analysis considering burnup and feedback effects will be necessary. Though correlations of two core parameters are considered in the present study, the present concept could be extended to more general cases.
Acknowledgements
This work was supported in part by JSPS KAKENHI, Grant-in-Aid for Scientific Research (C) (24561040).
Notes
Note: Upper and lower rows show the fast and thermal cross sections, respectively.
Figure 3 Calculation geometry of simplified small LWR
Note: The upper right triangle part shows the results by the direct Monte Carlo sampling method while the lower left part shows those by the GPT. k: k-effective, RP: relative power, and CR: control rod worth.
Note: The upper right triangle part shows the results by the direct Monte Carlo sampling method, while the lower left part shows those by the GPT. k: k-effective, RP: relative power, and CR: control rod worth.
References
- Williams , M L . 2007 . Sensitivity and uncertainty analysis for eigenvalue-difference responses . Nucl Sci Eng , 155 : 18
- Abdel-Khalik , H S , Turinsky , P J and Jessee , M A . 2008 . Efficient subspace methods-based algorithms for performing sensitivity, uncertainty, and adaptive simulation of large-scale computational models . Nucl Sci Eng , 159 : 256
- Jessee , M A , Abdel-Khalik , H S and Turinsky , P J . 2009 . “ Cross-section uncertainty propagation and adjustment algorithms for bwr core simulation ” . In Proceedings Advances in Nuclear Fuel Management IV , SC , , USA : Hilton Head . Apr; CD-ROM
- Usachev , L N . 1964 . Perturbation theory for the breeding ratio and for other number ratios pertaining to various reactor processes . J Nucl Energy A/B , 18 : 571 doi: 10.1016/0368-3230(64)90142-9
- Jessee , M A , Williams , M L and Dehart , M D . 2009 . “ Development of generalized perturbation theory capability within the SCALE code package ” . In Proceedings. M&C , NY , , USA : Saratoga Springs . CD-ROM
- Takeda , T , Asano , K and Kitada , T . 2006 . Sensitivity analysis based on transport theory . J Nucl. Sci Technol , 43 : 733
- Misawa , T , Yamamoto , A and Yamame , Y . 1996 . Application of Nodal method to Lambda mode higher harmonics code . J Nucl Sci Technol , 33 : 668 doi: 10.1080/18811248.1996.9731975
- Argonne Code Center . 1977 . “ Benchmark problem book (11. multi-dimensional (x-y-z) LWR model ” . In ANL-7416 , Argonne National Laboratory . Suppl. 2
- Okumura , K , Kugo , T , Kaneko , K and Tsuchihashi , K . 2007 . “ SRAC2006: a comprehensive neutronics calculation code system ” . In JAEA-Data/Code 2007-004 , Japan Atomic Energy Agency .
- Sugimura , N , Yamamoto , A , Ushio , T , Mori , M , Tabuchi , M and Endo , T . 2007 . Neutron transport models of AEGIS: an advanced next-generation neutronics design system . Nucl Sci Eng. , 155 : 276
- MacFarlane , R E and Muir , D W . 1994 . The NJOY nuclear data processing system version 91 LA-12740-M
- Shibata , K , Iwamoto , O , Nakagawa , T , Iwamoto , N , Ichihara , A , Kunieda , S , Chiba , S , Furutaka , K , Otuka , N , Ohsawa , T , Murata , T , Matsunobu , H , Zukeran , A , Kamada , A and Katakura , J . 2011 . JENDL-4.0: a new library for nuclear science and engineering . J Nucl Sci Technol , 48 : 1 doi: 10.1080/18811248.2011.9711675
Appendix
Calculation of sensitivity coefficient for control rod worth
In conventional method, which is mainly used for a fast reactor analysis, the control rod worth (CR) is approximately evaluated as Equation (EquationA1) [Citation6]. Consequently, the sensitivity coefficient for the control rod worth has been evaluated by Equation (EquationA2) in the conventional method:
Equation (EquationA2), which is based on the GPT to estimate the control rod effect, may not be adequate for an LWR analysis in which control rod movement causes a large cross section change and spatial distortion of flux distribution. Thus, the control rod worth is estimated by Equation (EquationA4) in the present method [Citation1]:
The effect of a cross section change from control rod movement is calculated by the rigorous perturbation theory. On the other hand, the effect of a cross section change due to uncertainty is calculated by the GPT. In other words, we should consider two different cross section changes in the sensitivity analysis of control rod worth. The first one is a cross section change of control rod movement that causes a large cross section perturbation in an LWR analysis, and thus should be treated with an explicit manner as shown in Equation (EquationA4). The second one is small perturbation due to cross section uncertainty, and thus can be treated by the GPT.
The generalized source, which is necessary to calculate the sensitivity coefficient of the control rod worth defined by Equation (EquationA4), is given by Equation (EquationA5) at the control rod withdrawal condition,
Equation (EquationA5) can be transformed into
Finally, the sensitivity coefficient for the control rod worth is written as
Calculation cost of this method seems to be larger than that of the conventional method because the forward and adjoint fluxes should be evaluated in each control rod condition. However, it should be reminded that the generalized and the generalized adjoint fluxes at each control rod configuration are not necessary in the present method. Therefore, difference of calculation cost between the present method and the conventional method is not very large.