Abstract
The authors invented the transXend detector, which measures X-rays as electric currents, and then gives the energy distribution of the X-rays after an unfolding process. In a previous paper, it was shown that the material thickness distributions can be estimated with the transXend detector by using reference points plotted from the electric current ratios, such as the I 2/I 1 − I 3/I 1 graph, where Ii denotes the electric current measured by the i-th segment of the transXend detector. In this paper, the tomographic images of iodine, aluminum, and the acrylic those surround the other two materials are reconstructed from their material thickness distributions, which are estimated from two X-ray incidence directions. The X-ray event ratios are also used to estimate the material thickness distributions.
1. Introduction
Even 40 years after its invention, X-ray computed tomography (CT) is one of the most powerful methods for finding tumors such as cancers. The CT, however, has shortcomings, such as high dose exposure and, when used, the side effects of the iodine contrast agent [Citation1].
In conventional CT, the X-rays are measured as electric currents. This means that the energy information of the X-rays is not used in CT measurements. When detecting the iodine contrast agent, which has higher concentrations in cancer tissues than in normal tissues, it becomes more difficult to find the effects of X-ray absorption by iodine if the subject is thick and/or the X-ray tube voltage is high, because the number of X-rays that are sensitive to the absorption of iodine (K-edge: 33.2 keV) decreases. This phenomenon is known as the beam-hardening effect [Citation2]. To avoid this beam-hardening effect, the CT measurements using the energy information of the X-rays, i.e., energy-resolved CT, is under intensive study [Citation3, Citation4].
To perform energy-resolved CT, the energies of the X-rays must be measured. The number of X-rays entering the detector is, however, too great to measure the energy of each X-ray individually. The number of X-rays is estimated to be nearly 109 per mm2 per second when the X-rays pass through the air only, and ∼106 per mm2 per second after passing through a thick human body. However, the input pulse rate should not exceed 0.5 × 10⁶ per mm2 per second to avoid any distortion of the recorded spectrum because of pulse pileup effects [Citation5]. Measurement of the energy of each individual X-ray that enters the detector is impractical at this stage.
The authors have been demonstrating the advantages of energy-resolved CT using a transXend detector, which measures the X-rays as electric currents and produces the energy distribution of the incident X-rays after analysis [Citation6, Citation7]. The counting rate problem does not have any effect on the current measurement of the X-rays.
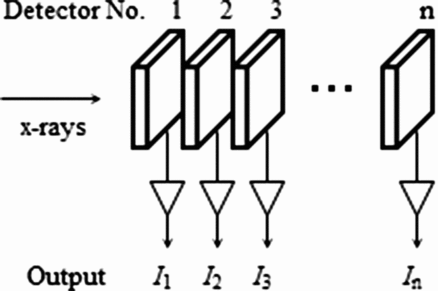
The transXend detector consists of several segment detectors, which are aligned along the direction of X-ray incidence, as shown in . The responses of the segment detectors change according to the energies of the X-rays and the positions of the segment detectors. By estimating the segment detector response functions as a function of the X-ray energy, the incident X-ray energy distribution is estimated by using the measured electric currents.
By using the energy information obtained by the transXend detector, the CT value of the iodine region in an acrylic phantom was found to be twice as high as that obtained by conventional current measurement-based CT [Citation8]. This means that the volume of iodine contrast agent injected into a human subject can be nearly halved. This reduction in the injected iodine may reduce the side effects of the iodine contrast agent, which leads to approximately one fatality among every 10,000 patients [Citation1].
In our previous paper, we demonstrated that simple transmission measurements allowed us to derive the thickness distributions of known materials, based on corresponding reference maps of the ratios of electric currents for these materials, which were measured using the segment detectors. The thickness distributions of acrylic, iodine, and aluminum were shown for an acrylic phantom with iodine thinned by water and an aluminum rod [Citation9].
This paper shows the results of tomographies using the material thickness distributions obtained from two-directional transmission measurements for an iodine region, an aluminum rod, and the surrounding cylindrical acrylic phantom. In the tomography reconstruction process, the maximum likelihood expectation maximization (ML-EM) method is used [Citation10]. In addition to the electric current ratios, X-ray events in the assigned energy ranges are also used to estimate the material thickness distributions and for tomography reconstruction.
2. Experiments
2.1. Experimental setups
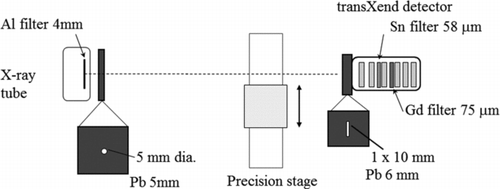
The experimental setup is shown in . The X-ray tube (TRIX-150S, Toreck Co Ltd., Japan) was operated at a tube voltage of 120 kVp and a tube current of 2.4 mA. As an additional filter, a 4-mm thick Al plate was used. A 5-mm diameter collimator made from 5-mm thick lead was attached at the exit of the X-ray tube.
The transXend detector with six segment detectors was placed facing the X-ray tube. The segment detector was a Si(Li) detector with dimensions of 10 × 10 × 1 mm3. The segment detectors were operated at room temperature without application of a bias voltage [Citation11]. The Sn and Gd foils with thicknesses of 58 and 75 μm were inserted in front of the third and fourth segment detectors, respectively. A 6-mm thick lead collimator with a 1-mm wide opening was attached at the entrance window.
A precision stage was placed between the X-ray tube and the transXend detector for translation of the phantoms. On this stage, we set one of the three phantoms shown in –.
Figure 3 Phantoms used for (a) the acrylic–iodine two-dimensional map, (b) the acrylic–aluminum two-dimensional map, and (c) the transmission measurements

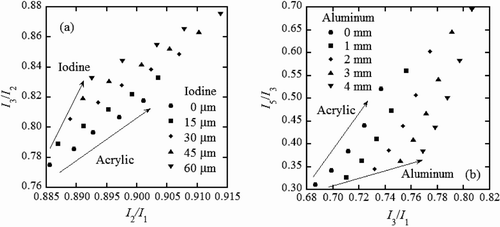
To obtain reference electric currents for the various combinations of the acrylic and iodine thicknesses, phantom (a) was used. The 12-mm thick acrylic slab used has four square regions with widths of 10 mm and thicknesses of 10 mm in the direction of X-ray incidence. An iodine tincture thinned with water was used to fill these regions with effective thicknesses of 15–60 μm of iodine at 15 μm intervals. To scan this phantom, the X-rays, after passing through various iodine thicknesses, were measured by the segment detectors as electric currents. After these measurements were performed, an additional 10 mm thick acrylic slab was added and the same measurements were performed repeatedly until four additional acrylic slabs were added in total.
Similarly, phantom (b) was used to measure the electric currents for combinations of acrylic and aluminum with various thicknesses. Phantom (b) had four aluminum plates, resulting in a stepped phantom that ranged from 1 to 4 mm in thickness with 1 mm thickness intervals. The acrylic thickness varied from 12 to 52 mm with 10 mm intervals.
Two-dimensional maps of the acrylic–iodine and acrylic–aluminum relationships are shown in . In the figure, the acrylic thickness changes from 12 to 52 mm in the direction shown by the arrow for each iodine or aluminum thickness indicated in the figure. The thickness increment directions for acrylic and iodine are different in panel (a) as well as for acrylic and aluminum in panel (b).
2.2. Transmission measurements of a cylindrical phantom
For thickness estimation of the known materials, the cylindrical acrylic phantom shown in was used. The phantom was 30 mm in diameter. The phantom contained a 5-mm diameter iodine region filled with the thinned iodine tincture with an iodine thickness of 15 μm in the 5 mm X-ray path. The phantom also contained a 2-mm diameter aluminum rod. The directions in the phantom in which the transXend detector sees the iodine region and the aluminum rod separately and overlapping are defined as 0 and 90 degrees, respectively. The scan was performed with a 0.4-mm pitch. The transmission measurements were carried out for a cylindrical phantom at 0 and 90 degrees.
3. Analysis
3.1. Electric current ratio
3.1.1 Scan results
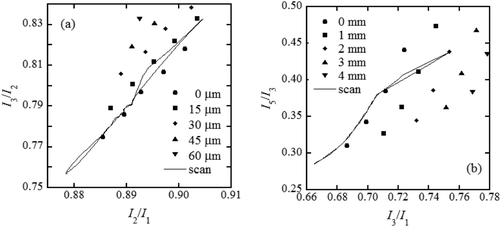
The electric current ratios were calculated for each scan point and were then plotted on the two-dimensional maps as shown in and for 0 and 90 degree scans, respectively. The symbols are the same as those in , but are shown only for the smaller parts in and .
Figure 5 Scan results for the cylindrical acrylic phantom (Figure 3(c)) at 0 degrees in (a) acrylic–iodine and (b) acrylic–aluminum two-dimensional maps. The symbols are the same as those used in
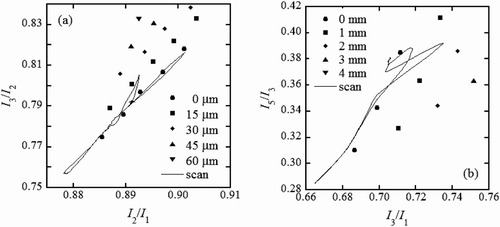
In the acrylic–iodine map of the 0 degree scan shown in , the scan moves along the points with an iodine thickness of 0 μm until the X-rays penetrate the iodine region. When the X-rays pass through the iodine region, the scan then moves towards the point where the iodine thickness is 15 μm (0.893, 0.805). As the scan proceeds, the X-rays again pass places where there is acrylic only and the scan moves back to the no-iodine places. In the case where the X-rays pass through the aluminum rod, the scan moves to the thick acrylic and the negative iodine thickness (0.901, 0.816). Because there is no place to express the effect of X-ray absorption by aluminum in this graph, the aluminum thickness is regarded as thick acrylic and negative iodine. Finally, the scan moves back to the no-iodine places and to the air point (0.878, 0.757).
Similarly, the results for the acrylic–aluminum map of the 0 degree scan are shown in . When the X-rays pass through the thin acrylic, the scan moves along the places where there is no aluminum. As the X-rays pass through the iodine region, the scan moves to the points where the aluminum thickness is between 0 and 1 mm (0.718, 0.387). At the center of the acrylic phantom, the scan moves back to the places with zero aluminum thickness. When the X-rays pass through the aluminum rod, the scan rapidly moves close to the 2-mm thick aluminum points (0.735, 0.392). After that, the scan returns to zero aluminum thickness.
At certain points, for example (0.686, 0.310), the no-aluminum point indicated by the circle symbol does not match the scan point. This disagreement suggests that the X-ray tube had slightly different operating conditions at the times of the step phantom measurements and the cylindrical phantom scan.
In the 90 degree scan shown in , the scan moves along the points where there is acrylic only before it passes through both iodine and aluminum. As the X-ray absorption increases because of the presence of iodine and aluminum, the scan moves to the thicker iodine and aluminum points, respectively.
3.1.2 Thickness distributions
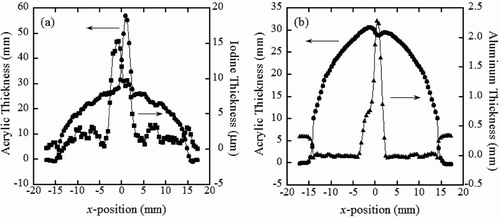
For each scan point in and , the acrylic, iodine, and aluminum thicknesses that the X-rays passed through are estimated. The results are shown in and for the 0 and 90-degree scans, respectively.
Figure 7 Estimated thickness distributions obtained from the electric current ratios for (a) acrylic (circles)–iodine (squares) and (b) acrylic (circles)–aluminum (triangles) for a 0-degree scan. The solid lines act as guides for the eye
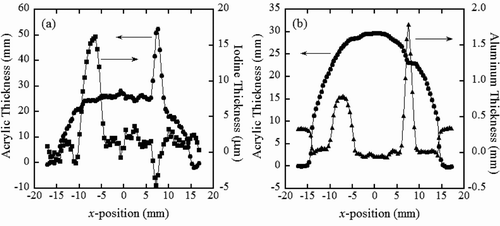
In the acrylic–iodine thickness distribution at 0 degree shown in , the acrylic thickness is overestimated and the iodine thickness showed a negative value at around x = +7.5 mm. This corresponds to the thick acrylic and slightly negative iodine thicknesses at (0.901, 0.816) in . shows nearly 0.8 mm thick aluminum at the iodine region position, i.e., at x = −7.5 mm. This indicates that the iodine is recognized as aluminum, as seen at (0.718, 0.387) in . The same effects as those described above are shown in the thickness distributions at 90 degrees in and , but are not very obvious, because the iodine region and the aluminum rod are overlapping for the trans-Xend detector. However, the valley in the iodine thickness distribution at x = +0.8 mm in , and the shoulder in the aluminum thickness distribution at x = −1.6 mm in are observed. This is because the phantom was not placed exactly at 90 degrees, but was somehow tilted.
3.1.3 Effects of hidden materials
The effect of X-ray absorption by aluminum is hidden in , as well as the one by iodine in . For the estimation of X-ray absorption by the hidden materials, the X-rays are measured for the reference phantoms with the combinations of acrylic, iodine, and aluminum as shown in . The measured results are shown in .
Table 1 Acrylic, iodine, and aluminum thicknesses used for correction for the hidden materials in the two-dimensional maps based on the electric current ratios
Figure 9 Estimations of the X-ray absorption by the hidden materials: (a) the effect of aluminum on the acrylic–iodine relationship and (b) the effect of iodine on the acrylic–aluminum relationship
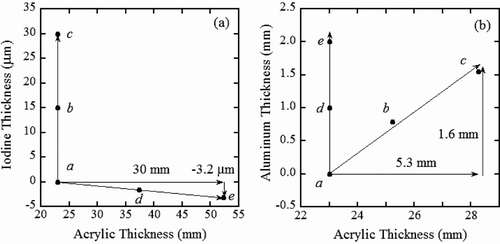
By fitting the reference points “a”, “d ”, and “e” using the least squares method, the effect of X-ray absorption by 2-mm thick aluminum is estimated as an increase in the acrylic thickness of 30 mm and a decrease in the iodine thickness of 3.2 μm in . Also, in , an additional iodine thickness of 30 μm is reflected by increases of 5.3 mm and 1.6 mm in the acrylic and aluminum thicknesses, respectively.
We assume that the thicknesses of the acrylic and the iodine are described by vectors ![]() and
and ![]() , which are independent of each other [Citation9], as shown in . The estimated acrylic and iodine thickness distributions in and are denoted by
, which are independent of each other [Citation9], as shown in . The estimated acrylic and iodine thickness distributions in and are denoted by ![]() and
and ![]() , where P
1(x) and P
2(x) are the thickness distributions of acrylic and iodine, and x indicates the phantom position. Similarly, the acrylic and aluminum thickness distributions in and are denoted by
, where P
1(x) and P
2(x) are the thickness distributions of acrylic and iodine, and x indicates the phantom position. Similarly, the acrylic and aluminum thickness distributions in and are denoted by ![]() and
and ![]() , respectively. Here,
, respectively. Here, ![]() and
and ![]() are the independent vectors.
are the independent vectors.
Based on the estimation of X-ray absorption by the hidden materials described above, the effects of aluminum in and are estimated as ![]() , and the effects of iodine in and are estimated as
, and the effects of iodine in and are estimated as ![]() . Here, the results of 30,000/2000 and −3.2/2000 mean that the increase in the aluminum thickness by 2 mm is reflected in an increase in the acrylic thickness of 30 mm, and a decrease in the iodine thickness of −3.2 μm, respectively. In the same way, the thickness increase of 30 μm of iodine is expressed as increases in the thicknesses of acrylic and aluminum of 5.3 mm and 1.6 mm, respectively, and are written as 5300/30 and 1600/30, respectively. By writing the thickness distributions of acrylic, iodine, and aluminum as A(x), B(x), and C(x), we derive the following equations:
. Here, the results of 30,000/2000 and −3.2/2000 mean that the increase in the aluminum thickness by 2 mm is reflected in an increase in the acrylic thickness of 30 mm, and a decrease in the iodine thickness of −3.2 μm, respectively. In the same way, the thickness increase of 30 μm of iodine is expressed as increases in the thicknesses of acrylic and aluminum of 5.3 mm and 1.6 mm, respectively, and are written as 5300/30 and 1600/30, respectively. By writing the thickness distributions of acrylic, iodine, and aluminum as A(x), B(x), and C(x), we derive the following equations:
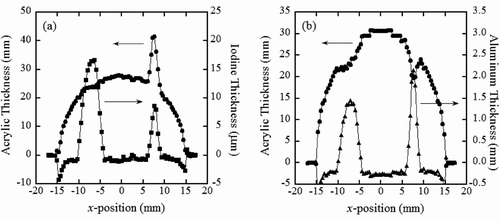
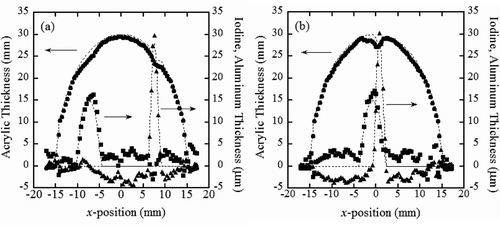
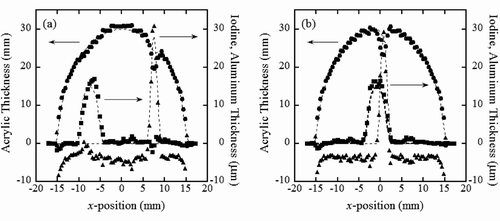
After solving these simultaneous equations, A(x), B(x), and C(x) are obtained as shown in . In the figure, an aluminum thickness of 1 mm is expressed as 15 μm thick iodine for a clear comparison. The dashed lines in the figure show the expected material thickness distributions.
Figure 10 Material thickness distributions obtained from the electric current ratios after correcting for the effects of the hidden materials. Acrylic (circles), iodine (squares), and aluminum (triangles) are shown for (a) 0 degree scan and (b) a 90-degree scan. The dashed lines indicate the expected thickness distributions for each material. An aluminum thickness of 1 mm is expressed as 15 μm thick iodine for a clear comparison
3.2. X-ray event ratio
Based on the measured currents used in Section 3.1, the numbers of X-ray events in the assigned energy ranges can be estimated, according to the basic usage of the transXend detector. In this section, the material thicknesses are estimated from the X-ray event ratios. Four energy ranges are assigned, as shown in . Unfolding is performed via the spectral survey method by using the electric currents measured by the first, second, and third segment detectors; the electric currents measured by the rearmost segment detectors are very small compared with those from the three forward segment detectors and are detrimental to the unfolding process.
Table 2 Energy ranges for unfolding of the X-ray energy distributions
3.2.1. Principle and simulation
When X-rays in the energy range i passed through a material with thickness t, the number of X-rays changes according to the following equation:
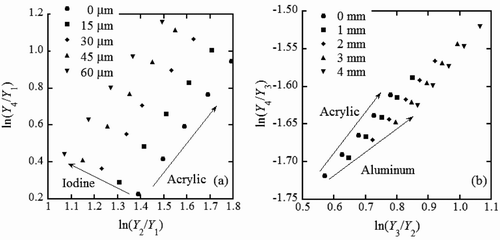
According to the simulation calculations using Birch's formula for the X-ray energy spectra [Citation12], the choices of ln(Y 2/Y 1) and ln(Y 4/Y 1) for the x- and y-axes can make the angle between the acrylic and iodine inclination directions the highest. In the same way, ln(Y 3/Y 2) and ln(Y 4/Y 3) are chosen for the x- and y-axes for the acrylic–aluminum relationship.
The two-dimensional maps obtained from the simulation calculations are shown in and . For the acrylic–iodine relationship, a two-dimensional map with a much greater angle (84.8 degrees) is obtained compared with that formed from the electric current ratios (12.8 degrees) as shown in . However, the angle between the inclination directions of acrylic and aluminum in Figure 11(b) is smaller (9.73 degrees) than the angle shown in (35.1 degrees).
Figure 11 Two-dimensional maps obtained from the calculated X-ray event ratios for (a) acrylic–iodine and (b) acrylic–aluminum relationships. The thicknesses of iodine and aluminum are shown in the figures. Yi (where i = 1,4) is the number of events in the energy range assigned in
When using the electric current ratios to derive the acrylic–aluminum map, the small values of the measured electric currents sometimes fluctuate because of X-ray absorption by filters and the segment detectors. Use of the X-ray event ratio means that these fluctuations can be avoided.
3.2.2. Experimental two-dimensional maps and scan results
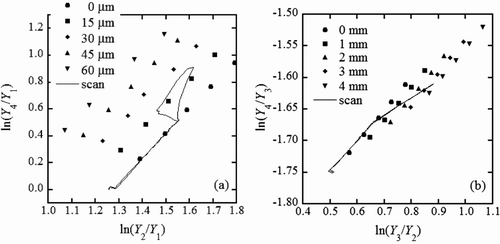
With the same measured electric currents that were used in the analysis of Section 3.1, two-dimensional maps for acrylic–iodine and acrylic–aluminum are obtained based on the X-ray event ratios, which are obtained by the spectrum survey method in the unfolding process, as shown in and . Scan plots for the cylindrical acrylic phantom shown in are also shown in and for 0 and 90 degrees, respectively.
Figure 12 Two-dimensional maps obtained experimentally from the X-ray event ratios (symbols) and the scan results (solid lines) at 0 degrees for (a) acrylic–iodine and (b) acrylic–aluminum relationships
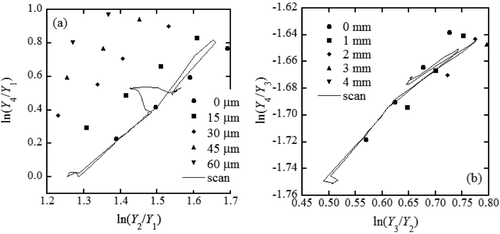
In the acrylic–iodine relationship in the 0 degree scan, the scan moves along the circles before the X-rays pass through the iodine region. When the X-rays pass through the diameter of the iodine region, the scan moves to the point (1.43, 0.529), where the iodine is the thickest. The scan reaches the point (1.56, 0.529) when the X-rays pass through the diameter of the acrylic phantom. After that, the scan reaches the point (1.66, 0.811) when the X-rays pass through the diameter of the aluminum rod. Finally, the scan moves back to the places along the circles, and returns to the starting point.
Similar movement is observed in the acrylic–aluminum relationship map. When the X-rays pass through the diameter of the iodine region, the scan reaches the point (0.742, −1.650). At the center of the acrylic phantom, the scan point is (0.655, −1.671). Then, the scan moves to (0.776, −1.644), where the X-rays penetrate the aluminum rod.
The scans for the acrylic–iodine and acrylic–aluminum distributions at 90 degrees are similar to the cases of . The scans move along the zero iodine or zero aluminum points before X-rays passing through the iodine region and the aluminum rod.
The thickness distributions are shown for the 0 and 90 degree scans in and , respectively. In contrast to , the iodine thickness at +7.5 mm in shows a positive value. For both the acrylic–iodine and acrylic–aluminum thickness distributions, negative values are shown for the positions with zero iodine or aluminum content. Also, the iodine and aluminum thicknesses have relatively large negative values at the peripheries of the acrylic.
3.2.3. Effects of hidden materials
Using the method described in Section 3.1.3, the effects of the hidden materials are estimated by using five reference points, as shown in . The effects of hidden aluminum and iodine are estimated. Simultaneous equations corresponding to those of Equation (Equation3) are then obtained:
Table 3 Acrylic, iodine, and aluminum thicknesses used for correction for the hidden materials in the two-dimensional maps based on the X-ray event ratios
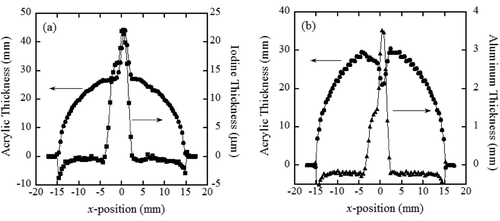
Figure 16 Material thickness distributions obtained from the X-ray event ratios after correcting for the effects of the hidden materials. Acrylic (circles), iodine (squares), and aluminum (triangles) are shown for (a) 0 degree scan and (b) a 90-degree scan. The dashed lines indicate the expected thickness distributions for each material. An aluminum thickness of 1 mm is expressed as 15 μm thick iodine for a clear comparison
3.3. Reconstruction of tomography
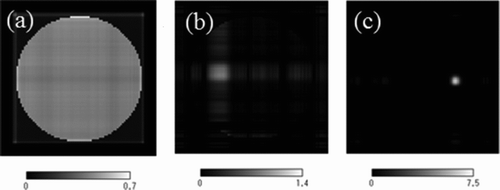
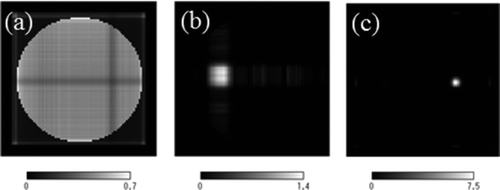
Using the material thickness distributions obtained from the electric current ratios and from the X-ray event ratios, the tomographies of the materials are reconstructed using the ML-EM method. When applying the ML-EM method for material thickness distributions, the negative thicknesses in the distributions shown in and are neglected. The tomographies obtained for the results using electric current ratios and X-ray event ratios are shown in and , respectively.
4. Results and discussion
4.1. Material thickness distributions
In , the expected material thicknesses for acrylic, iodine, and aluminum are indicated by the dashed lines. The estimated acrylic thickness distributions for 0 and 90 degrees deviate slightly at the iodine regions because the mass-attenuation coefficients of water, which filled the iodine region with a little amount of iodine, and acrylic are nearly the same, the acrylic thickness should have smooth distribution at the iodine region. The peaks of the iodine regions are also slightly overestimated. However, the aluminum peaks are in excellent agreement with the expected distributions. In the regions with zero iodine and zero aluminum, the iodine and aluminum thicknesses are over and underestimated, respectively. These positive and negative thicknesses compensate for each other.
The acrylic thickness distributions estimated from the X-ray event ratios in show excellent agreement with the expected thickness distributions, although the acrylic thickness shows a discontinuous distribution because of the response functions with 1 mm thick acrylic steps in the unfolding process. The iodine thickness distributions where the thickness should be zero show good agreement, while the distributions for aluminum show relatively higher negative values.
4.2. Reconstruction of tomography
In tomography reconstruction, a cylindrical shape is given in the imaging algorithm; the method described in this paper gives the thickness distributions of the materials, but not the shapes. The shape is not determined uniquely with only giving the thickness distributions, especially when there are voids inside the subject. In the case where this method is applied to a human being, the surface shape of the subject should be measured with a laser scanner.
For comparison, an image of acrylic is reconstructed by the ML-EM method from the same experimental data that was used in Sections 3.1 and 3.2, but without using the two-dimensional maps. The tomography obtained is shown in .
Figure 19 Tomography of the acrylic phantom obtained by using the electric currents measured by 0- and 90-degree scans. The circular shape of the acrylic is given during the image reconstruction process using the ML-EM method
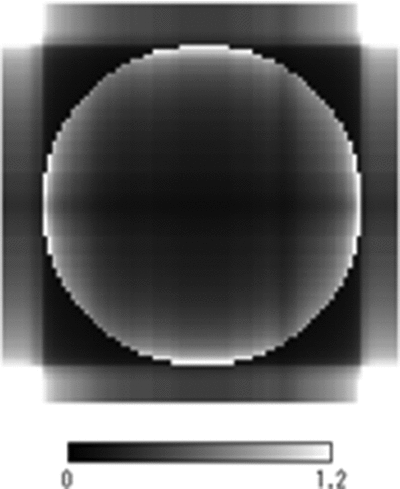
The profiles of are shown in graph form in . The meaning of the y-axis in the profiles of the reconstructed images is not very obvious. The usual CT values obtained from the image that was reconstructed using the X-ray absorption rate signify the averaged absorption coefficient along the line of X-ray passage. In the case of and , the images are reconstructed based on the thickness distributions of the materials. The y-axis must be in some way proportional to the material thickness. The meaning of the y-axis will be one of the topics for future study.
Figure 20 Profiles of the tomographic images of and are shown for (a) acrylic, (b) iodine, and (c) aluminum, as well as (d) the acrylic phantom of . “Event” and “current” in (a)–(c) indicate the profiles obtained from the X-ray event ratios and from the electric current ratios, respectively
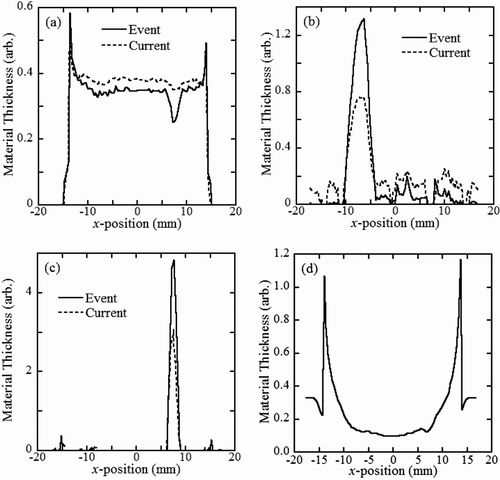
When the two-dimensional maps are not used as shown in , the y-values inside the acrylic are not constant, especially in the peripheral areas of the acrylic, as shown in . The y-values at −7.5 mm and +7.5 mm reflect the X-ray absorption by iodine and aluminum, respectively. In contrast, the y-values of the acrylic obtained from the material thickness distributions in are nearly constant. The area with the aluminum rod has a small value in the tomography, especially in that obtained from the X-ray event ratios.
The iodine region and the aluminum rod in and appeared to be square rather than circular. By increasing the threshold of the display, however, the images become a more circular shape, especially that of the aluminum rod. Finer scanning steps will improve this spatial resolution.
The reasons why the y-axis values obtained from the X-ray event ratios are greater in and 20(c) but smaller at +7.5 mm in are not very obvious. The unfolded X-ray events in the assigned energy ranges may have some kind of correction process when using the spectrum survey method, which chooses the best fitting X-ray energy spectrum relative to the measured electric currents.
4.3. Future studies
The authors’ next topic of study will be the measurement of iodine regions with different effective thicknesses. The proportionality between the effective iodine thickness and the y-axis value of the profile must be examined.
For estimation of the dose exposure, which requires an image of reasonable quality, the phantom image should be reconstructed using transmission measurements from many different directions, e.g., 36 transmission measurements at 5 degree intervals, initially. By reducing the number of measurement directions, the phantom images obtained for each number of transmission measurements should be compared with the original image to find the optimum number of transmission measurements required to produce a compatible image. From this discussion, we will also determine the degree of dose exposure reduction that is possible with this method.
5. Conclusion
In our previous paper, we estimated the thicknesses of known materials in a phantom with a single X-ray transmission measurement. This paper demonstrated the reconstruction of tomographies from two X-ray transmission measurements by using the transXend detector. Both the electric current ratios and the X-ray event ratios, which are obtained by an unfolding process, can be used to form two-dimensional maps, which are equivalent to the response functions of the transXend detector. The thickness distributions obtained using the X-ray event ratios are better than those obtained using the electric current ratios. The usage of X-ray event ratios could serve as a guide for reduction of dose exposure, when photon counting X-ray detectors with high counting rates are developed for CT measurements.
If injection of an iodine contrast agent is allowed or if side effect-free contrast agents such as gold nanoparticles are used in medical health checks, screening diagnoses would be performed with a single transmission measurement. With two transmission measurements, the shape and position of the cancer could be identified based on the method proposed in this paper.
Acknowledgements
This work was supported by a grant-in-aid for Scientific Research from the Japan Society for the Promotion of Science and by the Suzuken Memorial Foundation.
References
- Katayama , H , Yamaguchi , K , Kozuka , T , Takashima , T , Seez , P and Matsuura , K . 1990 . Adverse reactions to ionic and nonionic contrast media. a report from the Japanese committee on the safety of contrast media . Radiology , 175 : 621 – 628 .
- Brooks , R A and Di Chiro , G . 1976 . Beam hardening in x-ray reconstructive tomography . Phys Med Biol. , 21 : 390 – 398 . doi: 10.1088/0031-9155/21/3/004
- Kanno , I , Uesaka , A , Nomiya , S and Onabe , H . 2008 . Energy measurement of x-rays in computed tomography for detecting contrast media . J Nucl Sci Technol. , 45 : 15 – 24 . doi: 10.1080/18811248.2008.9711410
- Shikhaliev , P M . 2008 . Energy-resolved computed tomography: first experimental results . Phys Med Biol. , 53 : 5595 – 5613 . doi: 10.1088/0031-9155/53/20/002
- Taguchi , K , Frey , E , Wang , X , Iwanczyk , J and Barber , W . 2010 . An analytical model of the effects of pulse pileup on the energy spectrum recorded by energy resolved photon counting x-ray detectors . Med Phys. , 37 : 3957 – 3970 . doi: 10.1118/1.3429056
- Kanno , I , Imamura , R , Mikami , K , Uesaka , A , Hashimoto , M , Ohtaka , M , Ara , K , Nomiya , S and Onabe , H . 2008 . A current mode detector for unfolding x-ray energy distribution . J Nucl Sci Technol. , 45 : 1165 – 1170 . doi: 10.1080/18811248.2008.9711905
- Imamura , R , Mikami , M , Minami , Y , Kanno , I , Ohtaka , M , Hashimoto , M , Ara , K and Onabe , H . 2010 . Unfolding method with x-ray path length-dependent response functions for computed tomography using x-ray energy information . J Nucl Sci Technol. , 47 : 1075 – 1082 . doi: 10.1080/18811248.2010.9711672
- Minami , Y , Imamura , R , Kanno , I , Ohtaka , M , Hashimoto , M , Ara , K and Onabe , H . 2011 . Using x-ray energy information in CT measurement of a phantom with an Al region . J Nucl Sci Technol. , 48 : 108 – 112 . doi: 10.1080/18811248.2011.9711684
- Kanno , I , Shimazaki , H , Imamura , R , Yamashita , Y , Shima , K , Ohtaka , M , Hashimoto , M , Ara , K and Onabe , H . 2012 . Low dose exposure diagnosis with a transXend detector aiming for iodine-marked cancer detection . J Nucl Sci Technol. , 49 : 937 – 946 . doi: 10.1080/00223131.2012.712479
- Shepp , L A and Vardi , Y . 1982 . Maximum likelihood reconstruction for emission tomography . IEEE Trans Med Imaging , 1 : 113 – 122 . doi: 10.1109/TMI.1982.4307558
- Naruse , Y and Kobayashi , T . 1982 . Multichannel semiconductor detectors for high energy x-ray and electron beams . Nucl Instrum Methods , 191 : 173 – 175 .
- Birch , R and Marshall , M . 1979 . Computation of bremsstrahlung x-ray spectra and comparison with spectra measured with a Ge(Li) detector . Phys Med Biol. , 24 : 505 – 517 . doi: 10.1088/0031-9155/24/3/002
