Abstract
Lack of local void fraction data in a rod bundle makes it difficult to validate a numerical method for predicting gas–liquid two-phase flow in the bundle. Distributions of local void fraction and bubble velocity in each subchannel in a 4×4 rod bundle were, therefore, measured using a double-sensor conductivity probe. Liquid velocity in the subchannel was also measured using laser Doppler velocimetry (LDV) to obtain relative velocity between bubbles and the liquid phase. The size and pitch of rods were 10 and 12.5 mm, respectively. Air and water at atmospheric pressure and room temperature were used for the gas and liquid phases, respectively. The volume fluxes of gas and liquid phases ranged from 0.06 to 0.15 m/s and from 0.9 to 1.5 m/s, respectively. Experimental results showed that the distributions of void fraction in inner and side subchannels depend not only on lift force acting on bubbles but also on geometrical constraints on bubble dynamics, i.e. the effects of rod walls on bubble shape and rise velocity. The relative velocity between bubbles and the liquid phase in the subchannel forms a non-uniform distribution over the cross-section, and the relative velocity becomes smaller as bubbles approach the wall due to the wall effects.
1. Introduction
Subchannel analysis codes such as NASCA [Citation1], TRAC [Citation2] and RELAP [Citation3] predict a gas–liquid two-phase flow in a rod bundle based on a multi-fluid model. They have been contributing to design and safety analyses of nuclear reactors. Since the code validation is indispensable, many experimental data have been accumulated. Anklam and Miller [Citation4] measured volume-averaged void fractions in an 8×8 rod bundle using pressure transducers. Kamei et al. [Citation5] measured volume-averaged void fractions in a 4×4 rod bundle under a stagnant condition using pressure transducers. Morooka et al. [Citation6] measured area-averaged void fractions in subchannels (subchannel void fractions) using an X-ray scanner system. Kok et al. [Citation7] measured subchannel void distributions in a 6×6 rod bundle using a scanned gamma densitometer. These data have been utilized for validation and improvement of subchannel analysis codes (e.g. [Citation8]).
In accordance with the progress in reactor design, more accurate and reliable simulation codes are to be required, and a multi-dimensional numerical method for predicting two-phase flow in a rod bundle is in great demand when designing fuel assemblies and carrying out safety analyses of a nuclear power plant. Although a framework of the multi-dimensional simulation based on a two-fluid or a multi-fluid model has already been developed [Citation9–11], closure relations are still under development. Void fraction and velocity data of gas–liquid two-phase flows in subchannels are indispensable for validation of predictions and for developing closure relations. However, the validation of the numerical methods is not an easy task due to the lack of detailed experimental data for flows in rod bundles.
In contrast to many experimental data of area-averaged void fractions in a bundle, distributions of local void fraction in subchannels have rarely been reported. Kumamaru et al. [Citation12] measured not only line-averaged void fractions using a gamma densitometer but also local void fractions using an optical probe on the centerline of a simulated pressurized water reactor (PWR) fuel assembly under high-pressure boil-off conditions. Yun et al. [Citation13] measured local void fraction, interfacial area concentration, interfacial velocity and Sauter mean diameter of bubbles in one subchannel in a 3×3 rod bundle by using a double-sensor conductivity probe. The ratio of the pitch to the diameter of rods in their experiment was larger than that of an actual fuel assembly in a PWR. Distributions of local void fraction not only in an inner subchannel but also in side and corner subchannels have been rarely reported for a bubbly flow regime.
Measurements of liquid velocity are also important when modeling the momentum transfer between the two phases. Although there are several experimental data of liquid velocity in single-phase turbulent flows in rod bundles [Citation14,15], few velocity measurements have been carried out for two-phase flow in a rod bundle. The lack of velocity data makes it difficult to understand bubble motion in a rod bundle and to improve numerical methods for two-phase flow in rod bundle.
Distributions of local void fraction and bubble velocity in inner, side and corner subchannels in a 4×4 rod bundle were, therefore, measured using a double-sensor conductivity probe. Liquid velocity in the subchannel was also measured using laser Doppler velocimetry (LDV) to obtain the relative velocity between bubbles and the liquid phase. The motion of bubbles in the rod bundle was discussed based on the experimental results.
2. Experimental apparatus and method
2.1. Experimental apparatus
and show the experimental apparatus and the cross-section of the test section, respectively. Air and tap water at atmospheric pressure and room temperature (298 ± 1 K) were used for the gas and liquid phases. Air supplied from the oil-free compressor was fed to the channel box through a pressure-regulating valve, a flowmeter and a porous circular plate of 10 mm in thickness and 160 mm in diameter by which small bubbles ranging from 1 to 5 mm in sphere-volume equivalent diameter were injected into the lower tank. Water supplied from the pump was introduced to the lower tank through a flow-regulating valve, a flowmeter and four branch pipes which were connected to the four sidewalls of the lower tank, respectively. Uncertainties in measured gas and liquid flow rates at 95% confidence were 2.7% and 4.8%, respectively. The entrance section, the length of which was 300 mm, was located below the test section to reduce asymmetry of the flow.
Figure 1. Experimental apparatus.
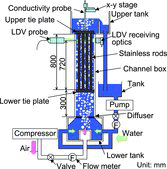
Figure 2. Measurement points.
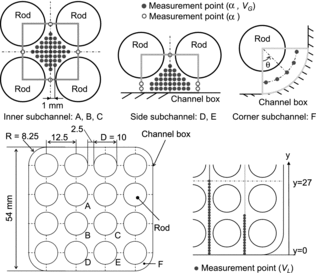
The channel box was made of transparent acrylic resin. Its height, width and corner radius were 1100, 54 and 8.25 mm, respectively. Sixteen rods of 10 mm in outside diameter and 800 mm in length were installed in the channel box in a 4×4 square lattice arrangement with 2.5 mm gap between two adjacent rods. These rods were supported by the upper and lower tie plates (see Appendix). The measurement points were located at 720 mm above the lower tie plate (1020 mm above the inlet of the channel box). An axial distribution of void fraction was measured in the region of 680–750 mm above the lower tie plate in preliminary tests to confirm that the change in void fraction in the axial direction was negligibly small in the region of the present measurement elevation (720 mm above the lower tie plate). The symmetry of the flow was also confirmed through measurements of void fraction and liquid velocity in the preliminary tests. The measurement methods will be described in the next section. The flow area A, wetted perimeter Pe and hydraulic diameter DH of each subchannel and the whole cross-section are summarized in , where DH is defined by
(1)
Table 1. Hydraulic diameters of the rod bundle.
The experimental conditions are summarized in . The area-averaged liquid and gas volume fluxes, JL and JG, were set at 0.9 or 1.5 m/s and 0.06 or 0.15 m/s, respectively, to examine the effects of JL and JG on void distribution. The liquid Reynolds numbers Re (= JLDH/νL, νL: liquid viscosity) were 8100 and 13,500 for JL = 0.9 and 1.5 m/s. The flow pattern was bubbly in all the cases.
Table 2. Experimental condition.
2.2. Measurement method
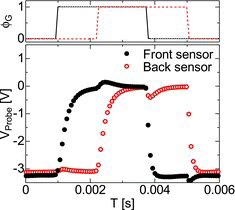
Local void fraction and bubble velocity were measured by using a double-sensor conductivity probe. shows photographs of the tip part of the conductivity probe, which consisted of two electrodes made of platinum wires (diameter 0.1 mm). The probe was immersed in the rod bundle as shown in . It was mounted on an x–y stage (positioning accuracy 0.1 mm) to be traversed in the measurement plane. The tip of the probe was located 720 mm above the lower tie plate. The diameter of the electrode tip was less than 3 μm, and the distance between the two tips was about 0.3 mm in the horizontal direction and 1.5–2 mm in the vertical (axial) direction. shows an example of signals from the conductivity probe. The signals were recorded by a data logger (Yokogawa WE7000). The sampling frequency and sampling time were 10 kHz and 600 sec, respectively. A multiple threshold method [Citation16] was adopted to evaluate the gas-phase definition function φG from the signal. The local void fraction α was calculated as the time-average of φG measured at the front sensor. The velocity VGi of each bubble was calculated by dividing the axial distance between the two tips by the time delay of the phase distribution function φG between the front and back sensors. The bubble chord length Lci of each bubble was calculated as the product of the time duration tGi of the gas phase and VGi. The axial mean velocity VG and the mean code length Lc of bubbles at each measurement point were evaluated by arithmetically averaging VGi and Lci, respectively. The measurements of void fraction were carried out at 45 points in the inner subchannels (A, B, C), 39 points in the side subchannels (D, E) and 5 points in the corner subchannel (F) as shown in . Note that the measurable region in the corner subchannel was restricted due to the narrow flow area at the upper tie plate, through which the conductivity probe was inserted into the test section. Uncertainties in α, VG and Lc at 95% confidence were less than ±2%, ±2% and ±4%, respectively.
Figure 3. Tips of conductivity probe.
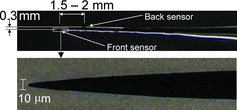
Figure 4. Example of signals from a void probe.
Liquid velocity was measured by using LDV (DANTEC, 60X series, processor: 68N10). Silicon carbide particles (mean diameter 3 μm) were added to water as tracer particles. The scattering light from the particles was received in the forward scattering mode using a receiving optics to reduce receiving refraction lights from bubbles [Citation17]. The LDV probe and the receiving optics were located outside the channel box as shown in . Signal-to-noise ratio (SNR) level and fringe count validations were, respectively, used in the signal processing of the Doppler bursts to reject poor SNR and long burst signals, which were mainly caused by the presence of bubbles. Note that the velocity measured by using the LDV agreed well with that measured by using a submersible LDV which was immersed in a rod to reduce the optical path to the measurement volume [Citation18]. This agreement shows that the effect of bubbles on the measured velocity was negligibly small. The measurements were carried out at 27 points on the centerline of the subchannels (A, B, D) and at 21 points on the centerline of the subchannels (C, E) as shown in the lower right part in . The sample number of the velocity data was 20,000 for each point. The axial mean velocity VL of the liquid phase was evaluated by averaging the measured local instantaneous velocities. Uncertainty in VL at 95% confidence was ±0.5%.
3. Results and discussion
3.1. Void distribution
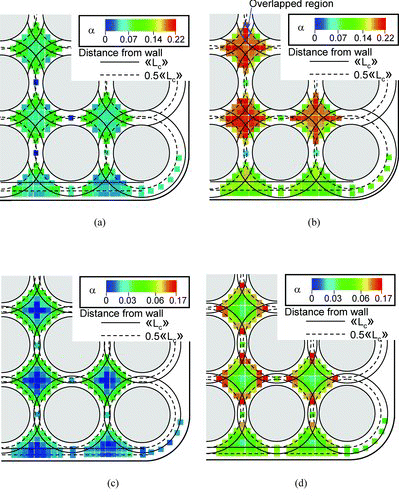
Distributions of measured local mean void fractions are shown in . The void fractions in the side and corner subchannels (D, E, F) take lower values than those in the inner subchannels, whereas the difference in void distributions is not large among the inner subchannels (A, B, C). The distributions in the inner subchannels are wall-peaking in all the cases. High void fractions were observed in the region between the rod gap and the center of the subchannel in Cases 1, 3 and 4, and the void fractions took minimum values at the gaps. This result indicates that bubbles tend to accumulate near the rod surface except for the gap region. Ikeno and Kataoka [Citation11] carried out a numerical prediction of turbulent bubbly flow in a rod bundle and reported that the void distribution in the channel is significantly affected by the secondary flow and bubbles were transported to the channel center by the secondary flow. The present experimental data, however, indicate that the effect of the secondary flow on void distribution is not significant. This might be due to the strong lift force acting on the bubbles toward the rod walls or damping of the secondary flow caused by the presence of the bubbles. Void distributions in the side subchannels are also wall-peaking in Cases 1, 3 and 4, whereas uniform or weak core-peaking void distributions are formed in the side subchannels in Case 2. The void fraction in the corner subchannel is lower than those in the other subchannels.
Figure 5. Void distributions. (a) Case 1: JL = 0.9 m/s, JG = 0.06 m/s; (b) Case 2: JL = 0.9 m/s, JG = 0.15 m/s; (c) Case 3: JL = 1.5 m/s, JG = 0.06 m/s; (d) Case 4: JL = 1.5 m/s, JG = 0.15 m/s.
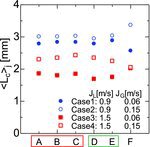
The mean chord length ⟨Lc⟩j of bubbles in subchannel j was calculated using
(2) where n is the number of measurement points in the subchannel j and Nk the number of bubbles per unit time at kth measurement point. The chord length is almost constant over the cross-section as shown in except the corner subchannel (F) in which bubbles are elongated in the axial direction due to the narrow channel width and/or because only small bubbles can enter this subchannel. The chord length increases with JG and decreases as JL increases. Since the chord lengths are less than about 3 mm except the corner subchannel in Case 2, most of the bubbles migrate toward the wall due to the lift force [Citation19]. The solid and dashed lines in indicate the distances, ⟨⟨Lc⟩⟩ and 0.5⟨⟨Lc⟩⟩, from the rod surface. Here, ⟨⟨Lc⟩⟩ is the averaged value of ⟨Lc⟩j over the whole subchannels defined by
(3)
Figure 6. Bubble chord length.
3.2. Bubble and liquid velocities
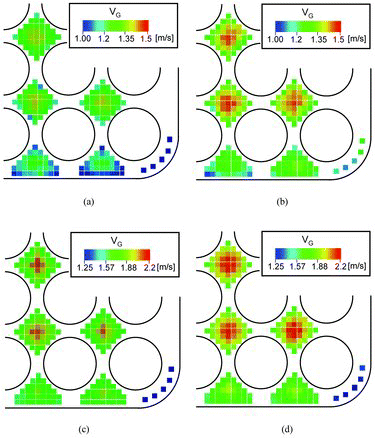
Distributions of measured bubble velocity VG are shown in . The distribution of VG in each subchannel is core-peaking. The magnitudes of VG in the inner subchannels are higher than those in the side and corner subchannels, and VG in the corner subchannel is very low compared with those in the inner subchannels. This might be due to the low liquid velocity, wall effect on bubble velocity and small bubble size in the corner subchannel.
Figure 7. Bubble velocity distributions. (a) Case 1: JL = 0.9 m/s, JG = 0.06 m/s; (b) Case 2: JL = 0.9 m/s, JG = 0.15 m/s; (c) Case 3: JL = 1.5 m/s, JG = 0.06 m/s; (d) Case 4: JL = 1.5 m/s, JG = 0.15 m/s.
shows the gas volume flux JGi in each subchannel, which is calculated from the measured local void fraction and bubble velocity in each subchannel. JGT is the cross-section-averaged gas volume flux calculated from JGi. JGT agrees well with JG, and the differences between JG and JGT are 4%–9%. This means that the local void fraction and bubble velocity were accurately measured by using the conductivity probe. JGi is not constant over the cross-section. It takes higher and lower values than the averaged value JGT in the inner subchannels (A, B, C) and in the side and corner subchannels (D, E, F), respectively. JGi in the corner subchannel is equal to or less than 0.5 JGT. The ratio of JGi to JGT does not depend on flow conditions so much, and the difference in JGi/ JGT among Cases 1–4 is within about ±10%.
Table 3. Gas volume flux in each subchannel.
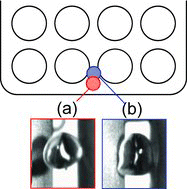
shows the axial mean velocity of the liquid phase and the bubble velocity on the centerlines of subchannels. Both velocities take a peak at the center of each subchannel, and they take lower values near the gaps. The relative velocity between bubbles and the liquid phase is large near the subchannel center, and it decreases as y approaches the gap. The relative velocity at the center of the inner subchannel is 0.15–0.20 m/s, which is close to the terminal velocity of single bubbles in a rod bundle [Citation23]. On the other hand, the bubble velocity decreases to the liquid velocity as bubbles approach the gap. This might be due to the wall effect on bubble velocity. shows shapes of bubbles in the side subchannel in Case 1. The bubble locating near the rod wall ((b)) is elongated in the axial direction due to the presence of wall and the lift force directing toward the wall. Thus, its aspect ratio is larger than that of bubble locating near the center of the side subchannel ((a)). Tomiyama et al. [Citation24,25] pointed out that bubble shape affects its terminal velocity VT and proposed the following theoretical correlation:
(4)
Figure 8. Bubble and liquid velocities in the centerlines of subchannels.
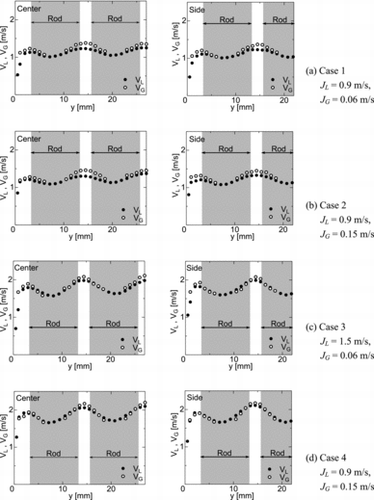
Figure 9. Bubble shapes (Case 1: JL = 0.9 m/s, JG = 0.06 m/s).
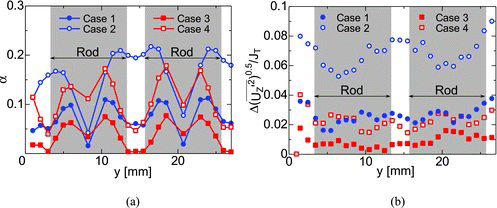
shows the axial turbulence intensity of the liquid phase along the centerline of subchannels (A, B, D). shows the void fraction and the difference in the axial turbulence intensity between the single-phase and bubbly flows normalized by the area-averaged total volume flux (turbulence modification). The axial turbulent intensity increases with JG due to bubble-induced pseudo-turbulence. The dependence of the turbulence modification on the local void fraction is not strong, and turbulence augmentation occurs even for the location at which the void fraction is almost zero. This implies that the turbulence modification is not directly correlated with the void fraction, and therefore, Sato's model [Citation26] for bubble-induced pseudo-turbulence may fail in the evaluation of turbulence properties in bubbly flow in a rod bundle. The turbulence augmentation at low JL (Cases 1 and 2) is stronger than that at high JL (Cases 3 and 4) as Hosokawa and Tomiyama [Citation27] pointed out for turbulent bubbly pipe flow. The maximum turbulence augmentation (the difference in turbulence intensity between single-phase and bubbly flows) does not exceed the terminal velocity of bubbles (0.15–0.2 m/s). This is because the main cause of turbulence augmentation is the relative velocity between the two phases [Citation18].
Figure 10. Axial turbulence intensities of liquid phase. (a) JL = 0.9 m/s; (b) JL = 1.5 m/s.
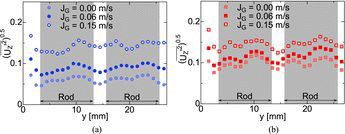
Figure 11. Void fraction and turbulence modification: (a) void fraction; (b) turbulence modification.
4. Conclusion
Distributions of local void fraction and bubble velocity in each subchannel in a 4×4 rod bundle were measured using a double-sensor conductivity probe. Liquid velocity in the subchannel was also measured using LDV to obtain relative velocity between bubbles and the liquid phase. The size and pitch of rods were 10 and 12.5 mm, respectively. Air and water at atmospheric pressure and room temperature were used for the gas and liquid phases, respectively. The volume fluxes of the gas and liquid phases ranged from 0.06 to 0.15 m/s and from 0.9 to 1.5 m/s, respectively. Experimental results showed that the distributions of void fraction in inner and side subchannels depend not only on the lift force acting on bubbles but also on geometrical constraints on bubble positions. The latter cannot be taken into account by a standard multi-fluid model, which, in turn, implies the advantage of a multi-fluid model based on a conservation equation of bubble number density proposed by one of the authors. The relative velocity between bubbles and the liquid phase in the subchannel form a non-uniform distribution over the cross-section, and the relative velocity becomes lower as bubbles approach the wall due to the wall effects. This reduction in the velocity is well explained by a drag model proposed by Tomiyama et al. [Citation23,24]. The dependence of the turbulence modification due to bubbles on the local void fraction is not strong, and turbulence augmentation occurs even for the location at which the void fraction is low.
Nomenclature
| A | = | Flow area (m2) |
| DH | = | Hydraulic diameter (m) |
| J | = | Volume flux (m/s) |
| L | = | Distance from rod surface (m) |
| Lc | = | Mean chord length of bubbles (m) |
| ⟨Lc⟩j | = | Bubble chord length averaged in a subchannel j (m) |
| ⟨⟨Lc⟩⟩ | = | Bubble chord length averaged in whole subchannels (m) |
| Pe | = | Wetted perimeter (m) |
| Re | = | Reynolds number |
| V | = | Axial mean velocity (m/s) |
| x, y, z | = | Axes in Cartesian coordinate (m) |
| α | = | Void fraction |
| φ | = | Phase distribution function |
| ν | = | Kinematic viscosity (m2/s) |
| ρ | = | Density (kg/m3) |
Subscript
| G | = | Gas |
| i | = | Subchannel number |
| L | = | Liquid |
| T | = | Total |
Acknowledgements
The authors gratefully acknowledge Mr Yuya Muramatsu for his efforts in the experiments.
Additional information
Funding
Related Research Data
References
- Ninokata H, Aritomi M, Anegawa T, Sato Y, Sadatomi M, Mishima K, Nishida K, Yamamoto Y, Morooka S, Yabushita Y, Sou A, Kamo H, Kusuno S. Development of the NASCA code for prediction of transient BT and post BT phenomena in BWR rod bundles. Proceedings of the 4th International Seminar on Subchannel Analysis; 1997; Tokyo, Japan. p. 231–265.
- Spore JW, Elson JS, Jolly-Woodruff SJ, Knight TD, Lin, J-C, Nelson RA, Pasamehmetoglu KO, Steinke RG, Unal C, Mahaffy JH, Murray C. TRAC-M/FORTRAN 90 (Version 3.0) theory manual ( LA-UR-00-910). Los Alamos (NM): Los Alamos National Laboratory; 2000.
- The RELAP5 Development Team. RELAP5/MOD3 code manual, Volumes 1 and 2. Pocatello (ID): Idaho National Engineering Laboratory; 1995.
- Anklam TM, Miller RF. Void fraction under high pressure, low flow conditions in rod bundle geometry. Nucl Eng Des. 1985;75:99–108.
- Kamei A, Hosokawa S, Tomiyama A, Kinoshita I, Murase M. Void fraction in a four by four rod bundle under a stagnant condition. J Power Energy Syst. 2010;4:315–326.
- Morooka S, Ishizuka T, Iizuka M, Yoshimura K. Experimental study on void fraction in a simulated BWR fuel assembly (evaluation of cross-sectional averaged void fraction). Nucl Eng Des. 1989;114:91–98.
- Kok HV, van der Hagen THJJ, Mudde RF. Subchannel void-fraction measurements in a 6×6 rod bundle using a simple gamma-transmission method. Int J Multiphase Flow. 2001;27:147–170.
- Mitsutake T, Morooka S, Suzuki K, Tsunoyama S, Yoshimura K. Void fraction estimation within rod bundles based on three-fluid model and comparison with X-Ray CT void data. Nucl Eng Des. 1990;120:203–212.
- Tomiyama A, Sakoda K, Hayashi K, Sou A, Shimada N, Hosokawa S. Modeling and hybrid simulation of bubbly flow. Multiphase Sci Technol. 2006;18(1):73–110.
- Krepper E, Koncar B, Egorov Y. CFD modelling of subcooled boiling – concept, validation and application to fuel assembly design. Nucl Eng Des. 2007;237:716–731.
- Ikeno T, Kataoka I. Numerical simulation of secondary flow in bubbly turbulent flow in sub-channel. Nucl Eng Des. 2011;241:4568–4574.
- Kumamaru H, Kondo M, Murata H, Kukita Y. Void-fraction distribution under high-pressure boil-off conditions in rod bundle geometry. Nucl Eng Des. 1994;150:95–105.
- Yun BJ, Park G.C. Julia E, Hibiki T. Flow structure of subcooled boiling water flow in a subchannel of 3×3 rod bundles.J Nucl Sci Technol. 2008;45:402–422.
- Hosokawa S, Yamamoto T, Okajima J, Tomiyama A. Measurements of turbulent flows in a 2×2 rod bundle. Nucl Eng Des. 2012;249:2–13.
- Rowe D, Johnson B, Knudsen JG. Implications concerning rod bundle crossflow mixing based on measurements of turbulent flow structure.Int J Heat Mass Transfer. 1974;17:407–419.
- Zun I, Filipic B, Perpar M, Bombac A. Phase distribution in void fraction measurements via genetic algorithms. Rev Sci Instrum. 1995;66:5055–5064.
- Iguchi M, Kondoh T, Uemura T. Simultaneous measurement of liquid and bubble velocities in a cylindrical bath subject to centric bottom gas injection. Int J Mutiphase Flow. 1994;20:753–762.
- Hosokawa S, Mikihara I, Tomiyama A. Development of a submersible small fiber LDV probe and its application to flows in a 4×4 rod bundle. Nucl Eng Des. 2013;263:342–349.
- Tomiyama A, Tamai H, Zun I, Hosokawa S. Transverse migration of single bubble in simple shear flow. Chem Eng Sci. 2002;57:1849–1858.
- Ueda T. Gas-liquid two phase flow – flow and heat transfer. Tokyo: Yokendo; 1981.
- Hosokawa S, Tomiyama A. Multi-fluid simulation of turbulent bubbly pipe flow. Chem Eng Sci. 2009;64:5308–5318.
- Hayashi K, Hosokawa S, Tomiyama A. Numerical simulation of bubbly flows in a 4×4 rod bundle using a multi-fluid model. Proceedings of the 15thInternational Topical Meeting on Nuclear Reactor Thermal-Hydraulics (NURETH-15); 2013 May 12–17; Pisa, Italy.
- Tomiyama A, Nakahara Y, Adachi Y, Hosokawa S. Shape and rising velocity of single bubbles rising through an inner subchannel. J Nucl Sci Technol. 2003;40:136–142.
- Tomiyama A, Celata GP, Hosokawa S, Yoshida S. Terminal velocity of single bubbles in surface tension force dominant regime. Int J Multiphase Flow. 2002;28(9):1497–1519.
- Tomiyama A. Drag, lift and virtual mass forces acting on a single bubble. Proceedings of the 3rd International Symposium on Two-Phase Flow Modelling and Experimentation; 2004 September 22–24; Pisa, Italy. Accompanied by: CD-ROM.
- Sato Y, Sekoguchi K. Liquid velocity distribution in two-phase bubble flow. Int J Multiphase Flow. 1975;2:79–95.
- Hosokawa S, Tomiyama A. Turbulence modification in gas-liquid and solid liquid dispersed two-phase flows. Int J Heat Fluid Flow. 2004;25:489–498.
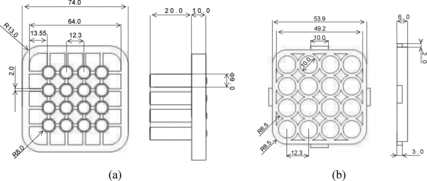
Appendix
Figure A1. Lower and upper tie plates. (a) Lower tie plate (unit: mm); (b) upper tie plate (unit: mm).