
Abstract
Numerical simulations of bubbly flows in a four by four rod bundle are carried out using a multi-fluid model to examine effects of the numerical treatment of phase distribution and drag model. The transport equations of bubble number density and void fraction are used as the continuity equation of the gas phase. Two drag models are tested: one of them accounts for the bubble deformation (aspect ratio), whereas the other does not. The rod diameter, the rod pitch and the hydraulic diameter of the rod bundle are 10, 12.5 and 9.1 mm, respectively. The gas and liquid volume fluxes are JG = 0.06 m/s and JL = 0.9 and 1.5 m/s, respectively. The bubble diameter ranges from 1 to 5 mm. Comparisons between the numerical and measured data show that (1) the restriction on bubble lateral motion due to the presence of rods can be taken into account by using the transport equation of bubble number density, whereas that of the void fraction cannot deal with the restriction and causes large errors in the distribution of void fraction and (2) the reduction in the bubble-relative velocity near the wall is predictable by using the drag model accounting for the bubble deformation effect.
1. Introduction
Numerical methods for simulating two-phase flows in rod bundles of nuclear power reactors play an important role in designing fuel assemblies and evaluating the safety of nuclear power plants. Although multi-dimensional simulations of flows in a rod bundle have been carried out [Citation1–8], their validation is still a difficult task due to the lack of detailed experimental data such as distributions of void fraction and velocities. In our previous study [Citation9], we therefore carried out experiments on air–water bubbly flows in a four by four rod bundle to obtain experimental data applicable to the validation of the numerical methods. The experiments showed that the presence of rod walls restricts the motion of bubbles near the walls and affects the bubble shape. The sphere–volume equivalent bubble diameter, d, observed in the experiments ranged from 1 to 5 mm. These bubbles moved from the center of a subchannel toward the rod wall due to a shear-induced lift force [Citation10]. The bubbles in the near wall region changed from oblate spheroidal to spherical shape due to the wall effect and mainly accumulated in the region d/2 away from the rod surface. Bubbles were apt to take distorted prolate spheroidal shape in the gap between the rods. The bubble relative velocities in the near wall and gap regions were smaller than those in the subchannel center region. This implies that the drag force increases as the bubble shape changes from oblate to prolate spheroids.
Since these wall effects on bubble shape, bubble lateral motion and bubble velocity have not been taken into account in multi-fluid models, they may fail in predicting the above-mentioned experimental facts.
Most of the incompressible multi-fluid models use the volume conservation of the gas phase for the continuity equation to predict the time evolution of the phase distribution. When the bubble size is larger than the computational cell size, the volume fractions in several cells surrounding the center of the bubble are non-zero though the bubble center is not located in these cells. Therefore, the interfacial momentum transfer, such as the drag and lift forces, in the momentum conservation equation must be modeled as forces acting on the volume fraction in each cell. However, in available constitutive equations, it has been modeled as forces acting on the bubble center. Hence the volume conservation and momentum conservation equations are inconsistent with the models of forces acting on the bubble center [Citation11]. Tomiyama et al. [Citation11] demonstrated that this inconsistency causes large errors in multi-fluid simulations. They also pointed out that since the forces act on the bubble center, they must be used to calculate not the gas phase-averaged velocity but the bubble velocity and the bubble velocity should be used to transport the bubble number density. They therefore proposed to use the transport equation of the bubble number density as the continuity equation of the gas phase, instead of the volume conservation equation, to recover the consistency. In their method, the shape of a bubble larger than the cell size is taken into account using a scalar function, which is called the shape factor. The use of this method would enable us not only to recover the consistency but also to account for the bubble shape deformation and the restriction of bubble lateral motion near the rod walls.
Tomiyama et al. [Citation12,13] pointed out that the bubble aspect ratio plays an important role in the bubble velocity and proposed a drag model as a function of the bubble aspect ratio. This drag model was applied to single bubbles rising through stagnant water in a two by two rod bundle, and the estimation agreed well with their experimental data [Citation14]. The velocity reduction in the near wall region observed in our recent experiments [Citation9] might therefore be predicted by making use of this drag model.
In this study, numerical simulations of bubbly flows in the four by four rod bundle were carried out using a multi-fluid model utilizing the transport equation of the bubble number density and the drag model accounting for bubble deformation effect to numerically examine the above expectations. Distributions of liquid and gas velocities and void fraction of air–water bubbly flows obtained in the previous experimental study [Citation9] were used for comparison with predictions.
2. Numerical method
2.1. Field equations
The gas and liquid are assumed isothermal incompressible fluids. Bubbles are classified into N classes of different bubble diameters. The continuity equations of the liquid and gas phases are given by
(1)
(2) where α is the volume fraction, V is the velocity, t is the time and the subscripts L and G denote the liquid and gas phases, respectively, and m represents the bubble class, m = 1, 2, …, N. The volume fractions satisfy
(3) The momentum equations of the liquid and gas phases are given by
(4)
(5) where ρ is the density, P is the pressure, g is the acceleration of gravity, τ is the viscous stress tensor, τRe is the Reynolds stress tensor, and M is the interfacial momentum transfer. The viscous stress tensor is given by
(6) where μ is the viscosity. The momentum transfer, M, consists of the drag, MD, lift, ML, virtual mass, MV, turbulence dispersion, MT, and wall forces, MW, i.e.
(7)
2.2. Time evolution of phase distribution
Most of the incompressible multi-fluid models use the volume conservation of the gas phase as the continuity equation and solve Equation (2) to obtain the time evolution of phase distribution. Hereafter this conventional method is referred to as the α-based method. Tomiyama et al. [Citation11] suggested that the transport equation of the bubble number density, nG, should be used instead of Equation (2) when dealing with bubbles larger than computational cell sizes. Substituting αG = nGθB, where θB is the bubble volume, into Equation (2) yields
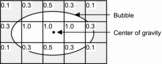
(8) To deal with bubbles larger than the computational cell size, the shape factor, f, which is a scalar function representing a fraction of the bubble volume included in each computational cell as shown in , is introduced. The volume fraction in a cell, IJK, required for computing M is calculated by summing up the contribution from the surrounding cells:
(9)
Figure 1. Shape factor.
2.3. Restriction on bubble lateral motion due to rod and channel walls
2.3.1. Wall force in α-based method
The following wall force [Citation15] is utilized in the α-based method to account for the geometrical restriction to the bubble lateral motion due to the presence of rod and channel walls:
(10) where CW is the wall force coefficient, L is the distance from the wall, De is the hydraulic equivalent diameter of a subchannel, tW is the unit tangent to the wall, and nW is the unit normal to the wall. The following correlation (Hosokawa & Tomiyama [Citation16]) is used for CW:
(11)
where Re, Eo and M are the bubble Reynolds number, Eötvös number and Morton number defined by
(12)
(13)
(14) where g is the magnitude of g, σ is the surface tension and Δρ = ρL − ρG.
2.3.2. Geometrical restriction on bubble motion in n-based method
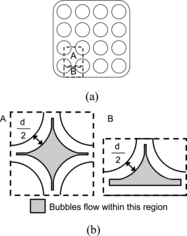
In the n-based method, the geometrical restriction to the bubble lateral motion due to the presence of rod and channel walls can be accounted for by preventing the migration of bubbles into the near wall region [Citation17]. shows areas, in which the bubble center can lie, i.e. nG > 0, in inner and side subchannels. Fluxes of nG through the boundary between the shaded and white regions are forced to be zero, which ensures that nG = 0 in the white (near wall) region throughout a simulation. Since bubbles near the rod wall were apt to be spherical [Citation9], the minimum distance between the wall and the bubble center is set at d/2. Bubbles in the gap region took distorted prolate shapes and the maximum aspect ratio was 1.35, where the aspect ratio E is the ratio of the maximum vertical dimension to the maximum horizontal dimension of a bubble. Hence the minimum distance between the wall and the bubble center in the gap is set at the half of the minor axis of the bubble of the maximum aspect ratio, E = 1.35.
Figure 2. Restriction of bubble lateral motion in n-based method. (a) channel box and (b) inner and side subchannels.
2.4. Drag model
The drag force is given by
(15) where CD is the drag coefficient. The following drag correlation [Citation18] has been often used in bubbly flow simulations [Citation19,20]:
(16) It should be noted that this correlation was originally developed for single bubbles rising through infinite stagnant liquids. The shapes of bubbles in the rod bundle, however, differ from those in the infinite liquid due to the wall effect. Therefore, Equation (16) would not be appropriate for bubbles in rod bundles.
In contrast to drag models without the bubble aspect ratio, drag models accounting for the effects ofbubble aspect ratio have been rarely proposed [Citation12,13,Citation21,22]. A drag model proposed by Tomiyama et al. [Citation12,13] takes into account the effects of the bubble aspect ratio on the drag force:
(17)
where F and G are functions of E given by
(18)
(19) Though this model was also proposed for free-rising bubbles, its applicability to single bubbles in a rod bundle has been confirmed [Citation14]. Hence, Equation (17) can be utilized to account for the wall effect on drag force by substituting an appropriate value of E.
The drag multiplier, 1 + 0.55Sr2, which accounts for the effect of liquid velocity gradient about a bubble [Citation23], is applied to CD, where Sr is the dimensionless shear rate defined by
(20) where ω is the magnitude of the liquid velocity gradient. The effect of bubble swarm is also taken into account by making use of the multiplier αG3−2φ to CD, where φ = 1.75 [Citation24].
2.5. Other closure relations
The lift force is given by
(21) where CL is the lift coefficient. The following CL correlation proposed by Tomiyama et al. [Citation10] is used:
(22) where EoH is the Eötvös number using the maximum horizontal dimension of a bubble as the characteristic length, i.e. EoHm = ΔρLgam2/σ and am = dmEm−1/3. Lucas and Tomiyama [Citation25] investigated the applicability of the above correlation to various bubbly flows and confirmed that it is applicable not only to air–water bubbly flows but also to vapor–water bubbly flows at high pressures.
The virtual mass force is given by
(23) where CV is the virtual mass coefficient and is given as a function of the aspect ratio [Citation13,Citation26]:
(24) The turbulence dispersion force is given by [Citation27]
(25) where CT is the turbulence dispersion coefficient. Since there are no available correlations of CT for bubbles in rod bundles, the value of CT was optimized by trial and error and is given in Section 2.6. The turbulence kinetic energy, kL, of the liquid phase is given as a superposition of the shear- and bubble-induced turbulence kinetic energies, kSI and kBI:
(26) The shear-induced turbulence kinetic energy is calculated using an anisotropic k–ϵ model (SZL model: Shih–Zhu–Lumley model) proposed by Shih et al. [Citation28]. The bubble-induced energy is given by [Citation29]
(27)
The Reynolds stress tensor is modeled as a superposition of the shear- and bubble-induced turbulence stresses [Citation30]:
(28) The shear-induced Reynolds stress is calculated by using the SZL model. The bubble-induced turbulence stress is evaluated as
(29) where the first and second terms are based on the Sato's model [Citation30] and the Lopez de Bertodano's anisotropic model [Citation29], respectively, and ABI is the anisotropy matrix given by
(30)
2.6. Numerical condition
The computational domain is shown in . Due to the symmetry of the flow [Citation9], the one-fourth of the four by four rod bundle was simulated. The Cartesian coordinates were used and the cell widths, Δx, Δy and Δz, in the x, y and z directions were 0.25, 0.25 and 0.75 mm, respectively. The number of cells assigned to the x, y and z directions were 108, 108 and 10, respectively. The rod diameter and pitch were 10 and 12.5 mm. The number of cells assigned to the rod diameter was therefore 40. As shown in the Appendix, we confirmed in our preliminary study that a good enough prediction for a single-phase flow in a rod bundle is obtained by using the Cartesian coordinates and this spatial resolution. The rod and channel box were simulated by imposing the no-slip condition to cells locating at their walls. The top and bottom boundaries were periodic. The time step, Δt, was 7.5×10⁻⁵ s. The solution algorithm can be found in [Citation11]. The fluid properties of gas and liquid phases were those of air and water at room temperature and atmospheric pressure as in the experiments [Citation9].
Figure 3. Computational domain.
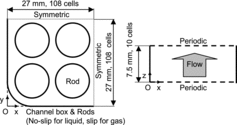
Four cases, S1, S2, T1 and T2, were tested. Cases S1 and S2 were single-phase flows of JL = 0.9 and 1.5 m/s, respectively. Cases T1 and T2 were two-phase bubbly flows at (JL, JG) = (0.9, 0.06 m/s) and (1.5, 0.06 m/s), respectively, where JL and JG are the liquid and gas volume fluxes.
In view of the experimental data [Citation9], bubbles were classified into four classes (N = 4), whose diameters were 1.4, 2.2, 3.2 and 4.2 mm, respectively. The values of CT for these bubble classes are given in .
Table 1. Turbulent dispersion coefficient CT.
The bubble shapes in the four by four rod bundle were also measured in [Citation9]. Bubbles near the rod wall were apt to be spherical, E = 1, whereas E > 1 for bubbles in the gap due to the strong wall effect. Tomiyama et al. [Citation14] measured the aspect ratios of bubbles in a two by two rod bundle and showed that E ≈ 0.75 for bubbles in the center of the subchannel. The aspect ratio was therefore given by the following interpolation function:
(31)
3. Results and discussion
3.1. Liquid velocity in single phase flow
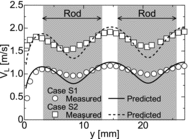
The numerical method was first validated for single-phase flows in the rod bundle. Predicted liquid velocities along the y-axis at x = 27 mm in Cases S1 and S2 are compared with the measured data [Citation9] in . Although some errors appear in the gap regions, the predictions are reasonable. The root-mean-square (rms) errors defined by
(32)
Figure 4. Streamwise liquid velocity in single-phase flows (x = 27 mm).
3.2. Effects of numerical treatment of phase distribution
The measured void fraction in Case T1 is shown in (a). As described in Section 1, bubbles are apt to migrate from the subchannel center to the wall due to the lift force. The void fraction therefore increases from the center of an inner subchannel (y ≈ 14 and 27 mm) toward the rod. Since bubbles rarely enter into the gap region and they do not stay in the gap due to cross flows between subchannels, the void fractions in the gap regions (y ≈ 8 and 21 mm) are very low. Predicted α with the α-based method is compared with the measured data in the figure. Equation (17) was used for CD in this simulation. The predicted void fraction in the inner subchannel is too low and the low void fraction in the gap is not reproduced. This is because the wall repulsive force cannot prevent the migration of bubbles toward the rod gap due to the lift force. To the contrary, the prediction with the n-based method qualitatively agrees with the measured data and the low void fraction in the gap is well reproduced, which implies that the geometrical restriction of the bubble lateral motion works well.
Figure 5. Void fraction and liquid and gas velocities in Case T1 (x = 27 mm). (a) Void fraction and (b) Liquid and bubble-relative velocities.
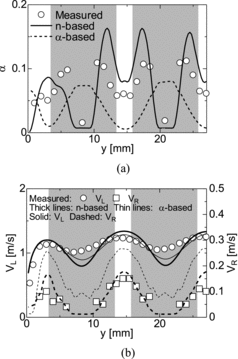
The measured and predicted VL and the bubble-relative velocity, VR ( = VG − VL), are compared in (b). The prediction of VL with the α-based method seems better than that with the n-based method. However the α-based method gives large errors in VR in the whole domain, so that the prediction of VR with the n-based method is much more reasonable.
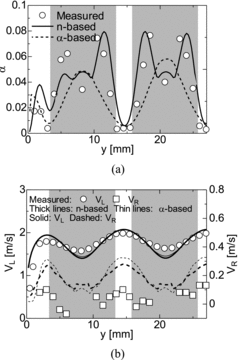
As shown in , the differences between the predictions of the α- and n-based methods are not so remarkable in Case T2 compared to those in Case T1. The volume fractions in the near wall and the gap regions are however better predicted with the n-based method than with the α-based method. The root-mean-square errors in the above predictions of α, VL and VR are summarized in .
Table 2. Root mean square errors erms in predicted α, VL and VR.
Figure 6. Void fraction and liquid and gas velocities in Case T2 (x = 27 mm). (a) Void fraction and (b) Liquid and bubble-relative velocities.
The measured area-averaged void fraction in the corner subchannel was 0.030 in Case T1 and those predicted using the n- and α-based methods were 0.030 and 0.105, respectively. These results imply that the geometrical constraint in the n-based method works well in the corner subchannel. However, in Case T2, both predictions of the n- and α-based methods, i.e. 0.0551 and 0.0696, largely differed from the measured value of 0.016. More precise treatment for the wall effect on the bubble aspect ratio may be required for more accurate predictions.
3.3. Effects of drag model
Simulations of Cases T1 and T2 are carried out using the n-based method with the drag models, Equations (16) and (17), to examine the effects of CD models. The differences between the two models are not large in the predicted α in Case T1. However the bubble-relative velocity obtained using Equation (16) shows large errors as shown in (a). Bubbles in the rod bundle are apt to be more spherical or prolate spheroidal compared to those in infinite liquids. According to Tomiyama et al. [Citation12,13], the bubble rise velocity decreases with increasing E. Therefore the bubbles in the rod bundle are slower than those in infinite liquids. Since the CD model without E cannot account for this effect, it gives small CD for bubbles in the rod bundle. This is the main reason why VR predicted with this model is higher than the measured data. The CD model, Equation (17), with E gives better predictions.
Figure 7. Effects of CD model on VR (n-based) (x = 27 mm). (a) Case T1 and (b) Case T2.
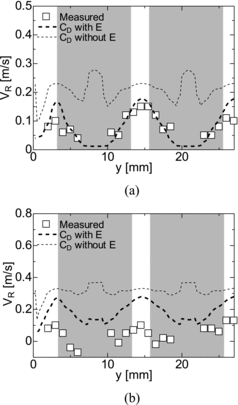
As shown in (b), the predictions with Equation (16) in Case T2 also show larger errors in VR than those with Equation (17) due to the same reason.
The above discussion has made clear that the transport equation of the bubble number density and the drag model accounting for bubble deformation should be used to obtain reasonable predictions for bubbly flows in a rod bundle; otherwise the simulation fails in predicting the bubble motion especially in the near wall regions. Although the present experimental and numerical conditions differed from those in actual rod bundles, i.e. the present flows were the adiabatic air–water bubbly flows at relatively low liquid velocities, the above-mentioned fact is of great importance when predicting bubbly flows in rod bundles.
4. Conclusion
Hosokawa et al. [Citation9] measured distributions of void fraction and gas and liquid velocities in a four by four rod bundle to provide a database for validation of numerical methods. The experiments showed that the presence of rod walls restricts the motion of bubbles near the wall, which strongly affects the distribution of void fraction. Bubble shapes are apt to change from oblate to distorted prolate spheroidal as bubbles approach the rod wall or the rod gap, which results in the reduction of bubble-relative velocity. It was expected that the former and latter effects can be predicted using a multi-fluid model based on the transport equation of the bubble number density [Citation11] and a drag model accounting for the bubble deformation effect [Citation12,13], respectively. In this study, numerical simulations of bubbly flows in the four by four rod bundle were therefore carried out using a multi-fluid model to numerically examine the above expectation. The main conclusions obtained from comparisons between the numerical and measured data are as follows.
The geometrical restriction on bubble motion due to the rods can be taken into account by using the transport equation of the bubble number density, whereas that of the void fraction cannot account for the restriction and causes large errors in a predicted distribution of void fraction.
The reduction in the bubble-relative velocity near the wall is predictable by using the drag model accounting for the bubble deformation effect.
It is therefore recommended to use the transport equation of the bubble number density as the continuity equation of the gas phase and the drag model accounting for the bubble deformation effect in simulations based on multi-fluid models. A question, however, arises as to how we should model the aspect ratio of bubbles in a rod bundle, especially for largely deformed bubbles in the gap region. Modeling the wall effect on bubble shape would be an important issue to obtain more accurate predictions of bubbly flows in rod bundles.
Nomenclature
| ABI: | = | anisotropy matrix |
| CD: | = | drag coefficient |
| CL: | = | lift coefficient |
| CT: | = | turbulence dispersion coefficient |
| CV: | = | virtual mass coefficient |
| CW: | = | wall force coefficient |
| d: | = | sphere-volume equivalent bubble diameter [m] |
| De: | = | hydraulic equivalent diameter of subchannel [m] |
| erms: | = | root mean square error |
| E: | = | aspect ratio |
| Eo: | = | Eötvös number |
| EoH: | = | Eötvös number defined using bubble major axis |
| f: | = | shape factor |
| F, G: | = | functions of E |
| g: | = | acceleration of gravity (m/s2) |
| g: | = | magnitude of g (m/s2) |
| h: | = | function of EoH |
| JG: | = | gas volume flux (m/s) |
| JL: | = | liquid volume flux (m/s) |
| k: | = | turbulence kinetic energy (m2/s2) |
| L: | = | distance from channel wall (m) |
| M: | = | interfacial momentum transfer (N/m3) |
| MD: | = | drag force (N/m3) |
| ML: | = | lift force (N/m3) |
| MV: | = | virtual mass force (N/m3) |
| MT: | = | turbulent dispersion force (N/m3) |
| MW: | = | wall force (N/m3) |
| n: | = | bubble number density (m−3) |
| N: | = | Total number of bubble classes |
| nW: | = | unit normal to wall |
| P: | = | pressure (Pa) |
| Re: | = | bubble Reynolds number |
| Sr: | = | dimensionless shear rate |
| t: | = | time (s) |
| tW: | = | unit tangent to wall |
| V: | = | velocity (m/s) |
| x, y, z: | = | Cartesian coordinates (m) |
| α: | = | void fraction |
| Δt: | = | time [s] |
| Δρ: | = | density difference (Δρ = ρL − ρG) (kg/m3) |
| Δx, Δy, Δz: | = | cell size in the x, y and z directions (m) |
| θ: | = | cell volume (m3) |
| θB: | = | bubble volume (m3) |
| μ: | = | viscosity (Pa·s) |
| τ: | = | viscous stress tensor (Pa) |
| τRe: | = | Reynolds stress tensor (Pa) |
| ρ: | = | density (kg/m3) |
| σ: | = | surface tension (N/m) |
| φ: | = | model constant for bubble swarm effect on drag force |
| ω: | = | magnitude of liquid velocity gradient (s−1) |
| Subscripts | = | |
| G: | = | gas phase |
| L: | = | liquid phase |
| m: | = | mth bubble class |
| Superscripts | = | |
| SI: | = | shear-induced |
| BI: | = | bubble-induced |
| m: | = | measured data |
| p: | = | predicted data |
Acknowledgements
The authors would like to express their sincere thanks to Mr Yuya Muramatsu for his effort in the experiments and numerical simulations.
Additional information
Funding
References
- Anglart H, Nylund O. CFD application to prediction of void distribution in two-phase bubbly flows in rod bundles. Nucl Eng Des. 1996;163:81–98.
- Anglart H, Ji W, Gu CY. Numerical simulation of multidimensional two-phase boiling flow in rod bundles. Proceedings of the 8th International Topical Meeting on Nuclear Reactor Thermal-Hydraulics (NURETH-8); 1997; Kyoto (Japan), 3:1647–1655.
- Baglietto E, Ninokata H. A turbulence model study for simulating flow inside tight lattice rod bundles. Nucl Eng Des. 2005;235:773–784.
- Anglart H. Thermal-hydraulic design of nuclear fuel assemblies - current needs and challenges. Proceedings of the Workshop on Modelling and Measurements of Two-Phase Flows and Heat Transfer in Nuclear Fuel Assemblies; 2006; Stockholm (Sweden).
- Höhne T, Krepper E, Rohde U. Application of CFD codes in nuclear reactor safety analysis. Sci Technol Nucl Installations. 2010;2010; 198758.
- Shin BS, Chang SH. CHF experiment and CFD analysis in a 2×3 rod bundle with mixing vane. Nucl Eng Des. 2009;239:899–912.
- Mohitpour M, Jahanfarnia G, Shams M. An advancement in iterative solution schemes for three-dimensional, two-fluid modeling of two-phase flow in PWR fuel bundles. Ann Nucl Energy. 2014;63:83–99.
- Hashemi-Tilehnoee M, Rahgoshay M. Sub-channel analysis of 8×8 and 9×9 BWR fuel assemblies with different two-phase flow models. Ann Nucl Energy. 2013;62:264–268.
- Hosokawa S, Hayashi K, Tomiyama A. Void distribution and bubble motion in bubbly flows in a 4×4 rod bundle. Part I: experiments. J Nucl Sci Technol. 2014;51(2):220–230.
- Tomiyama A, Tamai H, Zun I, Hosokawa S. Transverse migration of single bubbles in simple shear flows. Chem Eng Sci. 2002;57(11):1849–1858.
- Tomiyama A, Sakoda K, Hayashi K, Shimada N, Sou A, Hosokawa S. Modeling and hybrid simulation of bubbly flow. Multiphase Sci Technol. 2006;18(1):73–110.
- Tomiyama A, Celata GP, Hosokawa S, Yoshida S. Terminal velocity of single bubbles in surface tension force dominant regime. Int J Multiphase Flow. 2002;28(9):1497–1519.
- Tomiyama A. Drag, lift and virtual mass forces acting on a single bubble. Proceedings of the Third International Symposium on Two-Phase Flow Modelling and Experimentation, 2004; CD-ROM.
- Tomiyama A, Nakahara Y, Adachi Y, Hosokawa S. Shape and rising velocities of single bubbles rising through an inner subchannel. J Nucl Sci Technol. 2003;40(3):136–142.
- Tomiyama A, Sou A, Zun I, Kanami N, Sakaguchi T. Effects of Eötvös number and dimensionless liquid volumetric flux on lateral motion of a bubble in a laminar duct flow. In: Serizawa A, Fukano T, Bataille J, editors. Advance Multiphase Flow. Amsterdam: Elsevier; 1995; p. 3–16.
- Hosokawa S, Tomiyama A. Lateral force acting on a deformed single bubble due to the presence of wall. Trans JSME, Ser. B. 2003;69(686):2214–2220.
- Hosokawa S, Tomiyama A. Multi-fluid simulation of turbulent bubbly pipe flows. Chem Eng Sci. 2009;64:5308–5318.
- Tomiyama A, Kataoka I, Zun I, Sakaguchi T. Drag coefficient of single bubbles under normal and micro gravity conditions. JSME Int J, Ser. B. 1998;41(2):472–479.
- Lo S, Osman J. CFD modeling of boiling flow in PSBT 5×5 bundle. Sci Technol Nucl Installations. 2012;2012: 795935.
- Jain D, Lau Y-M, Kuipers JAM, Deen NG. Discrete bubble modeling for a micro-structured bubble column. Chem Eng Sci. 2013;100:496–505.
- Moore EW. The velocity rise of distorted gas bubbles in a liquid of small viscosity. J Fluid Mech. 1965;23:749–766.
- Loth E. Quasi-steady shape and drag of deformable bubbles and drops. Int J Multiphase Flow. 2008;34:523–546.
- Legendre D, Magnaudet J. The lift force on a spherical bubble in a viscous linear shear flow. J Fluid Mech. 1998;368:81–126.
- Tomiyama A, Kataoka I, Fukuda T, Sakaguchi T. Drag coefficients of bubbles: 2nd report, drag coefficient for a swarm of bubbles and its applicability to transient flow. Trans JSME, Ser. B. 1995;61(588):2810–2817.
- Lucas D, Tomiyama A. On the role of the lateral lift force in poly-dispersed bubbly flows. Int J Multiphase Flow. 2011;37(9):1178–1190.
- Lamb H. Hydrodynamics. 6th ed. London: Cambridge University Press; 1932.
- Drew D, Lahey RT Jr.. The virtual mass and lift forces on a sphere in a rotating and straining flow. Int J Multiphase Flow. 1987;13:113–121.
- Shih T-H, Zhu J, Lumley JL. A realizable Reynolds stress algebraic equation model. (NASA Technical Memorandum 105993). Cleveland (OH): NASA Lewis Research Center; 1993.
- Lopez de Bertodano MA, Lahey RT, Jones OC. Phase distribution in bubbly two-phase flow in vertical ducts. Int J Multiphase Flow. 1994;20(5):805–818.
- Sato Y, Sekoguchi K. Liquid velocity distribution in two-phase bubbly flow. Int J Multiphase Flow. 1975;2:79–95.
- Hayashi K, Kurimoto R, Tomiyama A. Interface tracking simulation of drops rising through liquids in a vertical pipe using three coordinate systems. J Comput Multiphase Flows. 2010;2(1):47–58.
- Hosokawa S, Yamamoto T, Okajima J, Tomiyama A. Measurements of turbulent flows in a 2×2 rod bundle. Nucl Eng Des. 2012;249:2–13.
Appendix
Curvilinear coordinates can precisely deal with the rod wall. They however often suffer from the skewness and elongation of computational cells and the numerical treatments for the closure relations of interfacial momentum transfer are to be complicated in curvilinear coordinates. Cartesian coordinates could therefore be a better choice, provided that the jaggy boundary representation for rod walls does not deteriorate predictions.
Effects of coordinate systems and spatial resolutions on the predicted motion of single drops in vertical round tubes were investigated using three different coordinate systems, i.e. boundary-fitted, cylindrical and Cartesian coordinate systems, in our previous study [Citation31]. The results confirmed that the Cartesian coordinate can give good enough predictions for Taylor drops that form thin liquid films between the drop and the pipe wall even with only 12 cubic cells along the pipe diameter.
Effects of Cartesian coordinates on a prediction of a flow in a rod bundle were also preliminary examined. Hosokawa et al. [Citation32] simulated a single-phase flow in a two by two rod bundle by using a boundary-fitted coordinate method implemented in OpenFOAM. The horizontal cross-section of the rod bundle is shown in (a). Since the flow was symmetric, the computational domain was one-fourth of the whole flow domain. The area-averaged liquid velocity was 2.0 m/s. The boundary-fitted coordinate system used in [Citation32] is shown in (b), in which the number of computational cells in the horizontal plane is 8000.
Figure A1. Simulation of single-phase flow in two by two rod bundle. (a) two by two rod bundle (flow is symmetric with respect to dotted-lines), (b) boundary-fitted cells and (c) predicted streamwise liquid velocities at x = 25 mm.
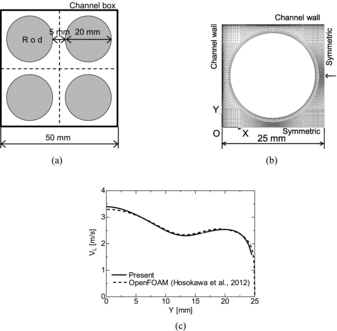
The domain was discretized using uniform cubic cells in our preliminary study. The spatial resolution was the same as in the simulation of the four by four rod bundle, i.e. 40 computational cells along the rod diameter. The number of cells in the fluid region was only about 3/20 of that in the boundary-fitted coordinate simulation. Predicted streamwise liquid velocities are shown in (c). In spite of the lower spatial resolution, the prediction with the Cartesian coordinates agrees well with the prediction of boundary-fitted coordinates. Therefore, with the spatial resolution of 40 cells along the rod diameter, the effects of jaggy boundary representation for rod walls are sufficiently small for the prediction to converge to that with the boundary-fitted coordinates.