Abstract
A calculation system for the estimation of decontamination effects (CDE) is developed in the present work to aid in the effective planning of decontamination procedures. This system calculates dose rate distribution before and after decontamination according to the distribution of radioactivity and the decontamination factor. A dose rate reduction factor is also used to estimate decontamination effects. Results obtained from CDE were compared with measurements and particle and heavy-ion transport code system (PHITS) simulations. The CDE successfully reproduced the measured and calculated dose rate distributions, requiring less than several seconds of calculation time.
1. Introduction
An earthquake with a magnitude of 9.0 on the moment-magnitude scale, designated as “the 2011 Off the Pacific Coast of Tohoku Earthquake,” struck Japan on 11 March 2011. An extremely severe accident measuring Level 7 on the International Nuclear and Radiological Event Scale occurred at the Fukushima Daiichi Nuclear Power Station (hereafter referred to as Fukushima I NPS) of Tokyo Electric Power Co. owing to the earthquake and subsequent tsunami. As a result of this nuclear accident, a significant amount of radionuclides was discharged into the environment. The Japanese government established restricted areas within a 20 km radius from the Fukushima I NPS as well as areas of deliberate evacuation which are located further than 20 km from the NPS but in which the annual cumulative dose is expected to reach 20 mSv, in order to protect residents from exposure to radiation [Citation1]. These areas have since been rearranged, reflecting the confirmation of safety and reassurance of residents from the effects of radioactive materials [Citation2]. Therefore, it is essential to reduce radiation dose to acceptable levels that will allow lifting the restrictions and allow evacuees to return to their homes. The decontamination of the contaminated environment is one of the most imperative tasks that we should tackle.
In a previous work [Citation3], the authors showed that a sufficient reduction of dose cannot be achieved at one site, such as a school yard, an orchard, or a house, by clearing contamination only from that specific site. Decontamination must be performed in the vicinity of a site because the dose rate at that site may be affected by gamma rays arriving from distant places due to their long flight path in air. Gamma rays with energies of several hundred kilo-electron volts propagate about 100 m in air without interactions. This fact implies that the clearing of unexpected places is necessary in order to reduce the dose rate at a target site to a satisfactory level. Decontamination procedures that lack a rational plan will not only fail to lower the dose rate but will also lead to a waste in budget and labor. It is very important to make accurate predictions of decontamination effects using computer simulations, which serve as a planning tool that can be used prior to the start of work.
Computer software dedicated to decontamination planning should be easy to operate, require relatively short run time, and produce accurate and reliable results. While Monte Carlo particle transport codes used in various scientific fields such as nuclear physics, medicine, and radiation protection provide accurate results, these codes require a high level of technical knowledge and significant computational resources to implement calculations. Hence, it is not realistic to apply Monte Carlo particle transport codes to the investigation of decontamination plans by residents or the staff of local governments. The computer software described in the present work was developed by taking into account these considerations, and so should meet the demands of a decontamination-planning tool.
Calculation system for the estimation of decontamination effects (CDE) was developed to support the establishment of an effective decontamination plan [Citation4]. The method in the system calculates the dose rate distribution before and after decontamination and evaluates decontamination effects through a user-friendly interface. By changing the values of various decontamination parameters, the effects of different scenarios can be investigated within a short period of time and users can determine an optimal decontamination strategy. CDE has been distributed from the website [Citation5] of the Japan Atomic Energy Agency (JAEA) to registered users, free of charge, as open source software.
The present paper describes the computational characteristics of the CDE along with its concept, the interface, the calculation method, and the data-sets employed in calculations. Verification and validation are performed by comparing results of calculations with those obtained using a Monte Carlo particle transport code PHITS [Citation6] and with measurements [Citation7] from a contaminated area. An example of decontamination planning by CDE is demonstrated for an area that was used for a governmental decontamination project. In addition, the state of CDE usage, such as the number of the registered users and their distribution in Japan, is also summarized in the last part of this paper.
2. An overview of CDE
CDE is designed to estimate decontamination effects easily, quickly, and accurately that is also accessible by non-experts in computer science. The software has the following features: (1) CDE runs on the popular spreadsheet application Microsoft® Excel®, (2) it has a user-friendly graphical user interface (GUI), (3) input information that is needed for a calculation can be easily prepared, (4) calculation of a single case is rapid and only takes several seconds, (5) calculation results can be visualized, and (6) the software has good predictive power equivalent to that of existing Monte Carlo particle transport codes. These features provide users with the advantage of establishing a rational decontamination plan without requiring them to know technical details.
The software is programmed in Microsoft® Visual Basic® for Applications, except the dose calculation section, which is written in Fortran90 in order to improve calculation speed. Basic functions, such as saving and copying input data and parameters, are provided in Excel®. Thus, the operation of the CDE is made easy for users who are familiar with Excel®. The application requires the Microsoft® Windows® XP operating system or higher, in which Microsoft® Excel® 2007 or higher is installed.
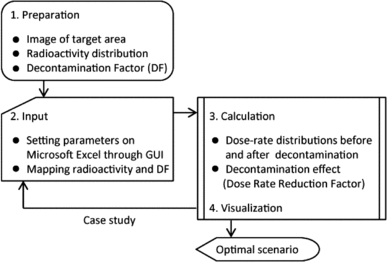
shows a flow chart for decontamination planning using CDE. An image of the target area, such as an aerial photograph or a topographical map, is required prior to the calculation. Those images can be acquired from Internet services [Citation8,9] following the acceptance of service agreements. In addition, it is necessary to obtain data on the distribution of radioactivity and the decontamination factor (DF). DF is defined as the ratio of the initial specific radioactivity to the specific radioactivity after decontamination, expressed as
(1)
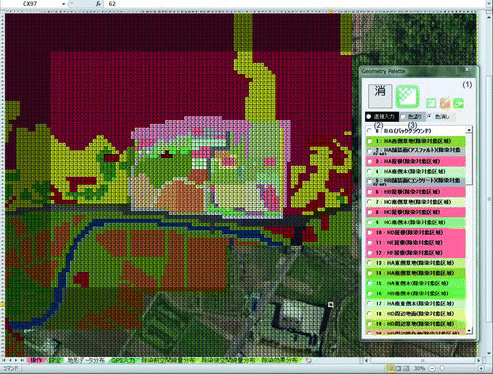
depicts an example of the CDE input sheet. At present, the GUI is available only in Japanese. The dimensions of a section of the mesh dividing the target area can be set as 5 m × 5 m, 10 m × 10 m, 15 m × 15 m, or 20 m × 20 m, depending on the desired resolution. Larger meshes facilitate map construction, but the reproducibility of geographical features is compromised. The dates on which the radioactivity was measured and the dose rate is predicted must be provided by the user because CDE calculates dose rates by considering the radioactive decay of the source nuclides. The radioactivity data are linked to DFs that represent the decontamination technique for radioactivity removal. The ID number and ID color are also assigned according to the combination of radioactivity and DF. shows an interface to input radioactivity data and DF to the section of the mesh established on the image of the target area. The ID numbers and ID colors are listed in a panel as exhibited in . The users select the ID color from the panel and paint the mesh sections with the color using a mouse. With this operation, the distribution map of radioactivity and DF is constructed, as depicted in . This process takes 2–4 h depending upon the complexity of the geographical features of the target area. However, the map can be reused in a case study by changing the parameters in the input sheet.
Figure 2. Input sheet used to enter calculation parameters. (1) The dimensions of a section of the mesh (pull-down menu), (2) the date when the radioactivity was measured and the date when the dose rate is evaluated, (3) the ID color, (4) the check box to set whether a location is flat or sloped, (5) the comments for the zone, (6) the radioactivity, (7) the decontamination technique (pull-down menu), (8) the decontamination factor, (9) the thickness of the covering soil.
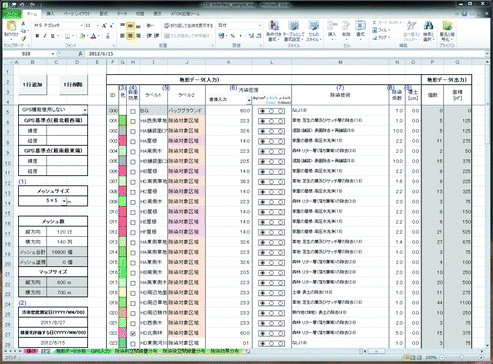
Figure 3. Map sheet showing the distribution of radioactivity and DF. (1) Panel listing ID colors defined in the input sheet, (2) the ID number, and (3) the comments for the ID.
CDE outputs dose rate distribution before and after decontamination and the dose rate reduction factor (DRRF). The dose rate is given as the ambient dose equivalent rate H*(10) at a height of 100 cm above ground level. The DRRF indicates the decontamination effect and is defined as follows:
(2) where DBefore and DAfter are the dose rates before and after decontamination, respectively. All calculated results are visualized on an image of the target area with a color map. Based on CDE output, users can decide whether or not the current parameter settings allow achieving the dose reduction required for decontamination. If the necessary dose reduction cannot be achieved, a case study is continued by changing the DF or extending the target area until a desirable result is obtained. Finally, a rational plan based on an optimal scenario is suggested by CDE.
In addition, CDE has some unique functions. (1) Some radiation monitors use a global positioning system to store dose rates along with the longitude and the latitude of the measurement site. CDE utilizes these data for the automatic generation of a map that shows the distribution of radioactivity in the target area. (2) If the radionuclides that are deposited on the ground are covered with soil, the dose rate above ground level weakens. CDE can calculate the dose reduction by a shielding source if the thickness of the covering soil is provided as part of the input data. (3) The areas for each geographic zone, where the same decontamination technique is applied, are deduced from the number and the size of the mesh sections. This approach is very useful for assessing the yield of radioactive waste and the cost of the decontamination.
3. Methods
3.1. Response matrix
For quick and accurate calculations, CDE utilizes a precompiled database of dose contributions from a source region to the surroundings. The database is normalized to the radioactivity per unit area and is called the response matrix. Dose rates are calculated using the response matrix according to the distribution maps of radioactivity and DFs.
The response matrix was evaluated using photon transport simulations with PHITS to include three-dimensional particle transport phenomena such as sky-shine and ground-shine. The photo-atomic data library MCPLIB04 [Citation13] was utilized in the transport process. The statistical uncertainty regarding Monte Carlo simulations was set to be below 10%. The simulation geometry is modeled as a right circular cylinder containing layers of air and soil with a smooth interfacial surface. The cylinder radius is 1000 m, and the thickness values of the air and soil layers are 1000 and 1 m, respectively. gives the density and elemental composition of air and soil regions. The values were taken from Ref. [Citation14]. We employed the thick-target bremsstrahlung approximation [Citation15] for the generation of electron-induced photons, while secondary electrons were not transported in this simulation geometry.
Table 1. Density and elemental composition of air and soil [Citation14].
The source nuclides are radioactive cesium isotopes,134Cs and 137Cs, which widely spread into the environment following the accident and represent a concern with respect to long-term exposure due to their relatively long half-lives. Physical properties of 134Cs and 137Cs are summarized in [Citation16]. Note that the 137Cs data include contributions from metastable 137mBa in radioactive equilibrium. A source of 134Cs or 137Cs, which emits radiation isotropically and is distributed uniformly within the 5 m × 5 m domain, was located at a depth of 0, 5, or 50 cm in the soil. As noted later, the response matrix for any source depth up to 50 cm is readily computed from the matrices of a series of plane sources at different depths.
Table 2. Half-lives, energies, and yields of photons emitted in nuclear decays of 134Cs and 137Cs [Citation16]. Note that 137Cs data include contributions from the metastable state 137mBa in radioactive equilibrium.
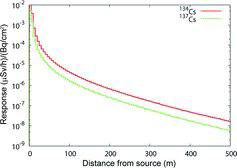
The dose contributions were calculated for a square region of 1005 m × 1005 m that was centered on the source and segmented into 5 m × 5 m sections. Note that the dose here stands for the ambient dose equivalent H*(10) at a height of 100 cm. presents the response matrices of 134Cs and 137Cs distributed on the ground. The horizontal axis indicates the distance from the source region. As the distance increases, the dose contributions decrease exponentially. Since the calculated value for a 5 m × 5 m section corresponds to the value of one matrix element, the whole matrix is constructed with 201 × 201 elements. We have confirmed that the size of the matrix is sufficient to consider the contribution of dose even to distant places [Citation3]. The response matrices are maintained by CDE in the form of Excel® spreadsheets.
3.2. Dose-rate and DRRF calculation
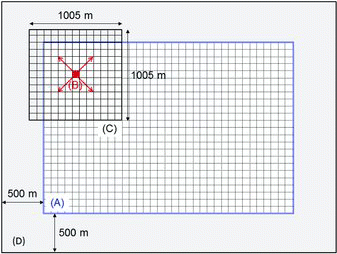
The dose rate distribution before decontamination is calculated using the response matrix and radioactivity distribution. The procedure for calculating the dose rate distribution is explained in . In the figure, an area enclosed by a double line indicated by the letter (A) is the target decontamination area. A square mesh is established on the target area, and radioactivity data are entered for each section of the mesh. We focus on one section of the mesh as indicated by the letter (B) in as an example. By multiplying the radioactivity for the section (B) by the response matrix, the dose contribution corresponding to the size of the matrix, i.e. 1005 m × 1005 m, is determined by centering on the section as depicted in with the letter (C). The same operation is applied to other sections of the mesh inside the target area. In addition, an area adjacent to the target area that extends up to 500 m from the boundary of the target area, as indicated by the letter (D) in , is defined as the area with a background radioactivity entered in the corresponding input fields. Dose contributions from area (D) to each of the mesh sections inside the target area (A) are calculated. The map of dose rate distribution at the target area is then obtained by summing up the dose contributions calculated for all mesh sections.
Figure 5. Schematic of the areas treated in the dose rate calculation by CDE. (A) Target area for calculating dose rate distribution, (B) one section of the mesh established on the target area, (C) the region considering the dose contribution from the source nuclides in section (B), and (D) area considering the dose contribution to the target area from background radiation.
The distribution of radioactivity after decontamination is reconstructed using the following equation:
(3) where AAfter and ABefore are radioactivity values at one section of the mesh after and before decontamination, respectively, and DF indicates the DF that applies to the section. The dose rate distribution after decontamination is then calculated in the same manner as described above. The DRRF is derived from Equation (2) given the dose rates before and after decontamination. Larger values of DRRF correspond to a more effective dose reduction as a result of decontamination.
Note that the calculation time of the CDE is independent of the size of a mesh section selected in the input sheet. Although a coarser mesh is set on the target area, the dose rates are calculated in 5 m × 5 m steps, which is equivalent to the size of one element of the response matrix. For instance, if a size of 10 m × 10 m is selected and radioactivity of 100 Bq/cm2 is assigned to one section, CDE calculates the dose rate by dividing the mesh section into four segments, each of which has a size of 5 m × 5 m and the radioactivity is 100 Bq/cm2. The dose rate for the coarse mesh section is given by the arithmetic mean of the results calculated for the 5 m × 5 m segments.
3.3. Dose contribution from steep slope
While CDE assumes a flat distribution of radioactive nuclides, there are slopes in the actual landscape of decontamination areas that are located in mountain regions. The dose contribution from a steep slope becomes larger than that from flat ground. Hence, CDE provides an option to set a flag for each ID to denote whether a particular area has a slope or not. The algorithm can then correct for the effect of slope.
The relationship between dose contribution and the angle of a slope was investigated using the PHITS. shows the simulation geometry (upper) and the distribution of sources (lower). An isotropic plane source of 137Cs was placed on the surface of the slope. The area of the source region was set to 5 m × 5 m for a flat surface (0°), and changed depending on the angle. Note that the total radioactivity of those sources was kept constant at any angle. shows the ratio of dose rates at 10°, 20°, 30°, and 40° to that at 0°. The horizontal axis indicates the distance from the source region along the direction of the slope front. The dose contributions increase as the angle increases. The maximal enhancement of dose contribution from a slope is about 1.2, and occurs for an angle of 40° (which corresponds to a very steep slope).
Figure 6. Cross-sectional view of simulation geometry (upper) and source distribution (lower). θ indicates the angle of the slope.
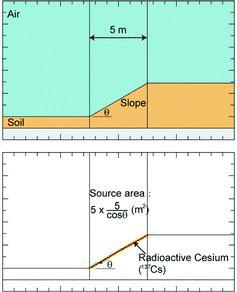
Figure 7. The ratio of dose contribution from slope sources (10°, 20°, 30°, and 40°) to that from a flat source (0°).
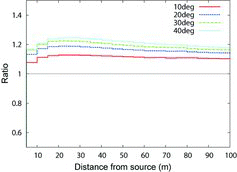
The estimate discussed above corresponds to the front direction of a slope. Results will vary for side and back directions. In addition, users are required to perform a complicated input process in order to set the direction of a slope in a map. Therefore, we decided that dose contributions from a slope to the surrounding mesh sections within a radius of 10 m should be scaled by a factor of 1.2, irrespective of the direction. While the dose rate at one location is affected by photons from areas up to 500 m away, a large portion of dose rate is dominated by the contributions from nearby locations. The present assumption is supported by the quickly decaying curve shown in .
3.4. Dose reduction by covering with soil
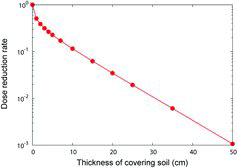
As we have already mentioned in previous work [Citation3], the dose rate in air can be reduced by covering the radioactive nuclides with soil. demonstrates the relationship between the rate of dose reduction and the thickness of covering soil, which was obtained from the PHITS simulations for a semi-infinite plane source of 137Cs under the covering soil and scored the dose rate at a height of 100 cm above the top surface of the covering soil. One can see that the dose rate decreases as the thickness is increased, and for the 50 cm thick covering soil the dose rate drops to 1/1000 of the value that is obtained when no covering soil is present.
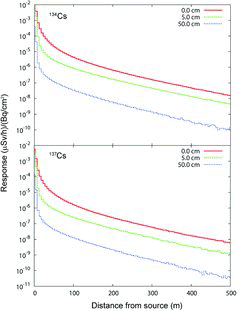
CDE can treat the attenuation of dose by the covering soil. The thickness of the covering soil is given in the input sheet for each ID. The default value is 0 cm and the maximal thickness is 50 cm. shows the response matrices of 134Cs and 137Cs obtained at depths of 0, 5, and 50 cm, which are built into CDE. A response matrix at any depth of up to 50 cm is computed at run time by logarithmic interpolation of built-in matrices. The dose rates that originate from a source under the ground are then calculated using the response matrix with the same method as that described in Section 3.2.
3.5. Radioactivity of 134Cs and 137Cs
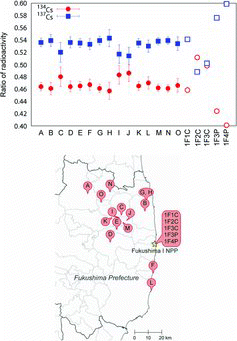
In the input sheet of CDE, numerical radioactivity data are entered as the total radioactivity of 134Cs and 137Cs. However, dose rate should be calculated separately for each nuclide using the radioactivity and response matrices, because physical properties such as half-life and photon energy are different for 134Cs and 137Cs. shows the ratios of 134Cs and 137Cs radioactivity to the total radioactivity during the day of the earthquake (11 March 2011). The ratios were deduced from the soil monitoring data [Citation17,18], mainly by May 2011, for locations around the Fukushima I NPS depicted in the lower panel of . We also plotted the calculated results [Citation19] obtained using the Oak Ridge isotope generation and depletion code (ORIGEN2) [Citation20,21] for the reactor cores (1F1C, 1F2C and 1F3C) and for fuel storage pools (1F3P and 1F4P) of Fukushima I NPS, denoted by open marks in the upper panel. The ratios, after being averaged over the measured data, were 0.467 and 0.533 for 134Cs and 137Cs, respectively, and agreed with the results of calculations obtained by ORIGEN2 within 20%. Based on this analysis, we assumed that the radioactivity of 134Cs was equal to that of 137Cs on the day when radionuclides were discharged into the environment.
Figure 10. The ratio of 134Cs and 137Cs radioactivity to the total radioactivity (upper panel), and the locations at which these data were obtained (lower panel). The open marks in the upper panel are the results calculated by using ORIGEN2.
To take the radioactive decay of 134Cs and 137Cs into consideration for dose calculations, CDE must be provided with the dates on which the total radioactivity was measured and the dose rate is evaluated. The radioactivity on the day of the accident is estimated using the following equation:
(4) where A0134 and A0137 are the initial radioactivity levels of 134Cs and 137Cs on the day of the accident, respectively, A is the total radioactivity on the measurement date, TM is the elapsed time from the accident to the measurement, λ134 and λ137 indicate the decay constants derived from the half-lives of 134Cs and 137Cs, T134 and T137, respectively. Using the initial radioactivity, the radioactivity on the date of dose rate evaluation is derived as
(5)
where A′134 and A′137 are the radioactivity levels of 134Cs and 137Cs on the date of evaluation, respectively, and TE indicates the elapsed time from the accident to evaluation. The dose rate on the date of evaluation is then calculated using the radioactivity that is given in Equation (5) and using the response matrices for each nuclide.
3.6. Conversion from dose rate to radioactivity
Data on radioactivity distribution, which is expressed in surface concentration of contamination (Bq/cm2), are indispensable for the dose rate calculation based on the response matrix. However, owing to the restrictions in manpower, time, and equipment, it is not practical for workers performing decontamination to measure radioactivity. As already mentioned, CDE provides an alternative approach to estimate radioactivity. In this approach, the ambient dose equivalent rate H*(10) (μSv/h) at a height of 1 or 100 cm above ground, which is measurable with a conventional survey meter, is converted to a surface concentration of contamination. lists the conversion factors, D134 and D137, for 134Cs and 137Cs, respectively. These factors were evaluated using the PHITS by assuming a semi-infinite plane source set on a top surface of the ground with size 1005 m × 1005 m. While the actual distribution has a difference in concentration, we employed a uniform distribution in the evaluation of conversion factors to make the problem simple. Using D134 and D137, the surface concentration of contamination is deduced from the ambient dose equivalent rate, considering the radioactive decay of 134Cs and 137Cs, as follows:
(6)
Table 3. Conversion factors between ambient dose equivalent rate (μSv/h) at a height of 1 and 100 cm above ground and surface concentrations of contamination (Bq/cm2) of 134Cs and 137Cs.
4. Verification and validation
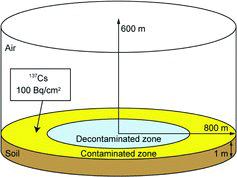
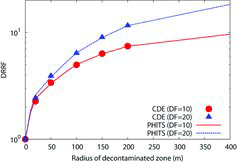
The calculation method that was developed for CDE was verified through a comparison with the results of the previous work [Citation3] that made use of PHITS calculations. depicts a schematic of the geometry that was used in these calculations. The radius of the cylinder that modeled the environment was set to 800 m, and the thickness values of the air and soil layers connected with a smooth interface were 600 and 1 m, respectively. A plane source of 137Cs with radioactivity of 100 Bq/cm2 was placed on the surface of the soil. The DRRFs at a height of 100 cm above ground and at a center of the cylinder were calculated by enlarging the decontaminated zone with DF = 10 and 20. Results of this calculation are shown in . One can see that the larger DF provides a larger DRRF, and the values of DRRF increase as the area of the decontaminated zone is increased. CDE results calculated using the response matrix are in good agreement (within 7%) with the results obtained by PHITS based on the three-dimensional particle transport simulations. As a result, it was confirmed that the CDE algorithm functions properly on the DRRF estimate for simplified decontamination cases.
Figure 12. Dose rate reduction factor (DRRF) decontaminated with DF = 10 and 20 by increasing the area of the decontamination zone. Marks and lines represent the results that were calculated using CDE and PHITS, respectively.
shows an aerial photograph [Citation8] superimposing a land-use classification of the Shimo-oguni area of Date city, which is about 55 km away from the Fukushima I NPS and is one of the target areas of an experimental decontamination project [Citation7] run by the Japanese government. The distribution maps of the contamination and the dose rate in air were measured by JAEA, the agency entrusted with the project. Note that the zones indicated as the orchards and the fields include a grass field located in the northern part of the settlement and a meadow on a hillside, respectively. To examine the reliability of CDE, the dose rates at the Shimo-oguni area before decontamination were calculated using the measured surface concentration of contamination, which ranges from about 10–70 Bq/cm2, as an input for CDE. The dose rates that were calculated for the six reference points indicated in with the letters A to D were compared to the results of measurements obtained in August 2011, before decontamination, and with the results of PHITS simulations that modeled a realistic computational geometry according to the geographical information of the Shimo-oguni area and used the measured radioactivity as input for transport simulations.
Figure 13. Aerial photograph superimposing land-use classification of the Shimo-oguni area, Date city.
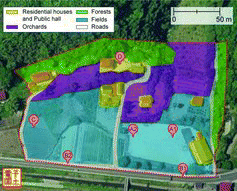
summarizes the results. CDE results were found to agree within 30% with the results obtained using the PHITS. While the PHITS simulation took over 10 h to complete, CDE completed the calculation in less than several seconds. This result demonstrates that CDE can predict dose rates much faster than PHITS and with comparable accuracy. CDE also shows very good agreement with the results of actual measurements. Although the deviation at point A2 is relatively large, the difference might be explained by the presence of an unknown radiation source. In this case, contaminated sprigs of trees were gathered during the decontamination of forests and were deposited near A2 at the time of dose rate measurements. The agreement between the simulated results and the results of actual measurements could improve if such a radiation source is accounted for in the calculation. Based on the above results, we propose that by using CDE, it is practically possible to predict dose rate distribution before decontamination at a typical settlement in Fukushima within a realistically short calculation time.
Table 4. Ambient dose equivalent rates (μSv/h) at reference points.
The validity of the dose calculation method of CDE is ascertained by comparing the results with dose rates obtained before decontamination, since dose rate distribution after decontamination is deduced from the distribution before decontamination using DF data given as input parameters. The measured data that report dose rate distributions after decontamination are accumulating in the governmental decontamination projects. The accuracy of the CDE method with regard to predictions after decontamination should also be tested in the future by taking into account the actual data.
5. Demonstration of decontamination planning
In this section, we show that a decontamination plan can be developed using CDE in order to provide a sufficient dose reduction in the Shimo-oguni area of Date city. lists cases that are examined in this demonstration along with the decontamination zones and the techniques applied to the zones. The land-use classifications are the same ones as those shown in . The parenthesized data in the corresponding column of that describes the decontamination technique indicate the values of DFs used in the calculations, corresponding to the built-in CDE data evaluated based on the catalog provided by AESJ [Citation10]. Case 0 corresponds to the initial state before decontamination. The data of surface concentration of contamination measured in this state were used as input radioactivity data for all dose-rate and DRRF calculations. In Case 1, the residential houses and public hall were decontaminated first, while in Case 2 orchards and forests were added to the decontamination zones. Cases 3 and 4 accounted for decontamination zones of fields and roads, respectively. In Case 5, the target area of the decontamination was extended an additional 100 m relative to the initial area.
Table 5. List of cases examined in the present demonstration.
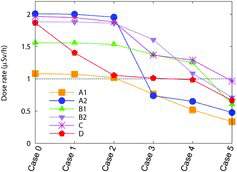
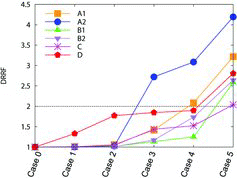
and show the ambient dose equivalent rates at a height of 100 cm above ground, and DRRFs for each case at the reference points indicated in . In addition, the color maps that are outputted from CDE are shown in . The top left panel, corresponding to Case 0, depicts the dose rate distribution before decontamination, and other panels show the distributions of DRRFs after decontamination, as listed in . The inner area enclosed with a red dashed line on the panels of is the area targeted by decontamination. As seen in Case 0 of , the ambient dose equivalent rate in the target area before decontamination reached 2 μSv/h. Hence, the goal of the present simulation was to reduce the dose rate below 1 μSv/h that would correspond to a DRRF-based decontamination of ∼2.
Figure 16. Distribution of DRRF at the Shimo-oguni area calculated by CDE for the cases summarized in Table 5. Note that the panel for Case 0 represents the distribution of dose rates before decontamination. Area enclosed by a red dashed line corresponds to the area targeted in decontamination.
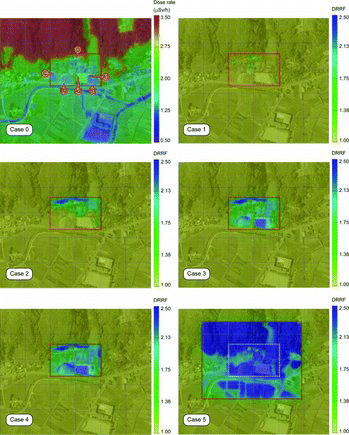
As shown in , the dose rate in the northern residential house at point D was successfully reduced down to about 1 μSv/h in the Case 2 decontamination. Decontamination of fields in Case 3 causes the dose rates at points A1 and A2 to become smaller than 1 μSv/h. While Case 4 decontamination is effective against the dose reduction at point B2 on the road, the dose rates at points B1, B2, and C (close to the boundary of the decontamination area) are still above 1 μSv/h. This happens because the dose rate at a site is affected by radioactive sources that are distributed not only on that site but also over its surroundings. In order to be able to thoroughly reduce the dose rate near the boundary, it is necessary to further extend the area that needs to be decontaminated. By analyzing Case 5, it is observed that the dose rates at points B1, B2, and C fall below 1 μSv/h, and DRRF-based decontamination higher than 2 is achieved for all these points.
These results can be summarized as follows. It is most important to consider the decontamination at a site at which the dose rate should be reduced. However, the dose contributions from the surroundings are not negligible. To achieve a sufficient decrease in the dose rate throughout the settlement, it is necessary to establish a decontamination area with a sufficient margin that extends beyond the area under consideration. The present demonstration of decontamination planning is somewhat simplified. In a realistic plan, the priority of decontamination zones and the cost of decontamination should be considered as well. However, in this demonstration CDE proved useful as a decontamination planning tool owing to its powerful ability to investigate various scenarios in a sophisticated but simplified way.
6. State of use
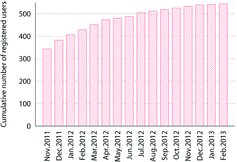
CDE was opened to the public on 2 November 2011. As we have already mentioned, it was distributed to registered users through the website [Citation5] free of charge, as open source software. shows the cumulative number of registered users since the software was released. As of February 2013, the total number of registered users was 545. More than 300 users had registered within the first month, and the number exceeded 500 within nine months. Although the cumulative number of users saturates, some new registrations are still presently received every month.
Figure 17. Cumulative numbers of registered users after the public release of the software in November 2011.
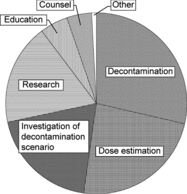
shows the distribution of the intended use of CDE, based on a survey performed during the registration process. More than 50% of users declared that they would utilize CDE to understand the effects of decontamination and radiation dose at contaminated areas of concern. About 20% of users declared that they are investigating the proper decontamination scenario for areas that are targeted in various decontamination projects. As described in Section 5, CDE is particularly suitable for the analysis of different scenarios within a short computational time. The use of CDE in scientific research and education is also observed.
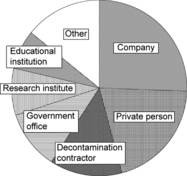
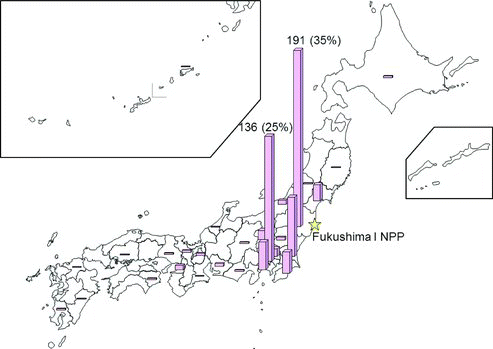
categorizes the affiliations of registered users. About 25% of users were employees of different companies, and they declared using CDE for business purposes. Including the ratios of decontamination contractors and government offices, about 50% of registered users are involved with actual decontamination projects. On the other hand, private users of CDE occupy 20% of the entire population of registered users. The distribution of registered users in Japan is illustrated in . The largest sub-population (∼35% of the whole population of registered users) corresponds to users from Fukushima Prefecture in which the accident occurred. Second, many users are from the Tokyo metropolis. This is because many companies and government offices are concentrated in that area. These observations demonstrate that CDE is not frequently used in regions away from the Fukushima I NPS. Three registrations were received from foreign countries.
7. Conclusions
A calculation system for the estimation of decontamination effects (CDE) has been developed to support the planning of rational and effective decontamination efforts. CDE can be employed to easily, quickly, and accurately calculate dose rate distributions before and after decontamination. Using CDE, a user can evaluate the effects of different decontamination scenarios without an in-depth knowledge of particle transport and dose calculations. From verification and validation tests, it was found that CDE has the ability to predict dose rate distribution with a comparable accuracy and a faster calculation speed as compared with the Monte Carlo particle transport code PHITS. It was also found that CDE represents the measured data very well. The effect of various decontamination scenarios can be examined by the instantaneous utilization of CDE. CDE thus makes decontamination based on a rational plan possible, and grants an efficient dose reduction and effective use of budget and labor. CDE is distributed free of charge as open source software. CDE has attracted over 500 users at the time of this writing and has been employed in decontamination planning, including pilot projects run by the Japanese government. The accuracy of CDE with respect to dose estimation after decontamination will also be validated by using the results obtained in pilot projects. The importance of rational decontamination is steadily increasing, and large-scale decontamination projects that target high dose areas are planned by the government. CDE can contribute to the establishment of such decontamination plans.
Acknowledgements
We are grateful to Dr Y. Ohnishi of the Pacific Northwest National Laboratory for fruitful discussions related to the CDE concept. We would like to express our gratitude to Mr S. Ikeshima, Mr M. Nakamura, and Dr K. Niita of the Research Organization for Information Science and Technology for their technical assistance in the development of CDE. We also acknowledge Dr T. Nakazawa for his generous support in the preparation and maintenance of the CDE website.
References
- Nuclear Emergency Response Headquarters. Report of Japanese government to the IAEA ministerial conference on nuclear safety. Japan: Government of Japan; 2011.
- Nuclear Emergency Response Headquarters. Basic concept and issues to be challenged for rearranging the restricted areas and areas to which evacuation orders have been issued where step 2 has been completed. Japan: Government of Japan; 2011.
- Iwamoto Y, Satoh D, Endo A, Sakamoto Y, Kureta M, Kugo T. Study on soil decontamination and dose rate reduction effect. Japan: Japan Atomic Energy Agency; 2011. Report No.: JAEA-Technology 2011-026.
- Satoh D, Kojima K, Oizumi A, Matsuda N, Kugo T, Sakamoto Y, Endo A, Okajima S. Development of calculation system for decontamination effect, CDE. Japan: Japan Atomic Energy Agency; 2012. Report No.: JAEA-Research 2012-020.
- Japan Atomic Energy Agency. CDE. Available from: http://nsed.jaea.go.jp/josen/index.html [ website, in Japanese].
- Sato T, Niita K, Matsuda N, Hashimoto S, Iwamoto Y, Noda S, Ogawa T, Iwase H, Nakashima H, Fukahori T, Okumura K, Kai T, Chiba S, Fruta T, Sihver L. Particle and heavy ion transport code system, PHITS, version 2.52. J Nucl Sci Technol. 2013;50:913–923.
- Japan Atomic Energy Agency. Report of the results of the decontamination model projects. Available from: http://www.jaea.go.jp/fukushima/decon04/decon04-ke_e.html.
- Geospatial Information Authority of Japan. GSI maps. Available from: http://portal.cyberjapan.jp/index.html.
- Google Inc. Google maps. Available from: https://maps. google.com/.
- Atomic Energy Society of Japan. Available from: http://www.aesj.or.jp/information/fnpp201103/chousacom/cu/catalog_ver1.0_20111024.pdf.
- Lyons C, Colton D. Aerial measuring system in Japan. Health Phys. 2012;102:509–515.
- Nuclear Regulation Authority. Monitoring information of environmental radioactivity level. Available from: http://radioactivity.nsr.go.jp/en/list/203/list-1.html.
- White MC. Photoatomic data library MCNPLIB04: a new photoatomic library based on data from ENDF/B-VI release 8. Los Alamos (NM): Los Alamos National Laboratory; 2003. Report No.: LA-UR-03-1019.
- Eckerman KF, Ryman JC. Federal guidance report no. 12; External exposure to radionuclides in air, water, and soil. Washington (DC): Environmental Protection Agency; 1993. Report No.: EPA-402-R-93-081.
- X-5 Monte Carlo Team. MCNP – a general Monte Carlo N-particle transport code, version 5. Los Alamos (NM): Los Alamos National Laboratory; 2003. Report No.: LA-UR-03-1987.
- International Commission on Radiological Protection. Nuclear decay data for dosimetric calculations, 107. Amsterdam (Netherlands): ICRP Publication; 2007.
- Ministry of Education, Culture, Sports, Science and Technology. Monitoring information of environmental radioactivity level. Available from: http://radioactivity. mext.go.jp/en/contents/4000/3158/24/116_0912_s0927.pdf.
- Ministry of Education, Culture, Sports, Science and Technology. Monitoring information of environmental radioactivity level. Available from: http://radioactivity. mext.go.jp/en/contents/6000/5705/24/116_2011_1101.pdf.
- Nishihara K, Yamaguchi I, Yasuda K, Ishimori K, Tanaka K, Kuno T, Inada S, Gotoh Y. Radionuclide release to stagnant water in Fukushima-1 nuclear power plant. Trans At Energy Soc Jpn. 2012;11:13–19. Japanese.
- Croff AG. A user's manual for the ORIGEN2 computer code. Oak Ridge (TN): Oak Ridge National Laboratory; 1980. Report No.: ORNL/TM-7175.
- OECD Nuclear Energy Agency. ZZ ORLIBJ32, ORIGEN2 libraries based on JENDL-3.2. Available from: http://www.oecd-nea.org/tools/abstract/detail/NEA-1642/.

