
 ?Mathematical formulae have been encoded as MathML and are displayed in this HTML version using MathJax in order to improve their display. Uncheck the box to turn MathJax off. This feature requires Javascript. Click on a formula to zoom.
Abstract
The distributions of dissolved rare earth elements (REEs) in river water during rainfall events in a forested catchment were studied to contribute to understandings of TRUs behavior. Variations in the concentrations of dissolved REEs and several elements (As, Sb, and V) apparently correlated well with peak intensities in the optical spectra (ultraviolet absorption and fluorescence emission) of the river water. The optical properties were considered to represent humic substances in dissolved organic matter (DOM). Similar hysteretic loops were found for the REE concentrations and optical intensities as a function of the water discharge. This result indicates that the mobile REEs and DOM likely shared flow paths from the soil to the stream during these events. An ultrafiltration study revealed that colloidal REEs present in a size fraction of 10–30 kilodaltons comprised the major component of the dissolved REEs and increased under high water flow. Considering these observations and model interpretations in the precedent literature, complexation of the dissolved REEs with DOM was suggested to occur during the studied rainfall events. A high correlation between the size-fractionated REE concentrations and specific ultraviolet absorbance was observed, suggesting that the aromaticity of DOM plays a role in its complexation with dissolved REEs.
1. Introduction
For countries utilizing nuclear energy for power supply, the environmental behavior of transuranic nuclides (TRU) is an important issue because of their inevitable production in nuclear reactors, higher potential health risk [Citation1], and long half-lives [Citation2].
River water is particularly important because of the high dependence on river water as a fresh water resource [Citation3] and the ability of river water to transport artificial radionuclides, which may be released from nuclear facilities, to the terrestrial and aquatic environment [Citation4–6]. The quantity of radionuclides transported via rivers is generally low compared to the source amount present in their upper reaches [Citation7,8]. In addition, when a river catchment is contaminated with TRUs, their downstream migration range is limited because of the high adsorption capacity of solid matrices, including surface soils, sinking suspended solids in reservoirs, and bottom sediments [Citation9,10], for TRUs. In fact, Sanada et al. [Citation11] showed high accumulations of 239,240Pu in river bottom sediments near the Chernobyl nuclear power plant.
However, other evidence supports greater long-distance transport of plutonium isotopes along a river. At the lower reach of the Yenisei River, approximately 1000 km from a source nuclear facility, Kuznetsov et al. [Citation4] found high concentrations of 239,240Pu in flood plain deposits (“hot spots”). Eyrolle et al. [Citation5] also reported the long-range transport of 239,240Pu from nuclear installation sources along the Rhône River to the coast of the Mediterranean Sea. They suggested that the organic and inorganic colloids were responsible for this transport.
Natural organic colloids have often attracted attention for transporting actinides in ground water because of the so-called “colloid-facilitated transport process” (e.g., [Citation12–14]). Recent studies further suggest that this process is applicable to surface-water environments. It results in, for example, secondary migration of radioactive soil contamination at the Rocky Flats Environmental Technology Site, as reported by Santschi et al. [Citation15], and accident-derived radionuclides at Chernobyl [Citation10,Citation16]. At both the sites, humic substances were considered to be important in the migration of the actinides. In another study, Xu et al. [Citation17] demonstrated that cutin-like natural organic ligand could enhance Pu transport in the surface environment.
Rare earth elements (REEs), as TRU analogs, can improve our understanding of TRU–natural organic matter interaction occurring in the environment. In fact, REEs, similar to TRUs, are characterized by a strong tendency to form complexes with natural organic matter [Citation18]. Notably, some REEs exhibit properties similar to those of trivalent TRUs in terms of their coordination chemistry [Citation19]. In addition, REEs are ubiquitous in surface water; thus, exploring the behavior of REEs as indicators for TRUs in areas where TRU levels are too low for investigation is possible. Furthermore, the use of REEs provides the possibility of model interpretation based on thermodynamics [e.g., Citation20,21], although caution is necessary regarding the nonthermodynamic behavior of TRUs because of their extremely low atomic concentrations in the environment, even in contaminated aquifers. For instance, an observed dissolved concentration of approximately 11 mBq L−1 for 239,240Pu in 1995 at the Glubokoye Lake Site near the Chernobyl nuclear reactors yielded 239Pu and 240Pu concentrations of the order of 10−14 and 10−15 mol L−1, respectively [Citation22].
Numerous studies of the interactions of REEs with dissolved organic matter (DOM) in laboratory systems [e.g., Citation23,24] and groundwater systems [e.g., Citation25] have been conducted. With respect to fluvial systems, Gaillardet et al. [Citation26] reviewed the influence of DOM on the forms and concentrations of REEs in river water. Based on the results of these studies, an increased REE transport flux is expected under high water flow conditions in river water. In fact, this phenomenon has been demonstrated for spring floods due to snowmelt in boreal rivers [Citation27,28]. On the other hand, in rivers located in temperate regions, rainfall events are very common causes of high water flow conditions. Nevertheless, few studies of REE behavior in connection with DOM have been reported for such hydrological events.
Thus, to enhance our understanding of REE behavior (and potentially TRU behavior in the present context) in fluvial environments, the behavior of REEs during rainfall events in terms of their concentrations, their colloidal size distributions, and the relationships between these properties and those of DOM were investigated.
2. Materials and methods
2.1. Site description
The studied river is the tributary of Kuji River located in central Japan (). The tributary, the Oda River, is a headwater stream with a catchment area of approximately 40 km2 and a stream length of 10 km. Most of the land (92%) in the catchment is characterized as forested and hilly. A small percentage in the upper and lower reaches is developed as arable land. The middle reach runs through a steep area of a rocky stream bed. The bedrock of the catchment consists of Mesozoic granites associated with Paleozoic crystalline schist [Citation29]. The surface soil type is a brown forest soil [Citation29]. The average annual rainfall in the catchment is 1314 ± 48 mm (standard deviation) based on data for the last 20 years (1991–2010, except 2002 due to no published data) [Citation30]. Precipitation typically occurs between May and September. The mean air temperature is approximately 0.3 °C in January and 24 °C in August [Citation31].
Figure 1. Location and topography of the Oda River catchment. The catchment is represented by the shaded area. The Oda River runs through the central valley westward (right to left). Closed square: water sampling point; open square: rain gage station.
2.2. Sample collection and preparation
2.2.1. Sample collection strategy
Bulk river water samples were studied first (bulk water study) to determine the typical occurrence of dissolved REEs at the study site during rainfall events. Bulk water samples are defined in this study as those filtered using a 0.2-μm-pore membrane filter and without further size fractionation. After completion of the bulk water study (in the 2003 and 2004 experiments), ultrafiltration (in the 2008 experiment) of the river water was employed (ultrafiltration study) to clarify the controlling factors that may define a typical occurrence. Suspended particulate matter was also collected and analyzed for REEs in both the bulk water and ultrafiltration studies, with the goal of elucidating the characteristics of the dissolved REE behavior.
Annual precipitation in the catchment in the sampling years was 1357, 1266, and 1189 mm in 2003, 2004, and 2008, respectively, while the 20-year average was 1314 ± 48 mm [Citation30] as already described. Records of the annual mean temperature at the nearest long-term meteorological station (Daigo town in the neighboring catchment) were 12.2, 13.0, and 12.4 °C, respectively, with a 20-year average 12.3 ± 0.7 °C (1991–2010) [Citation31]. These records indicate that the years 2003, 2004, and 2008 were meteorologically ordinary years. Thus, the experimental results spanning these years were analyzed together.
2.2.2. Bulk water study
River water was sampled at a lower reach point on the Oda River (N 36° 50′ 26″, E 140° 25′ 36″) (). Two rainfall events were examined in the bulk sample study: 20 November to 21 November 2003 (Rainfall 1) and 31 May to 1 June 2004 (Rainfall 2). These dates indicate the days when the rainfall occurred. Observation and water sampling were continued for several subsequent days after the rainfall occurred. An automated sampler (ISCO 6712, Teledyne Isco) was used to collect the river water from midstream at 2–6 h intervals from the pre-rainfall to the recession period.
In the laboratory, the collected river water samples were filtered using a disposable vacuum filter unit equipped with a 0.2-μm-pore membrane filter (VH020P, ADVANTEC). The filter unit was rinsed with the target water during filtration. After filtration, the samples were acidified to 0.2 N with ultrapure-grade nitric acid and used for the dissolved REE analysis.
2.2.3. Ultrafiltration study
The ultrafiltration study was conducted for the rainfall event of 17 April to 24 April 2008 (Rainfall 3). River water samples for the ultrafiltration study were sampled on the identical occasion of our previous study on heavy metals in the bulk water and suspended particulate matter [Citation32]. The water samples were collected manually at five flow stages. Three liters of river water were collected midstream into a high-density polyethylene bottle cleaned with nitric acid and rinsed with ultrapure water before use. In the laboratory, the water samples were first filtered using a 0.2-μm-pore membrane filter, and then the filtrates were subjected to ultrafiltration using a stirred cell (360 mL volume, 36.8 cm2 filtration area; UHP-76K, ADVANTEC) under nitrogen gas pressure. Ultrafiltration was performed sequentially using three membrane filters with nominal cutoffs of 30 kilodaltons (kDa) (YM30, Millipore), 10 kDa (YM10), and 1 kDa (YM1), that comprised regenerated cellulose with low adsorption to high-molecular-weight solutes.
Mass balance in the ultrafiltration was examined in the following way: The sum of four fractional concentrations of REE was divided by the concentration of the corresponding REE in the solution fed for the ultrafiltration to elucidate a recovery yield. The resulting yield values, on average of operations for sample from the flow stages 2, 3, 4, and 5, were as follows: La 0.9 ± 0.1; Ce 1.0 ± 0.2; Pr 0.9 ± 0.1; Nd 1.0 ± 0.2; Sm 1.1 ± 0.3; Eu 1.1 ± 0.2; Gd 0.9 ± 0.2; Dy 0.9 ± 0.2; Er 1.0 ± 0.1; Yb 1.0 ± 0.1. These yields were close to unity, indicating limited adsorption and/or contamination of the REEs during ultrafiltration. However, the yield was low for all analyzed REEs in the flow stage 1 operation (recovery 0.2–0.5, except 0.8 for Eu) due to unresolved reasons. Approximately 600 mL of filtrate was processed in two batches for each of the five flow stages. The resultant retentate and permeate solutions from the two batches were combined at each step for the next operation. During ultrafiltration, several precautions were adopted [Citation33,34]. The filters were washed in the cell by passing alkaline (0.01 M NaOH) and then acidic solutions (0.01 M HCl) through them with intermittent rinsing with ultrapure water before use. In addition, an aliquot of the sample solution was used to rinse the cell and filter each time before use to minimize the loss of solutes due to adsorption to the cell wall and filter.
Ultrafiltration yielded the following four fractions based on size: 30 kDa–0.2 μm, 10–30 kDa, 1–10 kDa, and <1 kDa. The concentration factor (the ratio of the volume of the fed solution to that of the retentate solution, CF) was controlled to approximately 10. This size discrimination and CF were determined according to the recommendations for ultrafiltration of environmental water samples [Citation33,34] and our previous study [Citation16]. The exact CF values were evaluated by monitoring the processed water volume each time. The loss of volume ranged from +0.5% to −0.6% of the fed solution, except for two cases of +3% and −2%. The loss was considered to be small, and no corrections to the CF were made. The method used to derive the REE concentrations for each size component is given in the appendix.
Previously, we used the suspended particulate matter [Citation32]. Briefly, suspended particulate matter was collected from 60 or 120 L samples of river water at each of the five flow stages. The water samples were subjected to filtration in the laboratory using continuous-flow centrifugation (H-600S, KOKUSAN) [Citation35]. The resultant solids were sieved into four particle size components: (a) >2 mm, (b) = 1–2 mm, (c) = 0.1–1 mm, and (d) <0.1 mm in nominal diameter. The two muddy components (c and d) were subjected to acid extraction with 1N HCl extraction and to whole digestion. The results of the acid extraction were used in the present study.
2.3. Monitoring of environmental conditions
The water depth at the sampling point was monitored every 15 min using a pressure gauge (SS-202-10M-30, KENEK). The depth data were converted to the flow rate using an on-site calibration curve generated from occasional manual measurements. The hourly precipitation record was provided by a public meteorological station located in the studied catchment. During the Rainfall 1 observation, the river water pH was monitored with a submerged sensor (U-22XD, Horiba) every 30 min.
2.4. Instrumental analysis
2.4.1. Elemental concentrations of water samples
Note that the studied REEs are referred to as light rare earth elements (LREEs; La, Ce, Pr, and Nd), medium-weight rare earth elements (MREEs; Sm, Eu, and Gd), and heavy rare earth elements (HREEs; Dy, Er, and Yb) to facilitate the discussion.
In both the bulk water and ultrafiltration studies, the prepared samples were analyzed for REEs (139La, 140Ce, 141Pr, 146Nd, 147Sm, 153Eu, 157Gd, 163Dy, 166Er, and 172Yb) by inductively coupled plasma mass spectrometry (HP-4500, Agilent). Quantitative calibrations were conducted using external standard solutions (XSTC multi-element standards, SPEX). The analytical errors ranged from 3% (mostly for LEEs) to 20% (mostly for HREEs). The elements Pm, Tb, Ho, Tm and Lu were not analyzed because they were always under the detection limits because of their low natural abundances.
The greatest interference from isobars was expected to be caused by 136Ba16O1H and 137Ba16O on 153Eu under our conditions. A test for this interference showed that it contributed to less than 5% of the uncorrected concentrations of Eu in our samples. Therefore, no correction was made for the presence of Ba.
2.4.2. Anion analysis
The concentrations of anionic species (F−, Cl−, NO3−, and SO42−) in the filtered water samples from the automated sampler were determined by ion chromatography (IC-7000, Yokogawa).
2.4.3. Dissolved organic carbon concentration
In the ultrafiltration study, the concentration of dissolved organic carbon (DOC) was determined for the retentate and permeate solutions during ultrafiltration as well as for the samples before ultrafiltration by a high-temperature combustion method with platinum catalysis (TOC-5000, Shimadzu). The analytical error was less than 5%.
2.4.4. Analysis of optical properties
The ultraviolet absorption and fluorescence intensities of the water samples in the ultrafiltration study were measured. The ultraviolet absorption was measured at room temperature using a quartz cell with a 10-mm light path and spectrophotometers (U-3300, Hitachi; V-550, Jasco). Three-dimensional excitation–emission matrix (EEM) fluorescence spectra were measured using either a Hitachi F4500 (for the bulk river water samples) or a Jasco FP-6500 (for the size-fractionated samples) fluorescence spectrophotometer. The samples with a high DOC concentration were diluted with ultrapure water to minimize the inner filtering effect [Citation36]. The fluorescence intensities of the EEM spectra were normalized using an external standard consisting of a quinine sulfate solution according to Nagao et al. [Citation37], and then expressed in quinine sulfate unit (QSU).
3. Results
3.1. Bulk sample studies
3.1.1. Raw concentrations of dissolved REE
(a) and (d) show the temporal variations in the dissolved REE concentrations in the river water during Rainfall 1 and Rainfall 2 (see Section 2.2.2), respectively. In the figures, typical results are illustrated with La, Eu, and Er representing the LREEs, MREEs, and HREEs, respectively. The complete data, including the other REEs, are provided as Supplemental Data. These REE concentrations varied approximately concurrently with the increase and decrease in the river water flow rate. For example, during Rainfall 1 ((a)), the concentration of dissolved La increased by approximately three times the pre-rainfall value of 18 ± 2 ng L−1 (20 November, 06:00) to the maximum during this event of 51 ± 2 ng L−1 (21 November, 12:00). The corresponding river flow rate was 0.95 m3 s−1 (20 November, 06:00), and then increased to 1.73 m3 s−1 (21 November, 12:00) in response to a total of 21 mm of precipitation. A similar but slightly less pronounced increase of 1.8–2.0 times was observed for the REE concentrations during Rainfall 2 (31 May to 1 June 2004), with a total precipitation of 27 mm.
Figure 2. Temporal behavior of dissolved REE concentrations in the river water and optical properties of the river water during rainfall events (the bulk water study). Precipitation: black bars on the upper horizontal axes; river water discharge: shaded area [(a), (d), (c), and (f)]. The results outlined in (a)–(c)) are for a rainfall event (Rainfall 1) that occurred during 20 November to 21 November 2003. The results shown in (d)–(f) are for a rainfall event (Rainfall 2) that occurred during 31 May to 1 June 2004. (a) and (d): concentrations after filtration with a 0.2-μm-pore filter unit; (b) and (e): shale-normalized concentrations; (c) and (f): optical properties of filtrated river water (see Section 3.1.3 for abbreviations UV254 and FL430).
![Figure 2. Temporal behavior of dissolved REE concentrations in the river water and optical properties of the river water during rainfall events (the bulk water study). Precipitation: black bars on the upper horizontal axes; river water discharge: shaded area [(a), (d), (c), and (f)]. The results outlined in (a)–(c)) are for a rainfall event (Rainfall 1) that occurred during 20 November to 21 November 2003. The results shown in (d)–(f) are for a rainfall event (Rainfall 2) that occurred during 31 May to 1 June 2004. (a) and (d): concentrations after filtration with a 0.2-μm-pore filter unit; (b) and (e): shale-normalized concentrations; (c) and (f): optical properties of filtrated river water (see Section 3.1.3 for abbreviations UV254 and FL430).](/cms/asset/73d6716f-6e16-43bb-82c7-aeefc056dade/tnst_a_961989_f0002_b.gif)
3.1.2. Shale-normalized concentrations of the dissolved REEs
To clarify the overall behavior of the REE concentrations during different flow conditions (high flow and low flow), the concentrations were displayed as values normalized by the composition of the North American shale composite [Citation38,39]. The employed composition in this study is shown in the Supplemental Material.
The shale-normalized concentration patterns of the REEs in the river under high- and low-flow conditions are shown in (b) and (e), respectively. These normalized concentrations reveal a clear increase in the dissolved concentrations of all REEs under high-flow conditions. Cerium exhibited lower shale-normalized concentrations in the river water than the other REEs. A similar trend has been reported for other river water environments [Citation40,41]. The normalized patterns also differed by element. The extent of the increase in the normalized concentrations from the low-water periods to the high-water periods was greater for the LREEs (La, Pr, and Nd) (except Ce) and MREEs (Sm, Eu, and Gd) than for the HREEs (Dy, Er, and Yb) ((b) and (e)).
3.1.3. Optical properties and DOC concentrations
The river water samples exhibited broad optical absorption from approximately 350 nm to a shorter wavelength near 200 nm with a steep increase. This absorption feature is typical of surface waters [Citation42] and attributed to natural organic matter [Citation43]. Although different wavelengths such as 260 [e.g., Citation44] and 280 nm [e.g., Citation45] have been used to characterize this broad absorption, the absorbance at 254 nm is also frequently used [e.g., Citation46]. Therefore, the absorbance at 254 nm with a 1 cm path length (hereafter, UV254) was employed in this study.
The excitation–emission spectra obtained by three-dimensional fluorescence spectroscopy had three broad peaks at 330/430 (excitation wavelength/emission wavelength), 335/470, and 360/470 nm. The intensities of the three peaks were highly correlated (data not shown), and the strongest peak at 330/430 nm (hereafter, FL430) was used in the present analysis. These optical properties are considered to be characteristic for humic substances [Citation37]. In fact, the observed florescence peaks of the river water samples were quite similar to those of the standard Dando fulvic acid [Citation47].
(c) and (f) show the temporal variations in the two optical properties (UV254, FL430) during Rainfalls 1 and 2. Both exhibited a clear increase under high-flow conditions. The optical properties were found to be positively and almost linearly correlated with each other ((a) and (d)). The temporal changes in optical properties signals were highly correlated (r > 0.9, for UV254) with the changes in the dissolved REE concentrations during rainfall events ((b), (c), (e) and (f)). Several other dissolved inorganic elements (V, Sb, As, and U, data are from the literature [Citation32]) also exhibited a high correlation with the optical properties (r > 0.7 for UV254).
Figure 3. Relationship between the optical properties of the river water and correlation of the europium concentrations with the absorbance and relative intensity of the river water (the bulk water study). See Section 3.1.3 for the abbreviations UV254 and FL430. Subplots (a)–(c) are for Rainfall 1 (20 November to 21 November 2003). Subplots (d)–(f) are for the Rainfall 2 (31 May to 1 June 2004).
According to Singh et al. [Citation48], seasonal variability of river water DOM content is related to various drivers such as seasonal vegetation episodes (e.g., leaf fall as a DOM source), precipitation, temperature, and microbial activity. This variation may be reflected in the optical properties of the DOM, and furthermore, the apparent correlation between the DOM properties and solutes in river water. In the two bulk water samples, which were collected in November (Rainfall 1) and May–June (Rainfall 2), the correlation coefficients for UV254 and dissolved REE concentrations were significantly different (p < 0.05) (except Eu). This difference may be due to seasonal variation in the DOM. However, the present data-set is not large enough to describe any seasonal variability of the river water DOM.
3.2. Ultrafiltration study
3.2.1. Calculated concentrations of dissolved REE by size
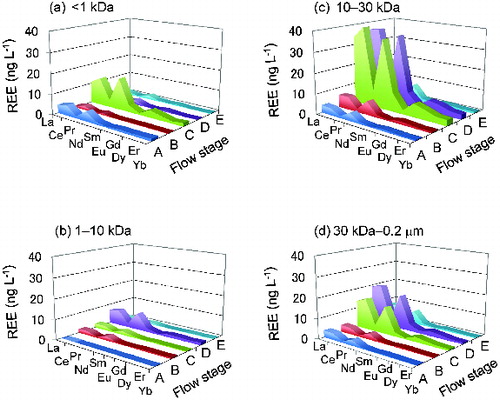
shows the precipitation and river discharge recorded during Rainfall 3 (17 April to 24 April 2008), when the ultrafiltration study was conducted. A total of 43 mm of precipitation fell from 21:00 on April 17 to 16:00 on April 19 with several breaks. Intense rainfall (more than 2 mm h−1) occurred from 2:00 on April 17 to 9:00 on April 18. In response to this rain, the river flow increased from 1.3 m3 s−1 to its peak value of 4.0 m3 s−1 (12:00 on April 18). The REE concentrations at different flow stages (A, B, C, D, and E, ) are shown in for each fraction (<1, 1–10, 10–30 kDa, and 30 kDa–0.2 μm). The values were calculated using Equations (1)–(4) in the appendix. These data indicate that the 10–30 kDa fraction contributed most to the increase in the REE concentrations under high-flow conditions. The 30 kDa–0.2 μm fraction made the second largest contribution. The contributions of the smaller fractions (<1 and 1–10 kDa) to the increase in the REE concentrations were quite limited, except for two minor but distinct instances: <1 kDa fraction in flow stage C and the 1–10 kDa fraction in flow stage D.
Figure 4. Hydrological conditions and sampling times at various flow stages during the ultrafiltration study (Rainfall 3). Precipitation records: black bars on the upper horizontal axis; river water discharge: shaded area. Closed circles (A, B, C, D, and E) denote river water and suspended solids sampling times.
Figure 5. Concentrations of dissolved REEs at various flow stages during Rainfall 3. Results are shown for components of various sizes fractionated by ultrafiltration. Subplots (a)–(d) correspond to the results for each nominal size range.
3.2.2. Shale-normalized concentrations of the dissolved REEs
The shale-normalized concentrations of the dissolved REEs during Rainfall 3 are shown in . In (c), outstanding contributions of the 10–30 kDa fraction to the increase in the overall concentration during the high-flow stages (C and D) can be clearly observed for all analyzed REEs. The MREEs exhibited a greater increase than the LREEs and HREEs, producing a convex shape for stages C and D ((c)). This shape was also observed for the <1 kDa fraction of stage C ((a)). The 30 kDa–0.2 μm fraction exhibited a gradual decrease for the LREEs, except for Ce, toward the HREEs.
Figure 6. Dissolved REE concentrations normalized for North American Shale Composite (NASC) at various flow stages during Rainfall 3. Results are shown for components of various sizes fractionated by ultrafiltration. Subplots (a)–(d) correspond to the results for each nominal size range.
3.2.3. DOC concentrations and optical properties
shows the size distributions of selected REEs and the DOC at the different flow stages. (Illustrations for all REEs are given in the Supplemental Material). For the DOC, the <1 kDa fraction contained the largest percentage of DOC of the four different fractions in the low flow stages (A and E), and the 10–30 kDa fraction became comparably large in the high-flow stages (C and D). However, the contribution of the 1–10 kDa fraction remained fairly small, and the 30 kDa–0.2 μm fraction contained the lowest DOC concentration and the least intense optical peaks. The latter result for the DOC is in contrast to the observation that this fraction contained the second highest concentration of dissolved REEs in the high-flow conditions (C and D). The 10–30 kDa fraction contained the greatest percentage of REEs under high-flow conditions (C and D) and for stages B and E.
Figure 7. Colloidal size distributions of dissolved REEs and DOC at different flow stages during the ultrafiltration study (Rainfall 3). Legend for fans: C1: <1 kDa; C2: 1–10 kDa; C3: 10–30 kDa; C4: 30 kDa–0.2 μm. (For legend, refer to (b) Eu at Stage A, which is common for all subplots.)
3.2.4. Acid-extracted REEs on the size-fractionated suspended particles
(a) and (b) present the quantities of La and Eu, respectively, on suspended solid particles collected during Rainfall 3 and extracted with acid. The results for the remaining REEs are proved in the Supplemental Material. These quantities varied with flow stages, and notably decreased during the high-flow stages. For example, the values for La on the finest particles (d < 0.1 mm) was 23.1 μg g−1 before the rainfall (Stage A), and 16.3 μg g−1 during Stage C ((a)). Interestingly, the decrease in these values even continued during the recession period (Stage E). The decrease was more pronounced for the second finest solids (c = 0.1–1 mm). A similar tendency was found for Eu ((b)) and the other REEs (Supplemental Material).
Figure 8. Quantity of acid-extracted REEs and total carbon content on size-fractionated suspended particles at different flow stages during Rainfall 3, with comparison to the dissolved components. Data for the total carbon (TC) content was taken from [Citation32]. (a)–(c): on suspended particles; (d)–(f): dissolved components in water. A common legend is used for the solid (a–c) and solution (d–f) subplots, respectively.
![Figure 8. Quantity of acid-extracted REEs and total carbon content on size-fractionated suspended particles at different flow stages during Rainfall 3, with comparison to the dissolved components. Data for the total carbon (TC) content was taken from [Citation32]. (a)–(c): on suspended particles; (d)–(f): dissolved components in water. A common legend is used for the solid (a–c) and solution (d–f) subplots, respectively.](/cms/asset/497e2a17-83f1-4e12-81ed-12b05331a495/tnst_a_961989_f0008_b.gif)
4. Discussion
4.1. Increases in dissolved REE concentrations during rainfall events – bulk water study
The present observations clearly demonstrated an increase in the dissolved REE concentrations during rainfall events at this small stream located in a temperate, forested catchment ((a) and (d)). Increase in the optical properties [the ultraviolet absorbance (UV254) and florescence emission (FL430)] with increasing flow rate was also observed ((c) and (f)). The dissolved REE concentrations were strongly correlated with those of the optical properties (r > 0.9, linear regression in Rainfall 1). By referring to previously obtained data for these rainfall events [Citation32], several other elements (As, Sb, V, and U) were also found to have a high correlation (r > 0.7) with the optical properties.
It is said that correlation is not necessarily causal. Accordingly, the concurrent increase in these substances (inorganic elements and organic matter) in river water could be a coincidental result that can be explained by a common trend: an increase in material input from the ground to the river during rainfall events [e.g., Citation49]. Therefore, to confirm this point, hysteretic loops for the concentrations and absorbance/emission peak intensities with respect to water discharge were investigated (). This analysis provides information on the flow path of substances transported from the soil to the river [Citation50–52]. It can be seen from the figure that the optical properties (DOM fingerprints) had similar clockwise loops ((a) and (b)). REEs also exhibited clockwise loops ((c) and (d)), indicating a time lag for the concentration peaks relative to the water discharge. On the other hand, V, As, and Sb did not exhibit such clear clockwise loops ((e)–(g), respectively). This analysis suggests that the mobile REEs and DOM likely shared flow paths from the soil to the river during the event. The other three elements, on the other hand, followed different flow path, despite their high correlation with the optical properties. Uranium's loop was close to a semi-circle ((h)); therefore, it may have shared a flow path with the mobile DOM.
Figure 9. Hysteretic loops for the optical properties and concentrations of La, Eu, and some other dissolved elements as a function of the water discharge during Rainfall 1. Elements V, As, Sb, and U were selected due to their high linear correlation (r > 0.7) with the optical properties of the river water. The data for V, As, Sb, and U were taken from [Citation32].
![Figure 9. Hysteretic loops for the optical properties and concentrations of La, Eu, and some other dissolved elements as a function of the water discharge during Rainfall 1. Elements V, As, Sb, and U were selected due to their high linear correlation (r > 0.7) with the optical properties of the river water. The data for V, As, Sb, and U were taken from [Citation32].](/cms/asset/7ff54994-7f9f-45ae-ab0c-d6b65466e304/tnst_a_961989_f0009_b.gif)
4.2. DOM and REE complexation–ultrafiltration study
4.2.1. Interpretation of the shale-normalized concentration patterns
The 10–30 kDa fraction was found to contribute the most to the increase in the dissolved REE concentration in the river water during high-flow stages (). Thus the fraction exhibited a peculiar convex shape in the shale-normalized concentration patterns ( (c)), which implies that humic substances are involved as complex ligands bound to the REEs [Citation21,Citation24].
Using a complexation model theory, Yamamoto et al. [Citation21] demonstrated that shale-normalized concentration patterns exhibit a convex shape when REEs are complexed with humic substances. The same correlation was also suggested by Pourret et al. [Citation18,Citation53]. In addition, at the present study site, the fluoride and chloride ion concentrations were nearly constant during the rainfall events (F−: 0.30–0.32 mg L−1; Cl−: 4.0–5.0 mg L−1, Rainfall 1) and did not increase under high-flow conditions. Therefore, these model theories and experimental data support the possibility that humic substances in the DOM act as ligands for the REEs in the present case.
The present ultrafiltration study results are also suggestive regarding the behavior of TRUs in aquatic and terrestrial environments. Matsunaga et al. [Citation16] reported a biased distribution of plutonium and americium isotopes in colloidal size fractions of greater than 10 kDa in surface waters affected by the Chernobyl accident. Furthermore, in freshwaters of the Rhône River, Eyrolle et al. [Citation5] found that more than 60% of the dissolved plutonium isotopes (passed through a 0.45-μm filter) were present in a colloidal fraction (0.002–0.45 μm). In both cases, DOM was believed to be involved in the biased TRU distributions. Santschi et al. [Citation15] also demonstrated that erosional transport of surface soil contaminated with 239,240Pu and 241Am occurred in particulate and colloidal forms, and both humic and fulvic acids enhanced remobilization of colloid-bound Pu isotopes. These previous studies certainly indicate the importance of colloidal humic substances in TRU remobilization in the environment. Xu et al. [Citation54] recently clarified the role of organic colloids as carriers of TRUs and its pH dependency. Increases of the colloidal form of TRUs were observed at neutral and alkaline pH conditions, when compared to a more acidic condition (pH 3.8), in laboratory experiments conducted using organic rich loamy sand from the Savannah River Site.
4.2.2. Identification of a characteristic index
The above discussion suggests that DOM is involved in the increase in REE concentrations in river water. However, the DOC size distribution ((d)), with less than a 50% contribution of the 10–30 kDa fraction, did not match well with that of the dissolved REEs, for which this fraction's contribution was greater than 50% ((a)–(c)). For the DOC, the most important component was the <1 kDa fraction even during the high-flow stages (C and D). On the other hand, the 10–30 kDa fraction made the greatest contribution to the REE concentrations during the two high-flow stages. The dissolved REE concentrations also had small peaks for the size fraction of <1 kDa fraction during flow stage C and 1–10 kDa fraction during flow stage D.
As shown in , the UV254 absorbance increased in correlation with increase in the REE concentrations. Therefore, the specific ultraviolet absorbance (SUVA) was explored as a possible parameter related to DOM complexation with REEs. The SUVA is defined as the optical absorbance at 254 nm (with a 10 mm cell length) divided by the DOC concentration of the solution [Citation55].
(a)–(c) shows the relationships between the SUVA values and selected REE concentrations (La, Eu, and Yb, respectively) for Rainfall 3 (the ultrafiltration study), including the different size fractions and flow stages. Note that the SUVA values are by definition those normalized for the DOC. To maintain consistency with this normalization for the DOC, the REE concentrations (shale-normalized concentrations) were further normalized for the DOC in the corresponding (a)–(c). As can be observed from these figures, a clear, positive linear correlation was obtained between the SUVA and dissolved REE concentrations (<1, 1–10, and 10–30 kDa, (a)–(c), closed circles). The linear regression lines are depicted in the illustrations. It should be noted that the SUVA values are generally considered to represent the aromaticity of DOM [Citation42,Citation56]. Thus, these results suggest that the aromaticity of DOM is the important property influencing its complexation with dissolved REEs in river water.
Figure 10. Relationship between SUVA and REE concentrations (a, b, and c) and that between DOC and REE concentrations (d, e, and f) for selected REEs. Closed circles: collective data for the size fractions. (i) <1, (ii) 1–10, and (iii) 10−30 kDa. Open circles (in subplots (a)–(c)): data for the size fraction, 30 kDa–0.2 μm. The open circle data was not included in the regression analyses.
In contrast, the correlation for the DOC was found to be very poor, particularly because of two outliers (indicated by arrows in (d)–(f)). These outliers correspond to the high-flow stages, C and D (). This result indicates that the maximum increases in the dissolved REE concentrations under high-flow conditions (C and D) were not explained well by the DOC. In other words, no simple relationship exists between the concentration of organic carbon and the increase in colloidal REEs. This result further supports the importance of the SUVA values.
The concentrations of the 30 kDa–0.2 μm fractions normalized for the DOC were not included in the regression because they varied in a peculiar manner ((a)–(c), open circles) and were larger than the values expected from the linear regression lines. This difference became smaller toward the HREEs, where almost no difference existed. The reason for this peculiar behavior is not clear.
4.2.3. Interactions between the solid and solution phases
During Rainfall 3, the quantities of acid-extracted REEs on the size-fractionated suspended particles were also analyzed (). The dissolved concentrations of La and Eu are also shown ((d) and (e), respectively) for ease of comparison ((a) and (b)). The quantities per unit weight of size-fractionated suspended particles decreased during the high-water flow stage, whereas the dissolved REEs increased as discussed previously. Therefore, the particulate and dissolved REEs in the river water behaved independently at instances of river water flow increases. A similar contrast was observed for the soild and dissolved carbon components ((c) and (f), respectively). This data-set may suggest that there was limited interchange, both for REEs and organic matter, between their dissolved and suspended particulate phases during a rainfall event in the studied environment. However, Ingri et al. [Citation27] reported a systematic, seasonal interchange between the two phases based on their year round observation of a boreal river. Therefore, the present data-set possibly represents only a snapshot the interaction, and additional data is required to fully discuss such the interactions.
4.2.4. Implications for the behavior of TRUs in fluvial environments
With respect to the fluvial transport load, rainfall events provide important occasions for REE export from catchments. This study revealed that during rainfall events, the dissolved REE concentrations and river water discharge increased concurrently. This results in a significant increase in the REE transport load. Many reports have indicated that TRUs are highly immobile in the natural environment [Citation10–12], and their distribution coefficients in surface aquatic environments could be as high as 105 mL g−1 [Citation22]. These data from the literature suggest that only a small percentage of the TRUs in catchments should dissolved in river water. Even so, it is crucial to accumulate data and constantly renew our understanding of their behavior in the environment. By analogous nature of TRUs to some of REEs, the present study on REEs suggests that the level of dissolved TRUs would increase during rainfall events. It is also suggested that they would be associated mostly with a part of DOM. This behavior should be considered in monitoring programs of environmental TRUs, interpretation of monitoring data, and consideration of their transportability and bioavailability [Citation57]. Concurrent investigations of REEs with TRU in the field would be of help.
The influence of natural organic matter (NOM) on environmental behavior is not one sided. NOM can act not only as a vector of TRU by forming mobile colloids, but also as a sink of TRU. As seen in Xu et al. [Citation54], environmental conditions such as solution pH and solid matrix organic content should also be taken into account in the TRU monitoring program.
5. Conclusions
This study demonstrated an increase in dissolved REE concentrations during rainfall events via field observations in a temperate, forested catchment. The increase was apparently correlated with increases in the optical properties related to humic substances in DOM. Ultrafiltration analysis indicated that the 10–30 kDa fraction contributed most to the increase of dissolved REE concentrations. In addition, the shale-normalized concentration patterns across REEs from La to Yb had a convex shape for this fraction under high-flow conditions. Considering these observations and model interpretations in the precedent literature, complexation of the dissolved REEs with DOM was suggested to occur during the studied rainfall events. Concerning the interactions of REEs and carbon compounds between the solution and suspended solid phases during a rainfall event, the interactions appeared to be limited. However, year-round data is required for further discussion. Finally, a high correlation was found between the size-fractionated REE concentrations (<1, 1–10, and 10–30 kDa) and the SUVA, rather than the DOC. Because the SUVA represents the aromaticity of DOM, the aromaticity would be a more essential property of DOM that determines the level of complexation with dissolved REEs in the river water.
Supplemental data
Supplemental data for this article can be accessed here.
Supplemental Data
Download Zip (719.7 KB)Acknowledgements
The authors thank Shigeyoshi Otosaka and Seiya Nagao for their technical collaboration and helpful comments throughout this study. We are also indebted to Kojiro Shimojo and Tetsushi Nagano for providing the optical instruments. Jun Koarashi provided us helpful suggestions on data manipulation. Permission granted by the Yamatsuri Town Office to use the sampling plot was essential for this study. The Kuji River Office of The Ministry of Land, Infrastructure, Transport, and Tourism is also acknowledged for its support in providing access to environmental conditions. Standard materials for humic substances (the Dando fulvic acid) from the Japanese Humic Substances Society were used in this study. The critical comments from two anonymous reviewers are greatly appreciated.
Related Research Data
References
- International Commission on Radiological Protection. Age-dependent doses to the members of the public from intake of radionuclides - part 5, compilation of ingestion and inhalation coefficients. ICRP Publication 72, Ann. ICRP. 1995;26:41.
- International Commission on Radiological Protection. Nuclear decay data for dosimetric calculations. ICRP Publication 107, Ann. ICRP. 2008;38:92.
- Lusa M, Lehto J, Leskinen A, Jaakkola T. 137Cs, 239,240Pu and 241Am in bottom sediments and surface water of Lake Päijänne, Finland. J Environ Radioactivity. 2009;100:468–476.
- Kuznetsov YV, Legin VK, Strukov VN. Trans-uranium elements in floodplain sediments of the Yenisei River. Radiokhimiya. 2000;42:470–477.
- Eyrolle F, Charmasson S. Importance of colloids in the transport within the dissolved phase (< 450 nm) of artificial radionuclides from the Rhône river towards the Gulf of Lions (Mediterranean Sea). J Environ Radioactivity. 2004;72:273–286.
- Skwarzec B, Jahnz-Bielawska A, Strumińska-Parulska DI. The inflow of 238Pu and 239+240Pu from the Vistula River catchment area to the Baltic Sea. J Environ Radioactivity. 2011;102:728–734.
- Matsunaga T, Tkachenko Y. Migration of atmospherically derived radionuclides in river systems; findings from researches related to the Chernobyl accidents and nuclear weapon tests. ATOMO∑. 2011;53:684–688. Japanese.
- Ueda S, Hasegawa H, Kakiuchi H, Akata N, Ohtsuka Y, Hisamatsu S. Fluvial discharges of radiocaesium from watersheds contaminated by the Fukushima Dai-ichi Nuclear Power Plant accident, Japan. J Environ Radioactivity. 2013;118:96–104.
- Sansone U, Belli M, Voitsekovitch OV, Kanivets VV. 137Cs and 90Sr in water and suspended particulate matter of the Dnieper River-Reservoirs System (Ukraine). Sci Total Environ. 1996;186:257–271.
- Matsunaga T, Nagao S. Environmental behavior of plutonium isotopes studied in the area affected by the Chernobyl accident. Humic Subst Res. 2009;5/6:19–33.
- Sanada Y, Matsunaga T, Yanase N, Nagao S, Amano H, Takada H, Tkachenko Y. Accumulation and potential dissolution of Chernobyl-derived radionuclides in river bottom sediment. Appl Radiat Isotopes. 2002;56:751–760.
- Kanai Y, Suzuki M, Kamikoka H, Yoshida T, Suko T. Review on influences of colloids on geologic disposal of high level radioactive waste–for better understanding of colloidal materials–. Chikyukagaku. 2007;41:89–107. Japanese with English Abstract.
- Dai K, Buesseler KO, Pike SM. Plutonium in groundwater at the 100K-area of the U.S. DOE Hanford site. J Contaminant Hydrology. 2005;76:167–189.
- Tanaka T, Mukai M. Numerical simulation of the influence of humic-complexation on the migration of radionuclide through porous media – a consideration of the sensitivity of analytical parameters. Humic Subst Res. 2009;5/6:35–43.
- Santschi, PH, Roberts KA, Guo LD. Organic mature of colloidal actinides transported in surface water environments. Environ Sci Technol. 2002;36:3711–3719.
- Matsunaga T, Nagao S, Ueno T, Takeda S, Amano H, Tkachenko Y. Association of dissolved radionuclides released by the Chernobyl accident with colloidal materials in surface water. Appl Geochemistry. 2004;19:1581–1599.
- Xu C, Santschi PH, Zhong JY, Hatcher PG, Francis AJ, Dodge CJ, Roberts KA, Hung CC, Honeyman BD. Colloidal cutin-like substances cross-linked to siderophore decomposition products mobilizing plutonium from contaminated soils. Environ Sci Technol. 2008;42:8211–217.
- Pourret O, Davranche M, Gruau G, Dia A. Rare earth elements complexation with humic acid. Chem Geol. 2007;243:128–141.
- Cotton S. Lanthanide and actinide chemistry. Chippenham: Wiley;2006.
- Tang J, Johannesson KH. Speciation of rare earth elements in natural terrestrial waters: assessing the role of dissolved organic matter from the modeling approach. Geochim Cosmochim Acta. 2003;67:2321–2339.
- Yamamoto Y, Takahashi Y, Shimizu H. Interpretation of REE patterns in natural water based on the stability constants. Geochim Cosmochim Acta. 2006:70: Supplement, Goldschmidt Conference Abstracts, A717.
- Matsunaga T, Ueno T, Amano H, Tkatchenko Y, Kovalyov A, Watanabe M, Onuma Y. Characteristics of Chernobyl-derived radionuclides in particulate form in surface waters in the exclusion zone around the Chernobyl nuclear power plant. J Contaminant Hydrology. 1998;35:101–113.
- Nagao S, Rao RR, Killey RWD, Young JL. Migration behavior of Eu(III) in sandy soil in the presence of dissolved organic materials. Radiochimica Acta. 1998;82:205–211.
- Dupré B, Viers J, Dandurand JL, Polve M, Bénézeth P, Vervier P, Braun JJ. Major and trace elements associated with colloids in organic-rich river waters: ultrafiltration of natural and spiked solutions. Chem Geol. 1999;160:63–80.
- Terashima M, Nagao S, Iwatsuki T, Fujitake N, Seida Y, Iijima K, Yoshikawa H. Europium-binding abilities of dissolved humic substances isolated from deep groundwater in Horonobe area, Hokkaido, Japan. J Nucl Sci Technol. 2008;49;805–815.
- Gaillardet J, Viers J, Dupré B. Trace elements in river waters. In: Drever JI, editor. Surface and ground water, weathering, and soils, treatise on geochemistry, Vol. 5. Amsterdam: Elsevier; 2003. p. 225–272.
- Ingri J, Widerlund A, Land M, Gustafsson Ö, Andersson P, Öhlander B. Temporal variations in the fractionation of the rare earth elements in a boreal river; the role of colloidal particles. Chem Geol. 2000:166;23–45.
- Pokrovsky OS, Viers J, Shirokova LS, Shevchenko VP, Filipov AS, Dupré B. Dissolved, suspended, and colloidal fluxes of organic carbon, major and trace elements in the Severnaya Dvina River and its tributary. Chem Geol. 2010:273;36–149.
- Ministry of Land, Infrastructure, Transport and Tourism [Internet]. Mito: Encyclopedia on Kuji River (Kankyou-Hyakka Kuji-Gawa) In: Hitachi Office for River and Road Management of MILT, editor. [c ited 2013 Dec 9]. Available from: http://www.ktr.mlit.go.jp/hitachi/aboutus/pamph/office-pamph-kuji.htm. Japanese.
- Ministry of Land, Infrastructure, Transport and Tourism [Internet]. Water information system. [ cited 23 May 2014]. Available from: http://www1.river.go.jp/cgi-bin/SiteInfo.exe?ID=103011283322100. Japanese.
- Japan Meteorological Agency [Internet]. Meteorological statistics. [ cited 24 May 2014]. Available from http://www.data.jma.go.jp/obd/stats/etrn/index.php. Japanese.
- Matsunaga T, Tsuduki K, Yanase N, Kritsananuwat R, Ueno T, Hanzawa Y, Naganawa H. Temporal variations in metal enrichment in suspended particulate matter during rainfall events in a rural stream. Limnology. 2014;15:13–25.
- Buesseler KO, Bauer JE, Chen RF, Eglinton TI, Gustafsson O, Landing W, Mopper K, Moran SB, Santschi PH, VernonClark R, Wells ML. An intercomparison of cross-flow filtration techniques used for sampling marine colloids: overview and organic carbon results. Marine Chem. 1996;55:1–31.
- Guo L, Santschi PH. A critical evaluation of the cross-flow ultrafiltration technique for sampling colloidal organic carbon in seawater. Marine Chem. 1996;55:113–127.
- Matsunaga T. The fate of several radionuclides derived from atmospheric fallout in a river watershed. In: Markert B, Friese K, editors. Trace elements: their distribution and effects in the environment. Amsterdam: Elsevier; 2000. p. 549–564.
- Hudson N, Baker A, Reynolds D. Fluorescence analysis of dissolved organic matter in natural, waste and polluted waters - Review. River Res Appl. 2007;23:631–649.
- Nagao S, Suzuki Y, Nakguchi Y, Senoo M, Hiraki K. Direct measurement of the fluorescence characteristics of aquatic humic substances by a three-dimensional fluorescence spectrophotometer. BUNSEKI KAGAKU. 1997;46:335–342. Japanese with English abstract.
- Haskin LA, Wildeman TR, Haskin MA. An accurate procedure for the determination of the rare earths by neutron activation. J Radioanalytical Chem. 1968;1:337–348.
- Gromet LP, Dymek RT, Haskin LA, Korotev RL. North American shale composite: its compilation, major and trace element characteristics. Geochim Cosmochim Acta. 1984;48:2469–2482.
- Goldstein SJ, Jacobsen SB. Rare earth elements in river waters. Earth Planet Sci Lett. 1988;89:25–47.
- Sholkovitz ER. Chemical evolution of rare earth elements: fractionation between colloidal and solution phases of filtered river water. Earth Planet Sci Lett. 1992;114:77–84.
- Stevenson FJ. Humus chemistry: genesis, composition, reactions. New York (NY): Wiley-Interscience, 1982. Chapter 11, Spectroscopic approaches, p. 264–284.
- Aiken GR. Dissolved organic matter in aquatic systems. In: Ahuja S, editor. Comprehensive water quality and purification, volume 1: status and trends of water quality worldwide. Amsterdam: Elsevier; 2014. p. 205–220.
- Guéguen C, Burns DC, McDonald A, Ring B. Structural and optical characterization of dissolved organic matter from the lower Athabasca River, Canada. Chemosphere. 2012;87:932–937.
- Jaffé R, Yamashita Y, Maie N, Cooper WT, Dittmar T, Dodds WK, Jones JB, Myoshi T, Ortiz-Zayas JR, Podgorski DC, Watanabe A. Dissolved organic matter in headwater streams: compositional variability across climatic regions of North America. Geochim Cosmochim Acta. 2012;94:95–108.
- Hur J, Williams MA, Schlautman MA. Evaluating spectroscopic and chromatographic techniques to resolve dissolved organic matter via end member mixing analysis. Chemosphere. 2006;63:387–402.
- Japanese Humic Substances Society. Handbook for humic substances analyses. In: Watanabe A, Fujitake N, Nagao S, editors. Nagoya: San-kei-sha; 2007. Japanese. ISBN 978-4-88361-570-4. p. 58–63.
- Singh S, Inamdar S, Mitchell M, McHale M. Seasonal pattern of dissolved organic matter (DOM) in watershed sources: influence of hydrologic flow paths and autumn leaf fall. Biogeochem. 2013;118:321–337.
- Rodríguez-Blanco ML, Taboada-Castro MM, Dieguez-Villar A, Taboada-Castro MT. Metal fluxes from soils to surface waters at the catchment scale. Comm Soil Sci Plant Anal. 2009;40:313–326.
- Haga H, Matsumoto Y, Matsutani J, Fujita M, Nishida K, Sakamoto Y. Flow paths, rainfall properties, and antecedent soil moisture controlling lags to peak discharge in a granitic unchanneled catchment. Water Resour Res. 2005;41:W12410, DOI:10.1029/2005WR004236.
- Matsumoto Y, Nishida K, Haga H, Sakamoto Y. Analysis of the effect of flowpath and the discharge amount of dissolved organic carbon before the storm on the increase and the variation pattern of dissolved organic carbon concentration of spring water during flood events in a forested unchanneled catchment. Proc Hydraulic Eng. 2006:40;1519–1524. Japanese with English Abstract.
- Butturini A, Gallart F, Latron J, Vazquez E, Sabater F. Cross-site comparison of variability of DOC and nitrate c–q hysteresis during the autumn–winter period in three Mediterranean headwater streams: a synthetic approach. Biogeochem. 2006;77:327–349.
- Pourret O, Davranche M, Gruau G, Dia A. Organic complexation of rare earth elements in natural waters: evaluating model calculations from ultrafiltration data. Geochim Cosmochim Acta. 2007;71:2718–2735.
- Xu C, Athon M, Ho YF, Chang HS, Zhang S, Kaplan DI, Schwehr KA, DiDonato N, Hatcher PG, Santschi PH. Plutonium immobilization and remobilization by soil mineral and organic matter in the far-field of the Savannah River Site, U.S. Environ Sci Technol. 2014;48:3186–3195.
- Weishaar JL, Aiken GR, Bergamaschi BA, Fram MS, Fujii R, Mopper K. Evaluation of specific ultraviolet absorbance as an indicator of the chemical composition and reactivity of dissolved organic carbon. Environ Sci Technol. 2003;37:4702–4708.
- Tfaily MM, Hamdan R, Corbett JE, Chanton JP, Glaser PH, Cooper WT. Investigating dissolved organic matter decomposition in northern peatlands using complimentary analytical techniques. Geochim Cosmochim Acta. 2013;112:116–129.
- Maher K, Bargar JR, Brown GE Jr. Environmental speciation of actinides (Review). Inorg Chem. 2013;52:3510–3532.
- Nagao S, Matsunaga T, Suzuki Y, Ueno T, Amano H. Characteristics of humic substances in the Kuji River waters as determined by high-performance size exclusion chromatography with fluorescence detection. Water Res. 2003;37:4159–4170.
Appendix. Interpretation of the ultrafiltration results
The sample solutions, which were already filtered using a 0.2-μm-pore filter, were subjected to ultrafiltration sequentially in the order of 30, 10, and 1 kDa for the nominal molecular cutoff sizes. The measured concentrations of the constituents [(REEs, DOC, chromophores (in terms of ultraviolet absorption), and fluorophores (in fluorescence emission)] were converted to those specific to each fraction using the following formulae:
(1)
(1)
(2)
(2)
(3)
(3) and
(4)
(4) where C[n kDa-retentate (or permeate)] is the analyzed concentration in the retentate (or permeate) after ultrafiltration with an n kDa filter, CF (n kDa-filtration) is the corresponding concentration factor, and S(size component i) is the concentration belonging to size component i. In Equations (1) and (2), the C(30 kDa-permeate) and C(10 kDa-permeate) values were calculated using the following equations:
(5)
(5) and
(6)
(6)
These equations were applied to the optical properties assuming that the properties belonged to specific moieties of dissolved species (e.g., humic substances), and thus were also assumed to be additive.
This additivity was confirmed via a high-performance size-exclusion liquid chromatography (HPSEC) analysis [Citation58]. The ultrafiltration samples from the peak flow stage(stage C) that were used for the REE analysis were also subjected to HPSEC analysis. The associated non-fractionated water sample (filtered only using a 0.2-μm-pore membrane filter) was also included. The elution in the HPSEC analysis was monitored by UV light absorption at 254 nm (UV254). The UV254 data for each ultrafiltration sample were converted to those specific to each fraction according to the above formulae. The converted results are shown in . The gray line corresponds to the sum of all individual fractions, namely the reconstructed UV254 profile for the sample before ultrafiltration. compares this reconstructed profile and that of an actual sample before ultrafiltration. The two profiles were similar to each other. This proximity suggests that the optical properties (UV254) of the fractions obtained by following ultrafiltration are additive.
Figure A1. HPSEC profiles for the different fractions of river water obtained after ultrafiltration. The gray line (reconstructed) is a calculated profile as a sum of each size fraction profile by assuming that they are additive. HPSEC analysis conditions were as follows: column, Hitachi GL-W530; buffer solution, 0.01M Tris-HCl including 0.01 M NaCl, adjusted to pH 8.0. Details regarding methods were found in [Citation57].
![Figure A1. HPSEC profiles for the different fractions of river water obtained after ultrafiltration. The gray line (reconstructed) is a calculated profile as a sum of each size fraction profile by assuming that they are additive. HPSEC analysis conditions were as follows: column, Hitachi GL-W530; buffer solution, 0.01M Tris-HCl including 0.01 M NaCl, adjusted to pH 8.0. Details regarding methods were found in [Citation57].](/cms/asset/4e6f665e-d6f3-4361-8118-da123b1f2207/tnst_a_961989_f0011_c.jpg)
Figure A2. Comparison of the reconstructed HPSEC profile and the profile of the actual water sample before ultrafiltration. The Dando fulvic acid profile [Citation47] is also shown for qualitative comparison.
![Figure A2. Comparison of the reconstructed HPSEC profile and the profile of the actual water sample before ultrafiltration. The Dando fulvic acid profile [Citation47] is also shown for qualitative comparison.](/cms/asset/565dfcbb-49fd-4b84-b517-3d384bc66794/tnst_a_961989_f0012_c.jpg)
In , the HPSEC profile of the Dando fulvic acid reference [Citation47] is also shown for comparison. The major peaks were found to be in agreement, suggesting that the sampled river water consisted of fulvic-acid-like organic substances.