
Abstract
Bulk samples of hafnium (Hf) hydride and deuteride were prepared and the thermal properties, heat capacity (CP) and thermal conductivity (κ) were measured. In the CP–temperature curves for both samples, typical lambda-type peaks were observed at around 350 K, which was due to the second-order phase transition from the δ′-phase to the δ-phase. In Hf hydride, it is considered that the δ′-phase and the δ-phase consist of regularly arranged and randomly arranged hydrogen atoms, respectively. Therefore, it can be said that the δ′/δ phase transition observed in both Hf hydride and deuteride is an order–disorder phase transition. The values of κ as well as CP changed significantly at around the phase transition temperature.
1. Introduction
Boron carbide (B4C) is currently used as a neutron control material in fast reactors. However, the lifetime of the B4C control rod is restricted mainly by pellet-cladding mechanical interaction failure due to helium gas swelling, which is caused by the nuclear reaction of 10B(n,α)7Li. Recently, hafnium (Hf) hydride has been a focus of attention as an advanced neutron control material [Citation1,2]. Since hydrogen can moderate fast neutrons and Hf has a large capture cross section for thermal neutrons, Hf hydride would be an effective neutron control material in fast reactors. In addition, no helium gas is produced during neutron absorption in Hf because the nuclear reaction is expressed as 177Hf(n,γ)178Hf(n,γ)179Hf(n,γ)180Hf. Furthermore, since the daughter nuclides 178Hf and 179Hf also have large cross sections for thermal neutron capture as well as the parent nuclide 177Hf, long lifetime of the control rod of more than 40 years can be expected [Citation1,2].
When utilizing Hf hydride as a neutron control material, the thermal properties such as the heat capacity (CP) and thermal conductivity (κ) need to be understood. A few data on the thermal and thermomechanical properties of Hf hydride have been reported [Citation3,4]. On the other hand, a phase transition between the δ′-phase and the δ-phase has been observed at around 350 K for Hf hydride (HfHx, x = ∼1.6) [Citation5], and thus the behavior of CP and κ would change significantly below and above the phase transition temperature. Here, the purpose of the present study is to understand the phase transition in detail and to reveal its effect on CP and κ of Hf hydride and deuteride. The reason why we covered not only Hf hydride but also deuteride is that the thermal properties and phase state of Hf deuteride have been scarcely studied. Note that the prime objective of the present study is to investigate and collect the fundamental physical properties of Hf hydride and deuteride, in order to contribute to practical application of Hf hydride neutron control rod in fast reactors. Bulk samples of Hf hydride and deuteride were fabricated and their temperature dependences of CP and molar volume were measured to understand the phase transition mechanism. As for Hf deuteride, κ was also evaluated at around the phase transition temperature.
2. Experimental
Bulk samples of Hf hydride and deuteride were directly prepared from Hf metal with 99.9% purity in a Sieverts’ apparatus. The sample sizes were generally 10 mm×10 mm×1 mm for thermal diffusivity (α) measurement and 2 mm×2 mm×0.5 mm for CP measurement. First, the samples were introduced into the Sieverts’ apparatus. After evacuating in the apparatus below the pressure of 8×10⁻⁶ Pa, the samples in the reaction chamber were heated up to 1173 K with a rate of temperature increase of approximately 200 K/h and kept at that temperature for 24 hours for degassing. Then, appropriate amount of pure hydrogen (7N) or deuterium (5N) gas was passed through a liquefied nitrogen tarp and held in the reserve tank, followed by slowly introduced over several days to the reaction chamber which was kept at 1073 K. After introducing the appropriate amount of the hydrogen or deuterium gas in the reserve tank, the temperature of the reaction chamber fell to room temperature very slowly with a rate of temperature decrease of approximately 20 K/h in order to prevent the sample's pulverization.
The phase structure of the samples was investigated using powder X-ray diffraction (XRD) with Cu-Kα radiation at room temperature. Crystallographic orientation measurement was performed using a field emission type scanning electron microscope equipped with an electron backscatter diffraction system. The sample density (d) was calculated from the weight and dimensions. Values of the hydrogen isotope content in Hf hydride and deuteride, i.e., x in HfHx and HfDx, were determined from the weight change before and after hydrogenation.
CP was measured up to 673 K using two apparatuses. From approximately 1.9 K to room temperature, CP was measured based on a relaxation calorimetry technique by using Physical Properties Measurement System (Quantum Design, Inc.), while above room temperature a differential scanning calorimeter (DSC) was used. In the DSC measurement, sapphire was used as the standard material. In order to evaluate the temperature dependence of molar volume, high-temperature XRD analysis was carried out in a helium gas flow atmosphere. The measurements were performed at 5 K steps from room temperature to 380 K. As for Hf deuteride, α was measured from room temperature to 420 K under vacuum using the laser flash method. The value of κ was then calculated based on the relationship κ = α×CP×d.
3. Results and discussion
From the weight change before and after hydrogenation, the sample compositions were determined to be HfH1.63, HfD1.53, and HfD1.60. The hydrogen isotope content was also evaluated from the measured pressure change during hydrogenation, and it was confirmed that the values determined using both methods were in good agreement with each other.
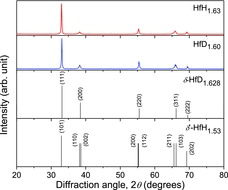
shows the XRD patterns of the samples of HfH1.63 and HfD1.60, in which the peak positions corresponding to the δ′-phase HfH1.53 [Citation6] and the δ-phase HfD1.628 [Citation6] are shown for comparison. According to the Hf–H binary phase diagram [Citation7], in the hydrogen content range around 1.6, there exist two phases, viz., the δ′-phase and the δ-phase. The δ′-phase is stable at around room temperature, while the δ-phase is stable at higher temperatures. When the hydrogen content H/Hf is around 1.6, the δ-phase is stable above approximately 373 K [Citation7]. It is well known that both the δ′-phase and the δ-phase of Hf hydride have a defect anti-fluorite structure. However, the crystal system is different, i.e., tetragonal with c/a < 1 for the δ′-phase [Citation8] and cubic for the δ-phase. In the XRD patterns of the samples, no peaks other than the peaks associated with Hf hydride and deuteride were observed.
Figure 1. XRD patterns of the samples of HfH1.63 and HfD1.60, together with the peak positions corresponding to the δ′-phase HfH1.53 and the δ-phase HfD1.628.
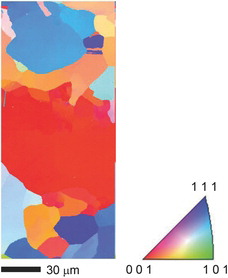
shows a typical example of the crystal orientation map obtained for the HfD1.53 sample. It was confirmed that (1) there were no apparent crystalline orientations; (2) the sample contained no remarkable microcracks or voids; and (3) the grain sizes were around 30 μm. Similar results were obtained for other samples with different compositions. Thus it can be said that the samples prepared in the present study were isotropic polycrystalline high-quality materials.
Figure 2. Crystal orientation map obtained for the HfD1.53 sample.
shows the XRD pattern of the HfD1.60 sample in the 2θ range from 60° to 80°. At around 2θ = 67°, the (211) and (103) peaks were clearly observed. As can be seen in the peak positions of the δ′-phase HfH1.53 (), there exist two adjacent peaks at around 2θ = 38° and 67°. It is considered that this peak separation is caused by the shrinking of the crystal lattice along the c axial direction, and thus this would be a typical evidence of formation of the δ′-phase. It was confirmed from the XRD measurement that the HfD1.60 sample was the δ′-phase. On the other hand, in the XRD pattern of the HfH1.63 sample, such clear peak separation was not confirmed.
Figure 3. XRD pattern of the HfD1.60 sample in the 2θ range from 60° to 80°.
shows the temperature dependence of CP of the samples of HfH1.63 and HfD1.60. In the CP–temperature curves for both samples, typical lambda-type peaks were observed at around 350 K, which was due to the second-order phase transition from the δ′-phase to the δ-phase. Although it was not confirmed from the XRD analysis that the HfH1.63 sample was the δ′-phase, the CP result supported that the HfH1.63 sample was the δ′-phase at room temperature and with increasing temperature it underwent the phase change to the δ-phase. The peak positions for HfH1.63 and HfD1.60 were 320 and 360 K, respectively. Based on the Hf–H phase diagram [Citation7], the higher hydrogen content leads to a lower phase transition temperature. In the present case, however, it is not clear whether the difference in the phase transition temperature observed in HfH1.63 and HfD1.60 is caused by the difference in the hydrogen isotope content or the isotope effect. It is thought that the larger CP of HfD1.60 than that of HfH1.63 is caused by the difference in the frequencies of hydrogen and deuterium in the vibration term for the optical mode [Citation9]. At 600 K, the CP value of the δ-phase HfH1.63 was 53 J mol−1 K−1, which was slightly larger than the theoretically calculated value (48 J mol−1 K−1) of the δ-phase HfH1.73 [Citation10]. One of the reasons for this difference is an electronic contribution to CP, which has not been taken into consideration in the theoretical calculation. On the other hand, Arita et al. [Citation5] reported a CP value of approximately 40 J mol−1 K−1 at 600 K for the ϵ-phase HfH1.83, which was significantly lower than the CP value of the δ-phase HfH1.63 obtained in the present study. Further investigation is needed to clarify the reason for this difference.
Figure 4. Temperature dependence of heat capacity (CP) of the samples of HfH1.63 and HfD1.60.
shows the temperature dependence of the molar volume of HfH1.63 and HfD1.60, obtained from high-temperature XRD measurements. It can be seen that the molar volume of both HfH1.63 and HfD1.60 changed continuously during the phase transition. This is a typical evidence of the second-order phase transition. Since no significant volume change occurs, the cladding tubes of the Hf hydride neutron control rod are hardly subjected to stress from the Hf hydride pellets during the phase transition.
Figure 5. Temperature dependence of the molar volume of HfH1.63 and HfD1.60.
There exist various examples of the second-order phase transition, including conducting–superconducting transition in metals at low temperatures, order–disorder transitions in alloys, the onset of ferromagnetism, and the fluid–superfluid transition of liquid helium. In the hydrides of group IV elements, ZrHx and TiHx, an order–disorder phase transition has been observed, in which a phase containing regularly arranged hydrogen atoms transforms to a phase containing randomly arranged hydrogen atoms with increasing temperature [Citation11]. It is well known that the δ-phase Hf hydride has a defect anti-fluorite crystal structure with randomly arranged hydrogen atoms. On the other hand, the distribution state of hydrogen atoms in the δ′-phase Hf hydride has yet to be completely revealed. Nonetheless, it is considered that the δ′/δ phase transition in Hf hydride and deuteride observed in the present study is an order–disorder transition similar to those observed in ZrHx and TiHx.
Finally, the effect of the phase transition on κ of Hf deuteride is discussed. As for Hf hydride, the samples for CP and α measurements with almost the same hydrogen content could not be obtained. Thus, the α measurement was performed only for Hf deuteride. shows the temperature dependences of α, CP, d, and κ of the HfD1.60 sample. The temperature dependence of d was evaluated from the temperature dependence of molar volume. Here, the temperature range was set to be from room temperature to 420 K, because the phase transition temperature determined from the CP measurement was 360 K. In calculating κ using the equation κ = α×CP×d, the numerical data obtained by fitting the experimental results for α, CP, and d were used. As can be seen in , α and d changed continuously during the phase transition. Thus, a lambda-type peak observed in the κ–temperature curve was caused by the temperature dependence of CP. Although a smooth curve is drawn in the temperature dependence of α, there is a possibility that a part of heat given by laser shot may be consumed by the phase transition. Actually, a small peak can be seen in the α vs. T curve around the phase transition temperature. The δ-phase showed lower κ values than those of the δ′-phase. One possible reason for this is the random arrangement of hydrogen atoms in the δ-phase. To clarify the magnitude relationship in κ between the δ′-phase and the δ-phase, the electrical conductivity should be measured because not only phonons but also electrons carry heat. In addition, to understand the mechanism of the phase transition, further investigations about reversibility and kinetics are needed.
Figure 6. Temperature dependences of thermal diffusivity (α), heat capacity (CP), density (d), and thermal conductivity (κ) of the HfD1.60 sample.
4. Summary
In this study, bulk samples of Hf hydride and deuteride, HfHx and HfDx, x = ∼1.6, were prepared and their thermal properties were investigated. From the temperature dependences of CP and the molar volume, it was found that the second-order phase transition existed in both Hf hydride and deuteride at around 350 K. It is considered that this transition is one of the order–disorder phase transition of hydrogen isotope atoms in the crystal lattices of Hf hydride and deuteride. Not only CP but also κ showed a lambda-type peak in its temperature dependence. The δ-phase with randomly arranged hydrogen isotope atoms showed lower κ values than those of the δ′-phase with regularly arranged ones. The results obtained in this study will provide essential basic information when Hf hydride is used as control rods in future fast reactors.
Acknowledgements
The present study includes results from “Development Study of Fast Reactor Core with Hydride Neutron Absorber” entrusted to Tohoku University by the Ministry of Education, Culture, Sports, Science and Technology of Japan (MEXT).
References
- Konashi K, Yamawaki M. Utilization of hydride materials in nuclear reactors. Adv Database Technol. 2010;73:51–58.
- Tahara Y, Iwasaki T, Konashi K. Development of hydride absorber for fast reactor – evaluation of design method for hydride absorber rod. J Nucl Sci Technol. 2010;47:421–429.
- Ito M, Kurosaki K, Muta H, Uno M, Konashi K, Yamanaka S. Thermal conductivity of hafnium hydride. J Nucl Sci Technol. 2009;46:814–818.
- Ito M, Kurosaki K, Muta H, Uno M, Konashi K, Yamanaka S. Thermomechanical properties of hafnium hydride. J Nucl Sci Technol. 2010;47:156–159.
- Arita Y, Ogawa T, Tsuchiya B, Matsui T. Heat capacity measurement and DSC study of hafnium hydrides. J Therm Anal Cal. 2008;92:403–406.
- International Centre for Diffraction Data, Joint Committee on Powder Diffraction Standards Card No. 07-0368 (HfH1.53), No. 07-0368 (HfH1.628).
- Massalski TB, Okamoto H, Subramanian PR, Kacprzakk L, editors. Binary alloy phase diagrams. 2nd ed. Materials Park (OH): ASM International; 1990.
- Sidhu SS, McGuire JC. An X-ray diffraction study of the hafnium–hydrogen system. J Appl Phys. 1952;23:1257–1261.
- Yamanaka S, Yamada K, Kurosaki K, Uno M, Takeda K, Anada H, Matsuda T, Kobayashi S. Thermal properties of zirconium hydride. J Nucl Mater. 2001;294:94–98.
- Wang H, Konashi K. Investigation on electronic, mechanical and thermal properties of Hf–H system. J Nucl Mater. 2013;443:99–106.
- Yakel HL Jr. Thermocrystallography of higher hydrides of titanium and zirconium. Acta Crystallogr. 1958;11:46–51.