
 ?Mathematical formulae have been encoded as MathML and are displayed in this HTML version using MathJax in order to improve their display. Uncheck the box to turn MathJax off. This feature requires Javascript. Click on a formula to zoom.
Abstract
A new calculational model of detector sensitivity, which is defined as the ratio of electric current to neutron flux, for self-powered neutron detector (SPND) is presented in this paper. Since Warren developed a sensitivity calculation model based on a multi-step analytic approach in 1972, there have been a lot of researches aimed at improving the accuracy of his model by partially employing Monte Carlo (MC) simulations in some of the calculation steps. However, there still exist assumptions such as mono-energy neutron in those models which could increase the uncertainty of the calculated detector sensitivity. In this paper, a new model which overcomes those limitations is developed by adopting the MC method more thoroughly and thereby reducing the number of calculation steps. The verification of the new method has been performed by comparing the results against the ones from the existing methods and measured data. A detailed analysis of SPND depletion by ORIGEN-S and BETA-S codes has shown that the proposed model can predict accurately the measured depletion data in a commercial pressurized water reactor (PWR) plant.
1. Introduction
A self-powered neutron detector (SPND) is a widely used device for detecting neutron fluxes inside reactor cores. SPND is generally installed inside a reactor core and does not require an external power source since electrons can be generated by the interaction between neutrons and neutron-sensitive material called emitter such as rhodium and vanadium. Since SPND detects neutron fluxes and produces electric current, the “detector sensitivity” is used to translate the measured electron current to the neutron flux. In 1972, H.D. Warren introduced a way to calculate the detector sensitivity of SPND [Citation1–3]. He used an analytic form of equations in his sensitivity calculation which requires many assumptions for simplifications. These, however, are potential sources of inaccuracy of his model. There are at least five major assumptions or steps in his model: mono-energy neutrons, space-charge effect, self-shielding factor, beta-decay electron spectrum, and electron escape probability. Since his model was introduced, there have been efforts to improve the accuracy of his model by taking advantage of the accuracy of the Monte Carlo (MC) simulation in some of the steps. Goldstein used the MC method to calculate beta-escape probability and photon reactions [Citation4]. Lee used the MC method to calculate beta-escape probability and self-shielding factor [Citation5]. However, they still used the other three assumptions: mono-energy neutron, space-charge effect, and beta-decay electron spectrum.
In this paper, a new improved sensitivity calculation model which exploits MCNP6 code more thoroughly is introduced [Citation6]. The BETA-S code is also used to calculate the beta-decay electron spectrum and the ORIGEN-S is used to perform detector depletion calculations [Citation7,8]. There still exists the space-charge effect assumption in this model due to the fact that MCNP does not support the physics model for the electric charge effects. The detector sensitivity results of the new model are compared against those from Warren, Goldstein, and Lee's models, and also with the Electric Power Research Institute (EPRI)-measured depletion data of the rhodium detector depletion in a commercial pressurized water reactor (PWR) [Citation9].
2. Detector sensitivity calculation model
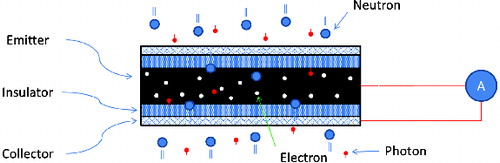
The SPND is an in-core device which detects the neutron flux and produces electric current. It consists of three parts as shown in : emitter, insulator, and collector. The electrons are emitted from emitter materials and detected at the collector. The insulator divides the emitter and collector materials, and the electrons move from emitter to collector through the insulator. The amount of detected electrons, i.e., electric current, depends on the level of neutron fluxes at the detector location and characteristics of the detector called “detector sensitivity” which is defined as
(1)
(1)
Figure 1. Configuration of SPND.
Electrons can be generated by beta-decay or photon reaction in SPND. shows the calculation flow of the Warren model. Steps 1–3 are for the beta-decay electrons, and step 4 is for the photon reaction electrons.
Figure 2. Calculation flow of detector sensitivity.
2.1. Warren model
Warren developed a calculation model for SPND [Citation1–3]. The electric current by beta-decay was calculated as in the following, the components of which were calculated during steps 1–3:
(2)
(2) where e is the electronic charge, A is the emitter cross section, ϵβ is the electron escape efficiency considering the effect of attenuation, Rβ is the beta-decay reaction rate, and ϵE is the electron escape efficiency considering the electric field by space-charge effect. Step 1 in is to calculate the beta-decay rate. Warren assumed that the absorption reaction rate is equal to the beta-decay rate. This assumption is valid for short-half-life isotopes. And the geometry self-shielding effect was accounted for using the neutron self-shielding factor f:
(3)
(3) and
(4)
(4) where Ra is the neutron absorption reaction rate, φ is the flux at the outer boundary of emitter, ∑t is the total cross section, and re is the radius of the emitter. The generated electrons should escape the emitter to be detected. There are two physics models needing consideration between the electron generation in the emitter and the detection in the collector: the electron attenuation in the emitter and the space-charge effect in the insulator. The step 2 in is to calculate the electron attenuation effect in the emitter material which is called escape efficiency:
(5)
(5) where C(E) is the beta energy spectrum distorted by the loss of electron energy within the emitter. Step 3 is to calculate the effect of space charge. The electrons are captured within the insulator at crystal imperfections and impurity sites. These captured electrons generate an electric field in such a way that low-energy electrons from the emitter material are repelled back to the emitter. The electric field distribution can be expressed as follows:
(6)
(6) where A is a constant depending on the insulator type, r is the radial distance from the center of the emitter, ri is the outer radius of the insulator, and k is defined as the ratio of re/ri. A critical distance r0 is defined in Equa- tion (7), which means the point where the direction of electric force switches from the inward direction to the outward direction:
(7)
(7)
Warren's model uses a table to calculate the minimum energy requirement of electrons to pass the critical distance. His model accounts for the space-charge effect by multiplying an additional factor which is tabulated as a function of k and electron kinetic energy [Citation10]. The electric current by photon reactions was calculated by the following equation:
(8)
(8) where Pi is the amount of electrons generated by the photon reaction i. ϵβ, i and ϵE, i are the electron escape efficiencies considering the attenuation and space-charge effect for the photon reaction i. The photon reaction i contains a single Compton event, photoelectric, and internal conversion. Each photon reaction has to be treated with a different equation. The detailed method to calculate Pi is explained in Warren's paper [Citation2].
There are seven weaknesses of Warren's calculation model:
Mono-energy neutrons of 0.0253 eV are used to calculate the absorption reaction rate.
The self-shielding factor is calculated by an analytic equation which is derived from assumptions.
The beta-decay rate is assumed to be the same as the absorption reaction rate.
The simplified form of the beta-decay spectrum equation is used to calculate the electron escape efficiency.
The electron escape efficiency is calculated by an analytic equation which is derived from assumptions.
The space-charge effect is considered in an inaccurate way.
The photon reactions were considered by analytic equation.
2.2. New model based on Monte Carlo simulation
In this section, a newly proposed MC-based detector sensitivity calculation model will be presented to overcome the weaknesses of Warren's model identified in the previous section. In the new model, continuous-energy neutrons are used to calculate the absorption reaction rate, and the BETA-S code is used to obtain a beta-decay electron spectrum and to calculate the beta-decay to absorption ratio [Citation7]. The way to calculate the beta-decay to absorption ratio is explained in Section 4.1. shows the comparison of the calculation models.
Table 1. Comparison of calculation models.
The proposed model considers not only the beta-decay sensitivity but also the photon reaction sensitivity as follows:
(9)
(9) where Iγ is the electric current from photon reaction, Iβ is the electric current by beta-decay, and φouter is the neutron flux at the outer boundary of the emitter. The details of new model are presented in the following subsections.
2.2.1. Beta-decay electron sensitivity calculation model
Unlike Warren's model, the new method can take into account both the electron escape probability and the space-charge effect at the same time through MC simulation:
(10)
(10) where ϵ is the electron escape probability, D is the ratio of beta-decay to neutron absorption, and i is the emitter ring index. Since MCNP6 does not support the beta-decay rate tally, it is proposed in this paper to use an approximate approach as
(11)
(11) where Rβ is the beta-decay rate. The ratio of beta-decay rate to neutron absorption rate is determined with the steady-state assumption for short-half-life isotopes. The neutron absorption reaction of Rh-103 will generate beta-decay electrons with a half-life of 40 seconds, as indicated in .
Figure 3. Rhodium decay chain.
The absorption rate and beta-decay rate of each nuclide can be expressed with steady-state assumption as in Equation (12). Due to the short half-life, the neutron absorption rate and the beta-decay rate will be saturated in a short time:
(12)
(12) and
(13)
(13) where DAX is the decay rate of nuclide AX, RAXa is the absorption rate of nuclide AX. As in , the amount of Rh-103 is much larger (by more than 1000 times) than the rest. Therefore, the ratio of beta-decay rate to neutron absorption rate of rhodium was set to 1:
(14)
(14)
Figure 4. Cobalt decay chain.
Figure 5. Configuration of SPND calculation model.
Figure 6. Configuration of emitter tally region and initial source distribution for the tally cell 3.
Figure 7. Normalized intensity distributions.
Figure 8. Rhodium composition change during 10.5 years.
In the case of vanadium, the decay chain is very simple. Absorption reaction of V-51 becomes V-52, and V-52 will emit electrons with a half-life of 3.76 minutes. Therefore, the ratio of beta-decay rate to neutron absorption rate of vanadium is 1. shows the decay chain of cobalt.
Unlike rhodium, cobalt has long-half-life precursors such as Co-60. The half-life of Co-60 is 5.26 years. Due to this long-half-life precursor, the steady-state assumption is not valid. However, the effect of a long-half-life precursor can be ignored if the amount of that isotope is negligible. Since the amount of the long-half-life precursor is small at the initial state, the beta-decay to neutron absorption rate was determined without a long-half-life precursor, as follows:
(15)
(15)
Only 0.24% of Co-60m emits beta particles as shown in . Therefore, the ratio of beta-decay rate to neutron absorption ratio is only 0.0024 for Co-59. This beta-decay to neutron absorption ratio is valid for fresh cobalt. If it is depleted cobalt, the effect of a long-half-life precursor should be considered. This further consideration is explained in Section 4.1.
2.2.2. Absorption reaction rate
The absorption reaction rate is calculated with pin geometry as in . Since the SPND is positioned inside an assembly, the initial source should be located far from the outer radius of pin. The initial neutron source energy should be the same as the energy spectrum of PWR assembly. The emitter region is subdivided into several tally rings. As a result of the MC simulation, the absorption reaction rate and flux for each subdivided ring will be tallied.
2.2.3. Electron escape probability
The electron escape probability varies depending on the position of electrons in the emitter material. The electron at the center of the emitter will have a lower escape probability than the electron at the outer region of the emitter. Through the MC simulations, the electron escape probability, ϵi, is calculated for each tally ring i. shows the sub-divided emitter region for the tally. The red region represents the initial location of source electrons. The initial source is positioned at tally cell 3. The result will be the electron escape probability for tally cell 3. In order to calculate the electron escape probability for each tally cell, the calculation will be repeated for each tally cell.
The space-charge effect is taken into account with the consideration of the critical distance and an energy cut-off option of MCNP6. The electrons which pass the critical distance will be collected at the collector and contribute to the detector current signals in a real situation due to the electric field caused by the space-charge effect. In the MCNP6 simulation, however, even the electrons which already passed the critical distance can be reflected back to the emitter or absorbed before it reaches the collector region since the MCNP code does not support the physics of the electric field effect. Therefore, the electrons tallied at the critical distance in the MCNP6 model is regarded as the electrons which contribute to the detector signals. On the other hand, the electrons with energy lower than the minimum energy required should not contribute to the detector signals, which are modelled with the energy cut-off option of MCNP6.
2.2.4. Photon reaction sensitivity calculation model
Electrons can be emitted not only from beta-decay but also from photon reaction. The electric current from photon reactions can be calculated as follows:
(16)
(16) where Tphoton is the total amount of detected electrons emitted from photon reactions. The Tphoton can be tallied during the absorption reaction rate tally through MCNP6 simulations which support both photon and electron particle physics and their interactions.
3. Initial detector sensitivity calculations
The detector sensitivity calculations are performed for three emitter materials: rhodium, vanadium, and cobalt. The outer diameter of emitter is 0.0508 cm and the outer diameter of collector is 0.259 cm. The thickness of the insulator is 0.0254 cm and the length of emitter is 40 cm. The specification of SPND is summarized in . The energy spectra of electrons from beta-decay of rhodium, vanadium, and cobalt are shown in . The maximum energy of rhodium and vanadium is around 2.5 MeV, and the average is about 1 MeV. In the case of cobalt, the maximum energy is 1.5 MeV and the average is under 0.5 MeV.
Table 2. SPND specifications.
3.1. Mono-energy neutron calculation
In this section, the sensitivity calculations are performed first with mono-energy neutrons for consistent comparisons since other published sensitivity calculation models also used mono-energy neutrons. The neutrons of 0.0253 eV are used as sources for the calculation of neutron absorption reaction rates. shows the mono-energy sensitivity calculation results.
Table 3. Mono-energy sensitivity calculation results.
The experimental data which are used for the validation were measured by YGN 3 and NRX [Citation5,Citation11]. The NRX-measured data and YGN 3-measured data show the difference, since the measured data was calibrated by cadmium to take out epithermal and fast neutron contributions. The energy spectrum of neutron also affects the calibration results. Therefore, the measured data has some uncertainty due to the calibration. shows the comparison results with other models and measured data. The calculation results match the results of other models and measured values well.
Table 4. Mono-energy sensitivity comparison result.
3.2. Continuous-energy neutron calculation
In this section, the detector sensitivity calculation results are presented with continuous-energy neutron sources. The measured sensitivity is calibrated with cadmium to eliminate the fast neutron effect. Therefore, the continuous-energy calculation model should also eliminate the fast neutron effect for consistent comparison, which is realized by tallying the absorption reactions caused by neutrons only with 0–1 eV energies during the MC simulations. presents the comparisons of the continuous-energy results and mono-energy results.
Table 5. Sensitivity comparisons of continuous-energy model and mono energy model.
The continuous-energy results should be more accurate than the mono-energy results. However, the continuous-energy results and mono-energy results show similar accuracy. That is because the measured data was calibrated for the mono energy. However, it should be noted that the continuous-energy calculation is more reliable than the mono-energy calculation since the continuous energy is more proper in terms of physics.
4. Depletion calculation
The ORIGEN-S in SCALE code package is used for the depletion calculation of detector materials. It is assumed that the detectors are used for 10.5 years. To irradiate the emitter material of detectors, the information of neutron flux during irradiation is necessary. The average flux is calculated for a general assembly in a nuclear reactor. shows the depletion specification. A CE-type 16 × 16 assembly is used as a reference assembly model. The initial uranium enrichment is 4.0 wt%. The total mass of uranium was assumed to be 431,362 kg. The fuel assembly is irradiated for 4.5 years so that total burnup is to be 60 MWD/kg U. Through this depletion calculation, the average neutron flux was calculated as 4.1 × 10¹³/cm2 sec. The average flux is used to deplete each detector for 10.5 years.
Table 6. Depletion specification.
4.1. Beta-decay to neutron absorption ratio for depleted SPND
The beta-decay to neutron absorption ratio is calculated by Equation (11). It considers only short-half-life precursors. In other words, it is assumed that the long-half-life precursors do not decay. This assumption is valid at the initial state since the number density of long-half-life precursor is small. However, the number density of the long-half-life precursor such as Co-60 increases as the irradiation time increases. The effect of Co-60 is not small even though it has a long half-life. Therefore, the beta-decay to neutron absorption ratio is modified to consider the effect of a long-half-life precursor. The modified beta-decay to neutron ratio, Dt, is as follows:
(17)
(17) where Di is the beta-decay to neutron absorption ratio at the initial state and Ftarget is the beta-decay intensity fraction of the target nuclide. In case of cobalt, the target nuclide is Co-60m.
4.2. Rhodium depletion
In the case of rhodium SPND, almost all electrons are emitted from Rh-103 absorption reaction. After 10.5 years, more than 90% of Rh-103 is depleted. It means that the sensitivity of rhodium SPND after 10.5 years decreases to 10% of its initial value. shows the composition changes in the emitter material. The mass of Rh-103 decreases as it depletes.
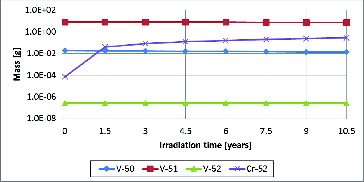
4.3. Vanadium depletion
In case of vanadium SPND, almost all electrons are emitted from V-51. Unlike the rhodium SPND, the amount of vanadium changes only 3% over 10.5 years. It means that the sensitivity of vanadium SPND changes only 3% over 10.5 years compared to its initial sensitivity. shows the composition changes in the vanadium emitter.
Figure 9. Vanadium composition change during 10.5 years.
4.4. Cobalt depletion
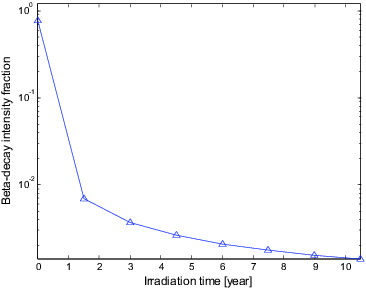
In the case of cobalt SPND, almost all electrons are emitted from Co-59. The amount of cobalt changes 20% after 10.5 years. shows the composition changes in the emitter material. Since the half-life of Co-60 is 5.26 years, the amount of Co-60 increased. The beta-decay intensity fraction of Co-60m is shown in . The beta-decay intensity was introduced to consider the effect of long-half-life precursors and can be calculated by Equation (17). As in , the fraction decreases is because of Co-60. As time goes on, the amount of Co-60 increases which is a beta-decay precursor.
Figure 10. Cobalt composition change during 10.5 years.
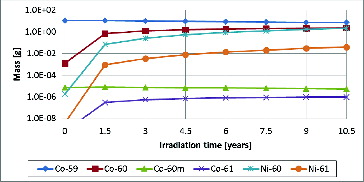
Figure 11. SPND beta intensity fraction.
4.5. Depletion calculation result
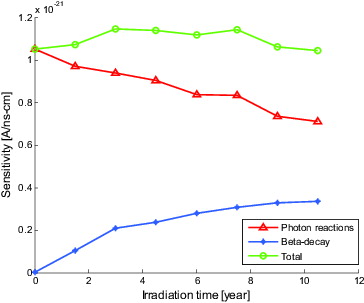
shows the 10.5-year depletion results of rhodium, vanadium, and cobalt SPNDs. The sensitivity of rhodium decreases rapidly compared with the other SPNDs. The vanadium SPND maintains its initial sensitivity without a noticeable loss. It is noted that the sensitivity of the cobalt detector increases over the depletion which is attributed to the fact that the delayed beta source increases over the depletion as shown in . The beta-decay electrons increase because of the cumulated Co-60, and the photon sensitivity decreases since the Co-60 and Ni-60 have a smaller absorption cross section than Co-59.
Figure 12. SPND depletion calculation results during 10.5 years.
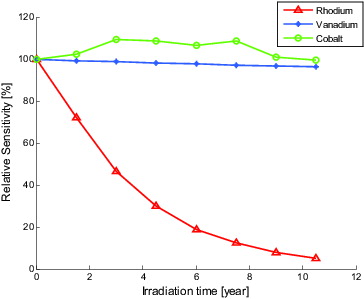
Figure 13. Sensitivity of cobalt SPND during 10.5 years.
4.6. Comparison with measured data
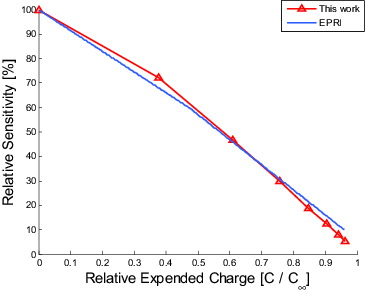
The rhodium SPND depletion result was compared with experimental results in the EPRI report [Citation9]. The experiment was performed by Babcock & Wilcox (B&W). The sensitivity of the rhodium detector was measured 179 times during cycles 2 through 6. The measured relative sensitivity data are given as a function of expended charge.
(18)
(18) and
(19)
(19) where m is the emitter mass and L is emitter length. Since the measured data is given as a function of expended charge, the expended charge is calculated with the density as follows for the comparison:
(20)
(20)
shows the comparison results of this study with EPRI-measured data. The calculated results match the EPRI data well.
Figure 14. Rhodium SPND sensitivity depletion comparisons.
5. Conclusion
A new MC-based computational model for SPND sensitivity prediction is proposed in this paper. There are two main differences between the proposed model and old models. The first one is that the proposed model can employ not only mono-energy neutron but also continuous-energy neutrons. The second one is that the proposed model uses the BETA-S code for an accurate energy spectrum of delayed electron sources. The BETA-S code can generate the beta-decay energy spectrum and beta-decay intensity of each isotope. Therefore, the proposed model can account for the effect of long-half-life precursors correctly, which is important for detector depletion calculation.
The verification work is performed first with mono-energy neutron for consistent comparisons since other models use mono-energy neutrons. The differences of predicted sensitivities between proposed model and other models are around 10%. The calculated detector sensitivity with continuous-energy neutron sources shows 30%–40% lower values than the ones with the mono-energy neutron sources. The difference between measured data and the calculation data was 9%–40%. The energy of the mono-energy neutron case was 0.0253 eV and the energy range of continuous-energy case was 0–1 eV. For consistent comparison with measured detector signals, one should be cautious about the selection of neutron energies and how the measured detector data are calibrated.
The SPND depletion calculation is performed for 10.5 years with the flux of 4.1 × 10¹³ #/cm2-sec, which is a typical value of PWR. For the verification of the rhodium depletion calculation, the results are compared against the measured data from a commercial PWR in EPRI report. The comparison of relative sensitivity shows a good agreement of 10% difference over the 10.5-year depletion.
Additional information
Funding
References
- Warren HD. Calculational model for self-powered neutron detector. Nucl Sci Eng. 1972;48:331–342.
- Warren HD, Shah NH. Neutron and gamma-ray effects on self-powered in-core radiation detectors. Nucl Sci Eng. 1974;54:395–414.
- Warren HD, Shah NH. Performance of prompt- and delayed-responding self-powered in-core neutron detectors in a pressurized water reactor. Nucl Sci Eng. 1984;86:1–9.
- Goldstein NP. A Monte-Carlo calculation of the neutron sensitivity of self-powered detectors. IEEE Trans Nucl Sci. 1973;20:549–556.
- Lee W, Cho G, Kim K, Kim HJ, Choi Y, Park MG, Kim S. A study on the sensitivity of self-powered neutron detectors (SPNDs). IEEE Trans Nucl Sci. 2001;48:1587–1591.
- Goorley T, James M, Booth T, Brown F, Bull J, Cox LJ, Durkee J, Elson J, Fensin M, Forster RA, Hendricks J, Hughes HG, Johns R, Kiedrowski B, Martz R, Mashnik S, Mckinney G, Pelowitz D, Prael R, Sweezy J, Waters L, Wilcox T, Zukaitis T. Initial MCNP6 release overview-MCNP6 version 1.0. LA-UR-13-22934. LANL; 2013.
- Gauld IC, King SG. BETA-S: a code to calculate multigroup beta spectra. RC-1564 (COG-93-33-I). Oak Ridge (TN): Oak Ridge National Laboratory; 1996.
- SCALE. A modular code system for performing standardized computer analyses for licensing evaluation. ORNL /TM-2005/39, version 6. Vols. I–III. Oak Ridge (TN): Oak Ridge National Laboratory; 2009.
- The B&W Company. Rhodium in-core detector sensitivity depletion. Cycles 2–6. EPRI NP-3814. Lynchburg (VA): The Babcock & Wilcox Company; 1984.
- Berger MJ, Seltzer SM. Tables of energy losses and ranges of electrons and positrons. NASA-SP-3012. Washington (DC), National Bureau of Standards: NASA; 1964.
- Self-powered flux detectors advertised for sale by Reuter-Stokes Canada Limited. Brochure. Preston (ON); 1968.