
 ?Mathematical formulae have been encoded as MathML and are displayed in this HTML version using MathJax in order to improve their display. Uncheck the box to turn MathJax off. This feature requires Javascript. Click on a formula to zoom.
Abstract
Apparent diffusion coefficients (Da) of water and activation energies (Ea) of diffusion in hardened cement pastes (HCPs) were determined as a function of water-to-cement (w/c) ratio (0.36–0.60) and temperature (293–323 K) using HTO and H218O as tracers. The values of Da and Ea ranged from 1.1×10⁻¹¹ to 1.7×10⁻¹⁰ m2 s−1 and from 21.5 to 31.3 kJ mol−1, respectively. No significant difference between the Da values of HTO and H218O suggests that water predominantly diffuses as H2O molecule and dissociation of water is not significant even at high pH range in HCP. The values of Ea at low w/c ratio were higher than in bulk liquid water, suggesting a contribution of a different water regime, such as supercooled bulk water. Two simple models consisting of capillary and gel pores were considered to estimate the volume ratio of gel pores to total pores by optimizing the model to fit with the experimental data. The result suggests that HCP has a pore network mostly consisting of capillary pores with some very narrow pores plugged with hydrates, where HTO must diffuse through gel pores. This view of the HCP pore network was made available through analysis of Ea values.
1. Introduction
Hardened cement paste (HCP) or cement-based materials, which are mixtures of HCP and aggregates such as rock, sand, and gravel, will be used in significant quantities not only as structural materials, grout, and filler but also as engineered barriers (e.g. solidification and low-diffusion layer) in radioactive waste disposal. One of the important roles that the engineered barriers are expected to play is to retard the migration of radionuclides from containers to biosphere. However, the barrier performance will be degraded due to leaching of cement alkaline components (Na+, K+, and Ca2+) when contacted with groundwater. It is therefore necessary to understand the transport mechanisms of notable radionuclides and cement alkaline components in cement-based materials in order to improve the prediction of the barrier performance. Insight into the transport mechanisms will also advance the assessment of the long-term durability of cement-based materials and the effects of cement alkaline components on other surrounding barrier materials such as host rock and bentonite.
HCP is formed when cement is mixed with water, and it has capillary pores with sizes in the range of a few nm to tens of μm, gel pores with diameters smaller than 10 nm, and cement particles of progressing degree of hydration [Citation1]. Capillary pores are water-filled voids between cement particles, and their volume can be experimentally determined by mercury intrusion porosimetry (MIP) method. It can also be estimated from the degree of hydration [Citation1]. Gel pores are fine pores formed in hydrates. Initial volume of capillary pores can be estimated by a weight ratio of water to cement particles (i.e. water-to-cement (w/c) ratio). As the w/c ratio increases, pore size is enlarged in addition to the pore volume increase [Citation2]. As hydration proceeds, hydrates are formed in the voids between cement particles and as the result, the volume of capillary pore contracts. Both capillary pores and gel pores constitute a complex network which is a major pathway for mass transport in HCP, and w/c ratio is one of the parameters that affect the microstructure of the transport pathway.
The mass transport in HCP is controlled by diffusion when cement-based materials used in radioactive waste disposal have low hydraulic conductivity. Diffusion behaviors in HCP at different w/c ratios have been studied for ion species such as cesium [Citation3,4], chloride [Citation5–7], and iodide ions [Citation3]. However, detailed diffusion mechanisms have been still ambiguous due to potential interactions between ions and cement hydrates including electrostatistical interaction [Citation5,Citation8] and sorption [Citation6,7], in addition to the complexity of pore geometry (tortuosity and constrictivity).
Tritiated water (HTO) has an advantage of being a neutral (non-charged) molecule, which is inert to cement hydrates [Citation9,10], and has been used to study diffusion behavior in relation to the complexity of pore geometry. For example, Delagrave et al. [Citation9] reported an increase in diffusion coefficients of HTO with an increase in volume of pores measured by MIP (i.e. capillary porosity). Numata et al. [Citation11] and Yamaguchi et al. [Citation12] reported that the relationship between diffusion coefficients and capillary porosity can be expressed as a power function of the volume of pores, which is a well-known empirical equation called “Archie's law”. Although macroscopic approach is useful and practical with a valid empirical equation, it does not elucidate the mechanisms of diffusion processes.
Another approach is based on numerical model studies relating microstructures to diffusion behaviors [Citation13,14]. Bejaoui and Bary [Citation13] considered diffusion pathways consisting of the combination of capillary pores, low-density calcium silicate hydrate (C-S-H, which is a major component of ordinary Portland cement (OPC) hydrates and includes gel pores), and high-density C-S-H to fit to the diffusivity data obtained at different w/c ratios. Kamali-Bernard et al. [Citation14] used a finite element method of three-dimensional microstructure of HCP to simulate HTO diffusion and compared the results to experimental results. Both of the studies suggest the contribution of gel pores to diffusion of HTO in HCP.
More detailed pore geometry including gel pores may need to be considered in order to understand diffusion mechanisms of HTO in HCP. However, the nature of water confined in gel pores is not well understood. For example, a quasi-elastic neutron scattering method [Citation15,16] detected the presence of water similar to supercooled bulk water in hydrated tricalcium silicate (C3S), which is a major component of OPC. Similarly, a molecular dynamic simulation suggested that the structure of water on the surface of a C-S-H sheet was similar to that of the supercooled bulk water [Citation17]. The activation energy for water molecule diffusion in the supercooled bulk water (44.4 kJ mol−1 [Citation18]) is remarkably higher than in bulk liquid water (19.2 kJ mol−1 [Citation19]). If the water similar to the supercooled bulk water is present in the gel pores and significantly affects diffusion behaviors of HTO, activation energy for HTO diffusion in HCP is expected to be a key parameter in identifying a predominant diffusion process.
In this study, a relationship between diffusion behaviors of HTO and the microstructure of HCP was discussed from the experimental data on the apparent diffusion coefficients of HTO obtained for HCP samples prepared with different w/c ratios. A tracer of H218O was also used in the diffusion experiments so as to confirm that HTO was the dominant chemical species diffusing in HCP; diffusion of dissociation products of HTO was negligibly small. The activation energy for HTO diffusion was determined at each w/c ratio to evaluate the contribution of the gel pores in the HTO diffusion. Diffusion pathways were considered with two kinds of simple models consisting of capillary and gel pores, one model with capillary and gel pores connected in series in the direction of diffusion, and the other model with capillary and gel pores constituting independent diffusion pathways without being connected. The estimate of the volume ratio of gel pores to total pores was obtained for both of the models by optimizing the model to fit with all of the experimental data with the purpose of gaining insight into diffusion pathways and the pore geometry in HCP, especially on gel pores. Based on the new approach of determining the diffusion coefficients as a function of both w/c ratio and temperature, how the changes in HTO diffusion pathways in complex pore network influence diffusion behavior was discussed.
2. Experimental methods
2.1. Preparation of HCP samples
OPC powder (Japan Cement Association) was used to prepare HCP samples. The composition of OPC powder used is shown in . The OPC powder was mixed with deionized water at w/c ratios of 0.36, 0.40, 0.45, 0.50, and 0.60 (in weight). The mixtures were settled for 30 minutes at 303 K before they were remixed. This procedure was repeated until no water seeped to the surface of the cement paste due to settling. The mixtures were then poured into cylindrical polyethylene molds of 24.5 mm in inner diameter and 60 mm in height. They were covered with a sheet of polyethylene to prevent moisture loss and were settled for approximately 1 day at room temperature. After removing the molds, HCP rods were cured for 90 days at 323 K in the cement-equilibrated water, which was prepared by mixing 2 dm3 of deionized water with 0.2 kg of OPC powder and settling for more than 2 days.
Table 1. Chemical compositions of OPC used in experiments (Japan Cement Association).
2.2. Measurements of porosity and hydration degree
Total porosity and degree of hydration of HCP samples were determined from the weight loss by drying a water-saturated sample and igniting after drying. Disk-type specimens of 24.5 mm in diameter and 5.0 mm in thickness were cut from the center of HCP rods with a water-cooled diamond blade. Specimens were saturated by submerging in the cement-equilibrated water in a vacuum desiccator to determine the water-saturated weight (m1). Specimens were dried in an oven for more than 1 week at 333 K [Citation20] to determine the dried weight (m2). After drying in the oven, they were pulverized to less than 75 μm in particle size, and 3.0 g of the pulverized specimens was heated in an electric furnace for more than 1 hour at 1273 K [Citation2] to determine the weight of the ignition residue (m3).
Total porosity (ϵtot) and degree of hydration (α) [Citation21] were calculated by the following equations:
(1)
(1) and
(2)
(2) where mp is the amount of porewater (m1 − m2), ms is the weight of pulverized HCP sample ignited in an electric furnace (3.0 g), mc is the amount of water chemically bound in hydrates (ms − m3), V is the volume of a disk-type specimen (2.36 cm3), ρw is the water density at 293 K (0.998 g cm−3), LC is the rate of mass loss including decarboxylation by ignition of cement powder in an electric furnace (6.2×10⁻³ for OPC used in this study), and γ is the ratio of water consumed for complete hydration to 1 g of anhydrous cement (0.23). Capillary porosity (ϵcap) was calculated by the following equation [Citation1], and gel porosity (ϵgel) was calculated by subtracting ϵcap from ϵtot:
(3)
(3)
2.3. Non-steady diffusion system
The dependence of the apparent diffusion coefficient of HTO on w/c ratio and temperature was studied by a non-steady diffusion experiment with an instantaneous source. A specimen of 40 mm in height and 24.5 mm in diameter was cut out from the center of an HCP rod with a water-cooled diamond blade. After they were saturated with the cement-equilibrated water in a vacuum desiccator, a slight amount of HTO tracer (PerkinElmer Life & Analytical Sciences) solution was applied to the flat surface of the HCP specimen. Two HCP specimens were placed together in contact, and were covered with rubber and plastic paraffin films to prevent drying ((a)). They were kept at temperatures of 293, 303, 313, and 323 K for the duration of the experiment.
Figure 1. Schematic diagrams of non-steady diffusion experimental system (left: HTO instantaneous source, right: H218O or HTO constant source).
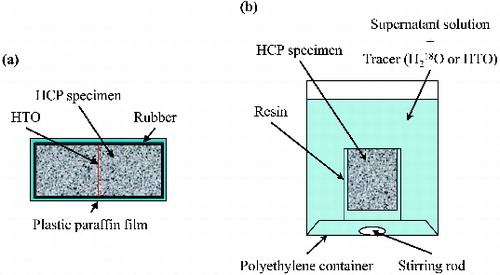
A non-steady diffusion experiment with a constant source was conducted in order to compare the apparent diffusion coefficients of HTO and H218O and to estimate the volume of pores accessible for HTO and H218O. The specimen was cut out similarly from the center of an HCP rod, and all of the surfaces except for the top were sealed by resin. After being saturated with cement-equilibrated water, it was immersed in the source solution for the duration of the diffusion experiment for 5 days at 303 K ((b)). During diffusion period, the changes in the tracer concentration in the source solution were confirmed to be less than 1%. The source solution was prepared by adding a slight amount of HTO or H218O (Cambridge Isotope Laboratories, Inc.) in cement-equilibrated water.
After the diffusion period, the specimen was sliced into 1.0 mm thick sections from the contacting surface with a water-cooled diamond blade. The wafers were pulverized and immersed in 1.5–2.5 ml of cement-equilibrated water at room temperature for more than 1 week until HTO or H218O in the wafer was released into cement-equilibrated water. The amount of the tracer applied in the instantaneous-source diffusion experiment was confirmed to be extracted in this procedure to satisfy the material balance of HTO. After filtration through a hydrophilic polytetrafluoroethylene (PTFE) type membrane filter with 0.45 μm pore size, the concentration of HTO or H218O in the supernatant was determined as a function of distance from the plane where HTO was applied or the source solution of HTO and H218O contacted with the specimen. The radioactivity of HTO in the supernatant was measured using a liquid scintillation counter LSC-5100 (Hitachi Aloka Medical, Ltd.). For the analysis of H218O, the mole fraction of O-18 in the supernatant was calculated from the oxygen isotopic ratio (δ18O) which was measured by a mass spectrometer using the exchange of O-18 between H2O and CO [Citation22].
3. Results and discussions
3.1. Characteristics of HCP samples
The porosity (ϵtot, ϵcap, and ϵgel) and degree of hydration (α) were shown in , together with water contents in HCP specimens (mp and mc) determined from weight loss after drying and igniting. The value of α increased with an increase in w/c ratio, as previously reported [Citation2,Citation23,Citation24]. The values of ϵtot and ϵcap increased with an increase in w/c ratio, while the value of ϵgel decreased because of the reduction of the volume of cement paste per unit volume. These changes indicated that the volume of larger pores increased as w/c ratio increased.
Table 2. Water contents, hydration degree, and porosity of HCP samples.
Pores in HCP can be divided into two zones; pores that are accessible for migration and pores that are not. The porosity of the accessible pores is defined as effective porosity (ϵeff), and is generally estimated from the total amount of a tracer that penetrates into a water-saturated porous media by diffusion. In this study, the tracer concentration (C(Δx, t)) in the porewater in the thin HCP slice closest to the source solution was assumed to be equal to the tracer concentration (C0) in the source solution (C0 = C(Δx, t)). The concentration of the tracer per unit volume of the HCP slice (Cs(Δx, t)) was obtained from the concentration profile acquired in the constant-source diffusion experiment. Using the volume of the HCP slice (ΔV), the amount of the tracer (A) in the HCP slice is represented as
(4)
(4) or
(5)
(5) From the above assumption (C0 = C(Δx, t)), Equations (4) and (5), the ϵeff value is calculated by the following equation:
(6)
(6) The values of ϵeff were shown in . The values of ϵeff were larger than ϵcap and were close to ϵtot, suggesting that HTO and H218O can enter into gel pores during diffusion.
3.2. Pore characteristics dependence of diffusion of HTO and H218O in HCP
shows a typical concentration profile of HTO in HCP obtained from the instantaneous-source diffusion experiment. The apparent diffusion coefficient (Da) was determined by fitting the following analytical equation to the concentration profile [Citation25]:
(7)
(7)
Figure 2. Concentration profile of HTO in HCP at w/c ratio of 0.45 at 303 K for an instantaneous source; diffusion period was 7 days. A solid line is a fitting curve by solution of Fick's second law (Equation (7)).

Table 3. Apparent diffusion coefficient (Da) of HTO and H218O and activation energy (Ea) of HTO in HCP. Abbreviations of Ins. and Cons. are instantaneous source and constant source, respectively.
shows typical concentration profiles of HTO and H218O in HCP obtained from the constant-source diffusion experiment. The apparent diffusion coefficient was determined by fitting the following analytical equation to the concentration profile [Citation25]:
(8)
(8)
Figure 3. Concentration profiles of HTO and H218O in HCP at w/c ratio of 0.45 at 303 K for a constant source; diffusion period was 5 days. A solid line is a fitting curve by solution of Fick's second law (Equation (8)).
shows the dependence of the apparent diffusion coefficient on w/c ratio at 303 K. No significant difference was observed between the Da values of HTO and H218O, suggesting that the influence of dissociation of HTO and H218O on the diffusion is negligible: HTO and H218O diffuse as water molecules even in alkaline porewater in HCP.
Figure 4. Dependence of apparent diffusion coefficients of HTO and H218O on w/c ratio (at 303 K). Abbreviations of Ins. and Cons. are instantaneous source and constant source, respectively.
The diffusivity in porous media is related to the porosity (ϵ) by an empirical equation (i.e. Archie's law):
(9)
(9) where De is the effective diffusion coefficient in porous media, Dv is the self-diffusion coefficient in bulk liquid water (2.7×10⁻⁹ m2 s−1 for HTO and 3.1×10⁻⁹ m2 s−1 for H218O at 303 K, which were calculated from self-diffusion coefficients and activation energies at 298 K [Citation19]), and m is the cementation factor, which is a fitting parameter. Since the sorption of water on cement hydrates is negligible [Citation9,10], the apparent diffusion coefficient is equal to the effective diffusion coefficient divided by ϵtot or ϵcap. The
value plotted against ϵtot and ϵcap was shown in (a) and 5(b), respectively. The ϵtot value can reproduce the
value by the power function ((a)) and the exponent was approximately 4.2. Similarly, the
values fitted with the power function of the ϵcap ((b)). The values of
deviated from the power function at lower ϵcap values.
Figure 5. Relationship between the porosity and the apparent diffusion coefficients of H218O and HTO: (a) total porosity and (b) capillary porosity. Abbreviations of Ins. and Cons. are instantaneous source and constant source, respectively. Solid line shows the best fit as a power function of porosity.
3.3. Temperature dependence of diffusion of HTO in HCP
shows the apparent diffusion coefficient of HTO as a function of temperature. The plots were well reproduced at all w/c ratios by the Arrhenius equation:
(10)
(10)
Figure 6. Arrhenius plots of the apparent diffusion coefficients of HTO in HCP at w/c ratios of 0.36, 0.45, and 0.60.
Figure 7. Dependence of activation energies of HTO diffusion in HCP on w/c ratio. Dashed line indicates the activation energy of diffusion for HTO in bulk liquid water (19.2 kJ mol−1 [Citation19]).
![Figure 7. Dependence of activation energies of HTO diffusion in HCP on w/c ratio. Dashed line indicates the activation energy of diffusion for HTO in bulk liquid water (19.2 kJ mol−1 [Citation19]).](/cms/asset/0ed85df0-2048-4242-b1ae-0727485504f1/tnst_a_979902_f0007_b.gif)
Higher activation energy of 44.4 kJ mol−1 has been reported for the diffusion of water molecules in supercooled bulk water [Citation18]. Water similar to supercooled bulk water (hereafter “confined water”) has been identified in hydrated tricalcium silicate (C3S, which is a major component of OPC) by a quasi-elastic neutron scattering method [Citation15,16] and on the surface of a calcium-silicate-hydrate sheet (C-S-H, which is a major component of OPC hydrates with a layer structure similar to tobermorite or jennite) by molecular dynamics simulation [Citation17]. If the higher activation energy can be attributed to the confined water, HTO may diffuse in at least two different types of water in HCP, i.e. the confined water (region 1) and the bulk liquid water (region 2). Changes in the apparent diffusion coefficients and the activation energy as a function of the w/c ratio may be explained by the volume ratio of region 1 and region 2, and microstructure of the two regions where HTO diffuses.
3.4. Diffusion model of water in HCP
Simple models for the diffusion pathways of HTO in HCP are considered in order to explain the changes in apparent diffusion coefficients and activation energies with an increase in w/c ratio, i.e. an increase in w/c ratio from 0.36 to 0.60 resulted in an increase of apparent diffusion coefficients from 2.0×10⁻¹¹ to 9.9×10⁻¹¹ m2 s−1 at 303 K and a decrease in activation energies from 31.3 to 21.5 kJ mol−1. These changes may be attributed to differences in pore structures caused by an increase in w/c ratio. As described in Section 3.3, if confined water causes higher activation energy of 31.3 kJ mol−1, pores in HCP can be divided into regions filled with confined water (region 1) and bulk liquid water (region 2). A molecular dynamics simulation by Youssef et al. indicates the formation of water similar to supercooled bulk water up to 0.42 nm in thickness and the confinement of water molecules persisting up to 1.0 nm from the surface of a C-S-H sheet [Citation17]. According to this simulation, the confined water (i.e. region 1) occupies up to at least 0.42 nm in thickness from the surface of a C-S-H sheet, and may extend up to around 1.0 nm: porewater existing further away from C-S-H sheets is bulk liquid water (region 2). Gel pores are formed in hydrates, whose major constituent is C-S-H, and have radius smaller than 5 nm [Citation1]. When the radius of a gel pore is similar to the thickness of confined water on the surface of hydrate sheets, most of the gel pores may be considered as region 1. On the other hand, capillary pores have significantly greater radius between hydrated cement particles than gel pores. For example, the distribution of capillary pore radius determined by an MIP measurement is dominated by radius between 10 and 30 nm at w/c ratio between 0.30 and 0.70 [Citation2]. Although region 1 may exist as a thin layer on the inner surfaces of capillary pores, capillary pores may be assumed to be filled only with bulk liquid water (region 2) since the volume of region 1 is negligible compared to region 2.
Diffusion of HTO is considered to occur through only capillary pores [Citation12] or through both capillary pores and gel pores [Citation13,14,Citation26]. However, if HTO diffuses only in capillary pores filled with bulk liquid water (region 2), the activation energy should remain constant. The activation energies determined in this study were not constant, suggesting that the contribution of a diffusion process that has higher activation energy, such as that in confined water (region 1), is substantial enough compared to the diffusion in bulk liquid water (region 2). In order for the diffusion in region 1, which has the diffusivity (e.g. 1.6×10⁻¹⁰ m2 s−1 in supercooled bulk water at 238 K [Citation18]) approximately one order of magnitude smaller than the diffusivity in bulk liquid water (2.4×10⁻⁹ m2 s−1 [Citation19]), to raise the activation energy for the entire HCP system, HTO has to pass through region 1 in the case when the diffusion pathway consisting of region 1 and region 2 connected in series in the direction of diffusion (case 1, the serial model), or region 1 needs to have significant enough volume in the case when the pore network comprises region 1 and region 2 as independent diffusion pathways (case 2, the parallel model). Basic module of the microstructure for the serial model (case 1) is shown in (a), and the parallel model (case 2) is shown in (b). For simplification, the sum of the areas of capillary pores and that of gel pores was assumed to be constant at any cross section perpendicular to the direction of diffusion.
Figure 8. Schematic diagrams of the microstructure of HCP: (a) the serial model and (b) the parallel model. Black parts are hydrates including gel pores (region 1), white parts are capillary pores (region 2), and gray parts are solid phases such as hydrates and unhydrated cements.
In the serial model ((a)), region 1 and region 2 are arranged up in series in a pathway in the direction of diffusion: HTO diffuses through region 1 and region 2 in series. The longer the diffusion path of region 1, the more significant the influence of region 1 on apparent diffusion coefficients and activation energies becomes. In the serial model, the ratio of the length of the path of region 1 to the total length of the diffusion pathway is equal to the ratio of gel porosity to total porosity. In the parallel model ((b)), region 1 and region 2 constitute independent diffusion pathways: HTO diffuses only through region 1 if HTO enters region 1, and only through region 2 if HTO enters region 2. The greater the cross-section area of region 1, the more significant the influence of region 1 on apparent diffusion coefficients and activation energies becomes. In the parallel diffusion model, the ratio of the cross-section area of gel pores to the cross-section area of the total pores is equal to the ratio of gel porosity to total porosity. In both of the cases of the serial model and the parallel model, the ratio of the volume of region 1 to the total pore volume (n), which is the same as the ratio of gel porosity to total porosity, is an important parameter determining the significance of region 1.
The conceptual diagram illustrated in can be simplified as shown in using the volume ratio (n). The simplified models presented in were fitted to the experimental results obtained in this study using the volume ratio (n) as one of the parameters. In the simplified serial model ((a)), the apparent diffusion coefficient of HTO can be expressed as
(11)
(11)
Figure 9. Schematic diagrams of the simplified models shown in : (a) the serial diffusion model and (b) the parallel diffusion model. The arrows indicate the direction of HTO diffusion through the model.
Table 4. The model optimization results. The values of n (the volume ratio of region 1 to diffusion pathways) and formation factor of the diffusion pathways (FF) for the serial model and the parallel model were obtained by fitting the experimental data to the models.
Figure 10. Model optimization results with experimental data. Apparent diffusion coefficients of HTO are shown as a function of w/c ratio. Dashed line shows the results of the serial diffusion model and the dotted line shows the parallel diffusion model.
In the serial model, the optimum values of n increased from 0.010 to 0.076 with the decrease in w/c ratio from 0.60 to 0.36. The increase in the activation energies with the decrease in w/c ratio observed in the experiment corresponded to a small increase of a few percent in the volume ratio of region 1 to the total pore volume (n). The values of n obtained from the optimization were small ranging from 1% to 7.6% of the total pore volume, indicating that diffusion pathways in HCP consist of mostly region 2, and the contribution of region 1 is very small. It should also be noted that the values of n are much smaller than the experimentally determined ratio of gel porosity to total porosity (0.594, 0.416, and 0.274 at the w/c ratios of 0.36, 0.45, and 0.60, respectively). This means that only a very small part of gel pores contribute to diffusion of HTO in HCP. Most of the gel pores, which can be experimentally determined by, e.g. measuring weight loss after drying, do not participate as diffusion pathways. The optimum values of FF decreased from 75.7 to 25.7 with the increase in w/c ratio. Capillary pores are known to develop with an increase in w/c ratio, and this decrease in FF may indicate significance of retardation effect of pore geometry (tortuosity and constrictivity) on HTO diffusion in HCP as w/c ratio decreases.
The small values of n indicate that capillary pores (region 2) are dominant diffusion pathways with very small part (1%–8%) consisting of gel pores (region 1) connected in series in the direction of diffusion. This may be viewed as a pore network mostly consisting of capillary pores, which has some very narrow pores that are plugged with hydrates. In these hydrates, HTO must diffuse through gel pores. In other words, only the gel pores that plug the capillary pore network participate as diffusion pathways. This structure of diffusion pathway is consistent with the n values which are significantly smaller than the experimentally determined ratio of the gel pore volume to the total pore volume. Gel pores that exist outside the capillary pore network, or that exist in the capillary pore network without plugging them do not significantly contribute as diffusion pathways. This view of HCP microstructure presented from the serial model optimization results may be reasonable together with the changes in n and FF values indicating the increasing significance of gel pores and pore geometry as w/c ratio decreases.
In contrast, the parameters n and FF obtained from the parallel model were not in a practical range. The n values increased from 0.461 to 0.912 with the decrease in w/c ratio. These n values are much greater than the experimentally determined ratio of gel porosity to total porosity, and are not reasonable even when a 1.0 nm layer of confined water on the inner surfaces of the capillary pores is taken into consideration. In addition, the values of FF were almost constant at 22.4 ± 4.8. This result indicates that there is no change in pore geometry with the changes in w/c ratio, which contradicts the concept that microstructure of HCP depends on the w/c ratio [Citation1]. Although the experimental data were fitted well with the parallel model by optimizing n and FF, both parameters did not reflect the microstructure of HCP, suggesting that the parallel model possibly failed to express the relationship between diffusion and the microstructure of HCP.
Between the two basic modules considered as diffusion pathway models in HCP, the serial model represents a more realistic pore network. In the serial model, capillary pores (region 2) are the dominant diffusion pathway, and only some percent of the diffusive pore volume comprised gel pores (region 1). Previous studies [Citation11,12] focusing on the relationship between porosity and diffusivity in HCP may have failed to emphasize the significance of gel pores because the contribution of gel pores to diffusivity is, in general, relatively small. With the same reason, a simple expression of the relationship between the diffusion coefficient and capillary porosity, such as Archie's law seemed to be valid.
The activation energy obtained in this study through systematically examining the temperature dependence of diffusion coefficient enabled us to identify the effect of region 1, which does not contribute significantly to the diffusion coefficient, but does affect the activation energy. The same approach can be easily applied to study diffusion of different chemical species in cementitious materials, or diffusion in cement pastes of different compositions including aggregates and admixtures. Further investigations can reveal how the microstructure affects diffusion coefficient, which will lead to a better assessment of the performance of cementitious materials as an engineered barrier in radioactive waste disposal.
4. Conclusion
In order to study the diffusion of water in HCP, the non-steady diffusion experiments were conducted using HTO and H218O as tracers using HCP samples prepared at w/c ratios from 0.36 to 0.60, and at different temperatures (293–323 K). The values of Da ranged from 1.1×10⁻¹¹ to 1.7×10⁻¹⁰ m2 s−1, and increased with increasing w/c ratio. The Da values for H218O ranged from 2.6×10⁻¹¹ to 7.6×10⁻¹¹ m2 s−1 at w/c ratios from 0.40 to 0.60 at a diffusion temperature of 303 K. The values of Da for H218O were in good agreement with those for HTO at each w/c ratio, suggesting that both HTO and H218O diffused as H2O molecule and dissociation of water molecule is negligible in diffusion even at high pH in HCP.
The values of Ea of HTO at w/c ratios of 0.36, 0.45, and 0.60 were 31.3, 22.9, and 21.5 kJ mol−1, respectively. A higher activation energy of 31.3 kJ mol−1 than in bulk liquid water (19.2 kJ mol−1) was observed at w/c ratio of 0.36. Water in gel pores may be confined by hydrates to form a diffusion regime with higher Ea, such as supercooled bulk water, and the contribution of this regime may become significant in a whole HCP at low w/c ratio. Based on the microstructure of HCP, simple diffusion models were considered that consist of a region of bulk liquid water (capillary pores) and a region of water confined by hydrates (gel pores). The models were fitted with the Da values experimentally obtained in this study. From the model results, the dominant diffusion pathway of water in HCP was that capillary pores and gel pores arranged in series in the direction of diffusion, and the pathway mostly consists of capillary pores. The ratio of gel pores contributing to diffusion was significantly smaller than the ratio of gel porosity to total porosity determined by the experiment, indicating that a very small part of gel pores that plug capillary pores may participate in diffusion and most of the gel pores may not function as diffusion pathways. The activation energy obtained in this study enabled us to identify the influence of gel pores, which may be filled with water confined by hydrates, on diffusion of HTO in HCP. This approach of examining the activation energy of diffusion may also be applicable for other chemical species and other types of cementitious materials.
Acknowledgements
This work was partly performed at the Central Institute of Isotope Science, Hokkaido University. The authors would like to acknowledge Dr. M. Hironaga of Central Research Institute of Electric Power Industry for preparation of hardened cement paste.
Additional information
Funding
References
- Mindess S, Young JF, Darwin D. Concrete. 2nd ed. Upper Saddle River (NJ): Prentice Hall; 2003.
- Cook RA, Hover KC. Mercury porosimetry of hardened cement pastes. Cement Concrete Res. 1999;29:933–943.
- Atkinson A, Nickerson AK. The diffusion of ions through water-saturated cement. J Mater Sci. 1984;19:3068–3078.
- Nishi T, Kuriyama O, Matsuda M, Chino K, Kikuchi M. Porosity and ion diffusivity of latex-modified cement. Mater Res Soc. 1990;176:109–114.
- Ngala VT, Page CL, Parrott LJ, Yu SW. Diffusion in cementitious materials: II. Further investigation of chloride and oxygen diffusion in well-cured OPC and OPC/30% PFA pastes. Cement Concrete Res. 1995;25:819–826.
- Diab H, Bentur A, Wirguin CH, Dor LB. The diffusion of Cl− ions through Portland cement and Portland cement-polymer pastes. Cement Concrete Res. 1988;18:715–722.
- Page CL, Short NR, Tarras AE. Diffusion of chloride ions in hardened cement pastes. Cement Concrete Res. 1981;11:395–406.
- Goto S, Roy DM. Diffusion of ions through hardened cement pastes. Cement Concrete Res. 1981;11:751–757.
- Delagrave A, Marchand J, Pigeon M. Influence of microstructure on the tritiated water diffusivity of mortars.Adv Cement Bas Mater. 1998;7:60–65.
- Revertegat E, Richet C, Gégout P. Effect of pH on the durability of cement pastes. Cement Concrete Res. 1992;22:259–272.
- Numata S, Amano H, Minami K. Diffusion of tritiated water in cement materials. J Nucl Mater. 1990;171:373–380.
- Yamaguchi T, Negishi K, Hoshino S, Tanaka T. Modeling of diffusive mass transport in micropores in cement based materials. Cement Concrete Res. 2009;39:1149–1155.
- Bejaoui S, Bary B. Modeling of the link between microstructure and effective diffusivity of cement pastes using a simplified composite model. Cement Concrete Res. 2007;37:469–480.
- Kamali-Bernard S, Bernard F, Prince W. Computer modelling of tritiated water diffusion test for cement based materials. Comput Mater Sci. 2009;45:528–535.
- Fratini E, Faranoe A, Baglioni P, Bellissent-Funel M-C, Chen S-H. Dynamic scaling of QENS spectra of glassy water in aging cement paste. Phys A. 2002;304:1–10.
- Fratini E, Chen S-H, Baglioni P, Bellissent-Funel M-C. Quasi-elastic neutron scattering study of translational dynamics of hydration water in tricalcium silicate. J Phys Chem B. 2002;106:158–166.
- Youssef M, Pellenq RJ-M, Yildiz B. Glassy nature of water in an ultraconfining disordered material: the case of calcium-silicate-hydrate. J Am Chem Soc. 2011;133:2499–2510.
- Price WS, Hiroyuki I, Yoji A. Self-diffusion of supercooled water to 238 K using PGSE NMR diffusion measurements. J Phys Chem A. 1999;103:448–450.
- Wang JH, Robinson CV, Edelman IS. Self-diffusion and structure of liquid water. III. Measurement of the self-diffusion of liquid water with H2, H3 and O18 as tracers. J Am Chem Soc. 1953;75:466–470.
- Gallé C. Effect of drying on cement-based materials pore structure as identified by mercury intrusion porosimetry – a comparative study between oven-, vacuum-, and freeze-drying. Cement Concrete Res. 2001;31:1467–1477.
- Lam L, Wong YL, Poon CS. Degree of hydration and gel/space ratio of high-volume fly ash/cement systems. Cement Concrete Res. 2000;30:747–756.
- Tanaka S, Noda N, Higashihara T, Sato S, Kozaki T, Sato H, Hatanaka K. Kinetic behavior of water as migration media in compacted montmorillonite using H218O and applying electric potential gradient. Phys Chem Earth. 2008;33:S163–S168.
- Wong HS, Buenfeld NR. Determining the water-cement ratio, cement content, water content and degree of hydration of hardened cement paste: method development and validation on paste samples. Cement Concrete Res. 2009;39:957–965.
- Igarashi S, Kawamura M, Watanabe A. Analysis of cement pastes and mortars by a combination of backscatter-based SEM image analysis and calculations based on the Powers model. Cement Concrete Composites. 2004;26:977–985.
- Crank J. The mathematics of diffusion. 2nd ed. Oxford: Clarendon Press; 1975.
- Garboczi EJ, Bentz DP. Computer simulation of the diffusivity of cement-based materials. J Mater Sci. 1992;27:2083–2092.