
 ?Mathematical formulae have been encoded as MathML and are displayed in this HTML version using MathJax in order to improve their display. Uncheck the box to turn MathJax off. This feature requires Javascript. Click on a formula to zoom.
Abstract
A natural circulation evaluation methodology has been developed to ensure the safety of a sodium-cooled fast reactor (SFR) of 1500 MW adopting the natural circulation decay heat removal system (NC-DHRS). The methodology consists of a one-dimensional safety analysis which can evaluate the core hot spot temperature taking into account the temperature flattening effect in the core, a three-dimensional fluid flow analysis which can evaluate the thermal-hydraulics for local convections and thermal stratifications in the primary system and DHRS, and a statistical safety evaluation method for the hot spot temperature in the core. The safety analysis method and the three-dimensional analysis method have been validated using results of a 1/10 scaled water test simulating the primary system of the SFR and a sodium test simulating a part of the primary system and the DHRS with about a 1/7 scale, and the applicability of the safety analysis for the SFR has been confirmed by comparing with the three-dimensional analysis adopting the turbulence model. Finally, a statistical safety evaluation has been performed for the SFR using the safety analysis method.
1. Introduction
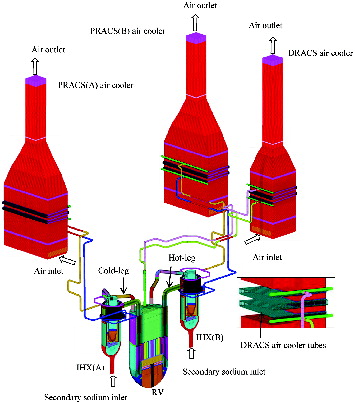
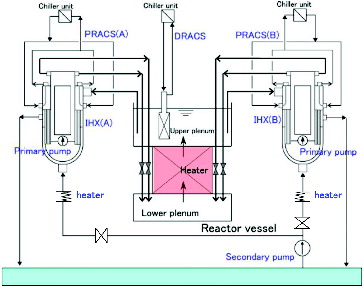
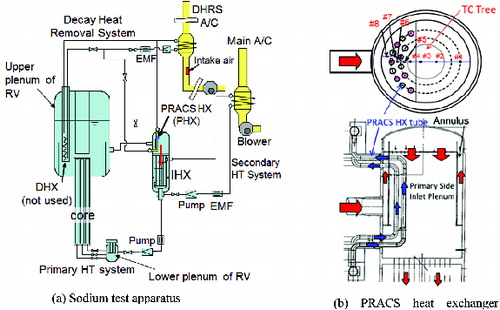
The fast breeder reactors (FBRs) built so far, such as Monju, BN-600 and Super Phenix, have been equipped with forced circulation systems consisting of pony motors, electromagnetic pumps and blowers in order to remove decay heat after a reactor trip. On the other hand, decay heat removal capability by natural circulation has been studied to ensure safe cooling of the reactor even when AC-power supply to the forced circulation systems has failed, and the effectiveness of natural circulation decay heat removal is being established [Citation1,2]. Based on these studies, a NC-DHRS which does not depend on emergency AC power supply has been adopted for a sodium-cooled fast reactor (SFR) of 1500 MWe being designed in Japan [Citation3] and this study has been performed on the SFR as a design example. The schematic of the heat transport systems is shown in and the main specifications are shown in . The primary system consists of a reactor vessel (RV) containing the core and two primary loops. Each primary loop consists of a hot-leg pipe, a pair of cold-leg pipes and an integral-type intermediate heat exchanger (IHX) into which a primary pump is installed. The DHRS consists of a combination of one unit of direct reactor auxiliary cooling system (DRACS) and a total of two units of primary reactor auxiliary cooling system (PRACS). The DRACS has a heat exchanger (DHX) installed in the upper plenum of the RV. Each PRACS has a heat exchanger (PHX) installed in the upper plenum of the IHX. The NC-DHRS is activated not only at the reactor trip events accompanied by a loss-of-off-site-power, but also at all the reactor trips, including asymmetrical events with respect to the two primary loops. When a reactor trip occurs, the primary pumps and secondary pumps are tripped and the dampers of the air coolers are opened. Thus, only the air dampers are active components, which need a small DC power supplied by a backup battery system. Since the NC-DHRS does not use active circulators requiring AC power supply but uses only naturally existing buoyancy force, it can be activated without fail and has very high reliability. This fact contributes a drastic reduction of supporting equipment of the DHRS and also of the capacity of emergency AC power supply system. Moreover, it has a convenient characteristic of “self-controllability” by which the coolant flow rate in the system changes with a positive correlation to the core heat generation rate, and the horizontal coolant temperature distributions are flattened locally due to the buoyant flow and high heat conductivity of the coolant sodium. This convenient characteristic causes the hot spot temperature decrease accompanied by inter- and intra-subassembly flow redistributions due to buoyancy and the radial heat transfer in the core under the natural circulation condition [Citation4]. However, as compared with the forced circulation system, the primary flow rate under the natural circulation condition is relatively small and strongly depends on the transient temperature distributions in the primary system. This fact makes evaluation of the core hot spot temperature more difficult due to increase of the uncertainty related to the primary flow rate.
Table 1. Main specifications of the SFR heat transport systems.
Figure 1. Schematic of the SFR heat transport systems.
In this study, in order to cope with the small primary flow rate and increases of the uncertainty, a one-dimensional safety analysis method has been developed to evaluate the core hot spot temperature (the highest fuel cladding temperature) by taking into account the temperature flattening effect in the core. A statistical safety evaluation method [Citation5] recently discussed in safety evaluation of light water reactors has been newly introduced in order to quantify the reliability of the hot spot temperature evaluation. Furthermore, a three-dimensional fluid flow analysis method has been developed to analyze thermal-hydraulic phenomena in the primary system and DHRS simultaneously as a backup of the safety analysis, because it is difficult for one-dimensional modeling to perform detailed analyses of local convections, thermal stratifications and partial flows which may occur in the primary system and DHRS. The three-dimensional analysis can take the scale effect (the Re-number dependency) into account, because it can deal with the geometry of the components much more exactly and the turbulent model is included in it.
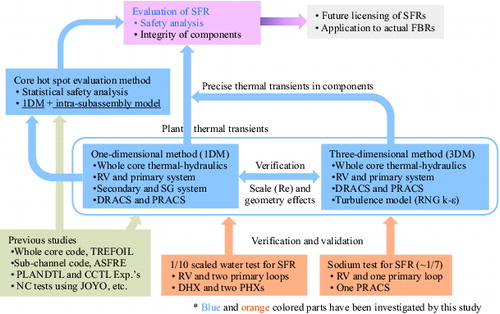
The safety analysis method and three-dimensional method have been validated through analyses using two kinds of test results. One is a 1/10 scaled water test [Citation6] which simulates transient phenomena during various reactor trip events in the primary system of the SFR, including the heat exchangers (PHX and DHX) of the DHRSs, and the other is a sodium test [Citation7] which simulates a part of the primary system and the DHRS, including the air cooler and its stack with about a 1/7 scale. Moreover, comparison analyses have been performed by both methods, the one-dimensional safety analysis method and three-dimensional analysis method, for the SFR plant under the same boundary conditions in order to confirm whether the safety analysis can sufficiently take into account the local three-dimensional phenomena and scale effect, since the scales of the water and the sodium test models used for the validation are relatively small. Through the validation and comparison analyses, the one-dimensional safety analysis has been decided to be applicable to the safety evaluation of the SFR, and then statistical evaluation of the hot spot temperature has been performed using the safety analysis. Finally, summaries are given for the applicability of the evaluation methodology, including the one-dimensional safety analysis, three-dimensional fluid flow analysis and statistical hot spot temperature evaluation, to the NC-DHRS, as shown in .
Figure 2. Evaluation methodology of the NC-DHRS for SFRs.
This paper describes the outline of the study and the details are addressed in papers being prepared separately for publication concerning the water test [Citation8], sodium test [Citation9], one-dimensional safety analysis and three-dimensional fluid flow analysis [Citation10], and statistical safety evaluation [Citation11].
2. Development of natural circulation evaluation methods
2.1. One-dimensional safety analysis
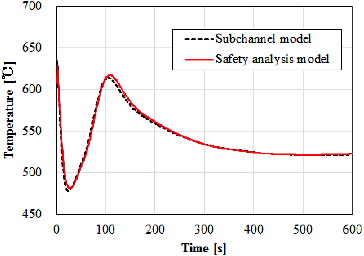
The one-dimensional safety analysis method has been developed based on Super-COPD [Citation12] which is an improved version of the plant dynamics analysis code applied to the safety analysis of the prototype FBR, Monju. A whole core thermal-hydraulic analysis code, TREFOIL [Citation13], can evaluate the temperature flattening effect taking into account the inter-subassembly radial heat transfer with the inter-wrapper gap flow, inter- and intra-subassembly flow redistribution, and it has been incorporated into the safety analysis method in this study. All the subassemblies of fuel, radial blanket, neutron-shield and control rod are modeled independently in TREFOIL. In the conventional safety analyses, the transient hot spot temperatures have been calculated conservatively using fixed power and flow rate fractions of the steady-state core thermal-hydraulic design. The safety analysis in this paper, however, uses the pressure difference between the inlet and outlet of the core, thermal-head, pressure drop and mixing coefficient which represent the effects of the cross flows due to the wrapping wires on the fuel pins for energy exchanges between the hottest subchannel and average subchannel in the subassemblies instead of the fixed flow rate ratio so that the hot spot temperature can be evaluated taking into account the intra-subassembly flow redistribution. The model of the one-dimensional safety analysis is shown in . The mixing coefficient for the safety analyses is obtained through a survey analysis by use of the sub-channel analysis code ASFRE [Citation14]. The hot spot temperature calculated in the safety analysis for loss-of-off-site-power under the nominal condition is shown in together with that analyzed by ASFRE. The two analyses results agree quite well.
Figure 3. Computational model of the one-dimensional safety analysis.
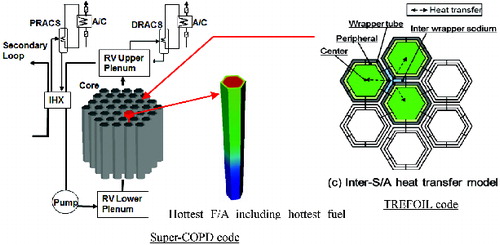
Figure 4. Hot spot temperature transient in loss-of-off-site-power.
2.2. Three-dimensional fluid analysis
The computational fluid dynamic analysis code, STAR-CD (version r4.14) [Citation15], is employed as the mainframe of the three-dimensional fluid analysis method and TREFOIL is incorporated into it as well for the one-dimensional safety analysis. The schematic of the three-dimensional analysis model is shown in . All the loops of the primary system and DHRS are modeled so that it is possible to analyze various reactor trip events, including asymmetrical loop operation with a sufficient number of meshes, and analysis can be performed for thermal stratification, local convection and partial flow expected to occur in the primary system and DHRS. Moreover, the heat transfer tubes in the DHX, PHX and air cooler are independently modeled so that the uneven flow expected to occur in the heat exchangers can be analyzed. The total number of meshes is about 21,000,000. The RNG k–ϵ turbulent model [Citation15], second-order advection scheme named the Monotone Advection and Reconstruction Scheme (MARS) [Citation15] and implicit time advancing scheme named SIMPLE [Citation15] are applied to the three-dimensional analysis as a set of options in STAR-CD. The heat generation rate, secondary inlet temperature and flow rate, and pressure loss coefficients of the air dampers are input as the boundary conditions for the reactor trip events. The pressure losses in the pipes and plena and heat transfer coefficients on the inner surfaces of the tubes and structures are calculated based on the standard logarithmic law for smooth walls built in STAR-CD. The pressure losses in the fuel subassemblies are calculated based on the Cheng–Todreas correlation [Citation16], the heat transfer coefficients on the fuel pins are calculated by the corrected Lyon correlation [Citation17] built in TREFOIL and the heat transfer coefficients of the fin tubes in the air cooler are calculated by the Jameson correlation [Citation18].
Figure 5. Computational model of the three-dimensional fluid analysis.
2.3. Core hot spot temperature evaluation method
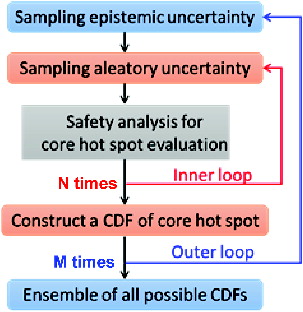
The concept of the statistical safety evaluation method has been introduced into core hot spot temperature evaluation for the NC-DHRS, and the hot spot temperature with probability distribution information is evaluated through the following procedure:
Step 1: To select uncertainties contributing to the hot spot temperature evaluation from input data of the safety analysis concerning the geometries, performances and characteristics of the plant according to the Phenomena Identification and Ranking Table (PIRT) [Citation19] of the Code Scaling, Applicability and Uncertainty (CSAU) evaluation method [Citation20] and to determine their ranges and statistical characteristics based on the plant designer's knowledge.
Step 2: To extract high importance uncertainties according to the importance index μ* of the EE method (Elementary Effects method) [Citation21] obtained from a global sensitivity analysis using the safety analysis method.
Step 3: To calculate the cumulative density function of uncertainties application of the “double-loop sampling structure” method [Citation22] as shown in , in which high importance uncertainties are classified as “aleatory”, processed in the inner loop, and “epistemic”, processed in the outer loop, and a sufficient number of safety analyses are performed to obtain a cumulative distribution of uncertainties.
Step 4: To obtain the final hot spot temperature and its distribution by adding modeling errors quantified by the validation analyses described later and the numerical calculation errors quantified by the Grid Convergence Index (GCI) method [Citation23] for the safety analysis.
Figure 6. Procedure of double-loop structure sampling.
Although uncertainties are classified by the plant designer's judgment in the process of the PIRT of the CSAU method, a global sensitivity analysis has been performed (in Step 2) to enhance the objectivity of the classification in this study, because natural circulation is a complicated phenomenon in which the flow rate and the temperature distribution have mutual influences.
3. Validation of the methods
The safety analysis method and the three-dimensional analysis method have been validated based on the test results which are obtained from the 1/10 scaled water test simulating the primary system with a DHX and a PHX and the sodium test simulating the primary system and the DHRS on the scale of about 1/7.
3.1. Water test for primary system
3.1.1. Test apparatus and condition
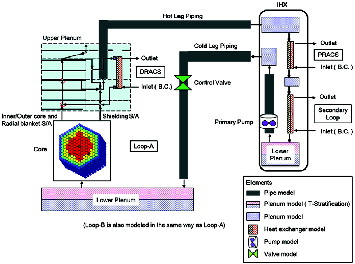
The test apparatus is shown in and . It simulates the RV with the DHX and two primary loops with the PHX to the scale of 1/10. The core consists of four regions: inner core, outer core, radial blanket and neutron shield, the first three of which are installed with heaters. There are a number of pipes (flow channels) in each region and the total number of the flow channels is 214. The primary pump is installed into the IHX and its number of rotations is controlled simulating from the initial forced circulation to the natural circulation. A pair of cold-leg pipes is attached to the IHX primary outlet. The secondary side inlet temperature and flow rate of the IHX are controlled by a heater and a valve at the secondary cooling water supply system. The secondary side inlet temperatures and flow rates of the PHXs and DHX are independently controlled by cooling devices of cooling water recirculation systems. The similarity rule applied to the water test is the Richardson number (Ri) agreement condition and the scale ratio of the test is determined so that the Peclet number (Pe) and Euler number (Eu) in the test are close to those of the SFR. The non-dimensional numbers concerning the similarity rule and essential specifications are shown in . Simulation tests are conducted mainly for five representative events: loss-of-off-site-power (symmetrical event), secondary-sodium-leakage (asymmetrical heat removal at the IHX), a-primary-pump-stick (asymmetrical primary flow rate), secondary-sodium-leakage-in-the-PRACS (asymmetrical heat removal at the PHX) and secondary-sodium-leakage-in-the-DRACS (symmetrical event).
Table 2. Similarity and specifications of the water test.
Figure 7. Schematic of water test apparatus.
3.1.2. Validation analyses
Validation analyses have been made for the five representative events described above. Among them two events are picked up in this paper as typical cases: loss-of-off-site-power and secondary-sodium-leakage. In the case of loss-of-off-site-power, the primary pumps and the secondary pumps are tripped, the core is shut down and then the heat removal operation starts using the DHX and two PHXs simultaneously, so that natural circulation decay heat removal is established symmetrically between the two primary loops. In the case of secondary-sodium-leakage, the cold-leg temperature of the failure loop starts rising in the primary system, so that the temperature and natural circulation flow rate in each loop behave asymmetrically between the two primary loops. Subsequently, the asymmetrical state settles down to a symmetrical stable state as in the loss-of-off-site-power case.
The transient boundary conditions of the analyses such as the core power decrease, primary pump coast-down curves, secondary side inlet flow rates, and temperatures of the IHXs, PHXs and DHX are given as input data.
Figure 8. View of water test apparatus.
3.1.2.1. One-dimensional safety analysis
shows the one-dimensional flow network model applied to the 1/10 scale water tests, in which the two cold-leg pipes of the primary loop are modeled as one hydraulically equivalent flow conduit and the characteristics of the apparatus such as the pressure losses in the primary system, and heat transfer coefficients in the IHX, PHX and DHX are given based on the functional test results of the apparatus as input data.
Figure 9. One-dimensional modeling for the water test analyses.
The analysis results for loss-of-off-site-power are shown in compared with the test results. Since the two primary loops, including the PHX, are operated symmetrically in this event, the primary flow rate, inlet and outlet temperatures of the RV in both loops behave similarly and the analysis results show good agreement with the test results, including the outlet temperatures of the inner and outer cores. The outlet temperatures of the radial blanket and neutron shield, however, do not agree with the test results at around 200 and 700 seconds. These discrepancies are caused by the reverse flows due to a small imbalance of the thermal head and the pressure loss among the subassemblies. The outlet temperatures suddenly rise to the temperature at the bottom of the upper plenum at the onset of the reverse flow and suddenly decrease to the outlet temperatures of the subassemblies when returning to the normal flow. It is difficult for the one-dimensional model to exactly analyze the phenomena, but the influence of the discrepancies is not so large for the highest coolant temperature at the fuel subassembly outlet. The discrepancies are decreased in the three-dimensional analysis, as shown in .
Figure 10. One-dimensional analysis results for loss-of-off-site-power.
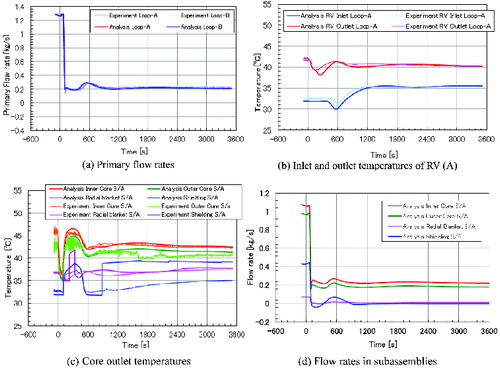
Figure 11. One-dimensional analysis results for secondary-sodium-leakage.
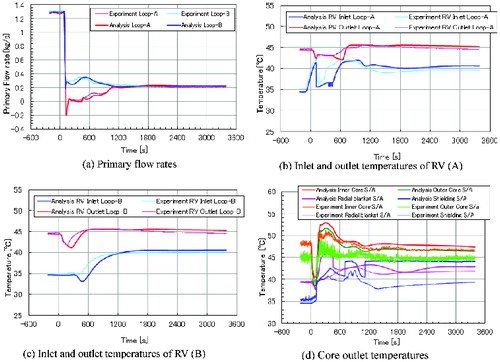
Figure 12. Three-dimensional modeling for the water test analyses.
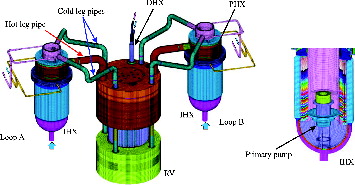
Figure 13. Three-dimensional analysis results for loss-of-off-site-power.
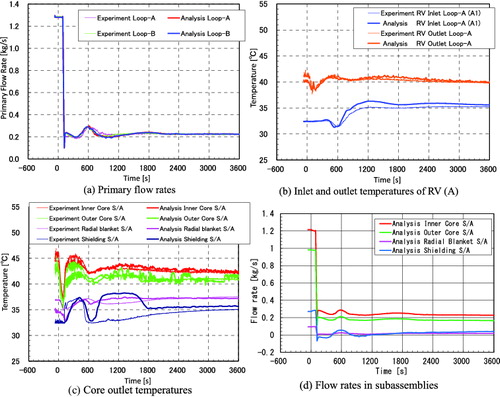
The analysis results for secondary-sodium-leakage are shown in . In this case, the secondary flow rate of the IHX of the failed loop A decreases initially, then the core heating power rapidly decreases to a decay heat level, and subsequently the primary pumps are tripped with the same coast-down curve. Therefore, the cold-leg temperature in the loop A increases earlier than that of the normal loop B, the natural circulation force in the loop A becomes smaller than that in the loop B, and then the primary flow rate in the loop A decreases to almost zero. Afterwards, the primary flow rate in the loop A gradually increases to the level of the normal loop B because the cooling due to the PHX begins simultaneously in the upper plenum of both IHXs, and then a stable natural circulation condition is established. The analysis results of the inlet and outlet temperatures of the RV in the loop A and the primary flow rate in both loops show good agreement with the test results as in the loss-of-off-site-power case.
3.1.2.2. Three-dimensional fluid analysis
shows the three-dimensional mesh division applied to the 1/10 scale water test. The total number of meshes is about 5,600,000. The characteristic data and the boundary condition data are input into the code as in the one-dimensional safety analyses. The pressure drops and heat transfer coefficients due to the wall friction inside the primary components are internally calculated by STAR-CD.
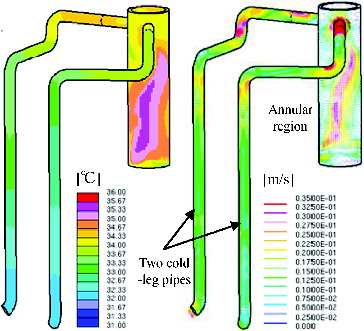
The analysis results for loss-of-off-site-power are shown in compared with the test results. The analysis results of the primary flow rates in both loops, and the inlet and outlet temperatures of the RV show good agreement with the test results. The core outlet temperatures are well simulated in this analysis. The bumpy temperature transient at the radial shielding outlet at around 600 seconds is caused by a reverse flow in the radial shield due to the unbalance of buoyancy in the core for a short duration. The small discrepancies of the temperature transients between the analyses and the test results at the core outlet are considered to be caused by temperature mixing due to local convections just above the heating channel outlet. The analysis results of the primary flow rates in the two cold-leg pipes arranged in the primary loop show good agreement with the test results, including their oscillating phenomena around 600 seconds after the start of the transient, as shown in . The cause of the oscillation is speculated as follows: the inlet temperature of the tube bundle in the IHX begins to decrease at 500 seconds when the PHX cooling starts. The temperature in the lower plenum of the IHX once decreases due to the low water temperature of the IHX secondary side and gradually increases to the IHX inlet (PHX outlet) temperature level. This temperature increase causes the Rayleigh–Taylor instability for an upward flow in the annular region of the IHX, as shown in . The unstable temperature distribution in the annular region causes an inlet temperature difference between the two parallel pipes of the cold leg, and it causes an unbalance of buoyancy force in the parallel pipes causing a flow rate oscillation.
Figure 14. Flow rates at two cold-leg pipes in loss-of-off-site-power.
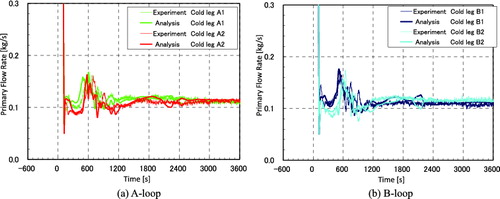
Figure 15. Temperature and flow velocity distributions in the annular region of a primary pump outlet at 670 seconds.
The analysis results for the secondary-sodium-leakage are shown in compared with the test results. The calculated primary flow rates in both loops and the inlet and outlet temperatures of the RV show good agreement with the test results, though the flow rates and the temperatures behave asymmetrically between the two loops. The core outlet temperatures are well simulated in this analysis as in the loss-of-off-site-power case. The analysis results of the primary flow rates in the two cold-leg pipes show good agreement with the test results. The primary flow rates in the two cold-leg pipes of the intact loop show oscillating phenomena as in the loss-of-off-site-power case. On the other hand, in the increasing process of the flow rate in the failed side loop after 1000 seconds, the flow rates in the two cold-leg pipes behave differently. The different behavior is caused by a slight difference between the arrival times of low-temperature fluid cooled by the PHX at the inlets of the two cold-leg pipes, which is caused by the unstable upward flow in the annular region of the IHX described in the loss-of-off-site-power case. The temperature difference at the inlets of the two cold-leg pipes causes a buoyancy difference between the two cold-leg pipes, so that the low-temperature fluid partially flows to one side.
Figure 16. Three-dimensional analysis results for secondary-sodium-leakage.
3.2. Sodium test for the primary and decay heat removal systems
3.2.1. Test apparatus and condition
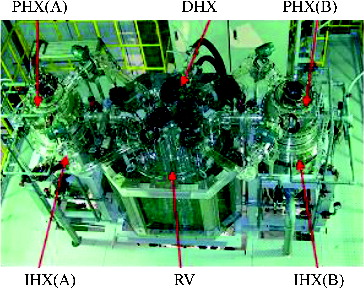
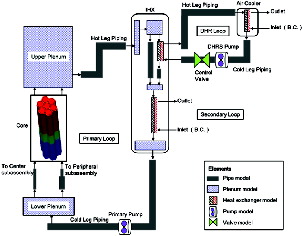
A test using sodium has been performed at the Plant Dynamic Test Loop (PLANDTL) [Citation7] of O-arai Engineering Center of JAEA. The test apparatus has a one-loop configuration, as shown in . The primary system of the apparatus consists of a simulated core of seven fuel subassemblies with heater pins, an upper plenum of an RV with a DHX, an electromagnetic pump, an IHX, a lower plenum of the RV and pipes connecting them. The secondary system consists of an electromagnetic pump, a pair of hot- and cold-leg pipes, and an air cooler. The DHRS consists of a PHX newly installed into the upper plenum of the IHX for this study, an electromagnetic pump, a pair of hot- and cold-leg pipes and an air cooler with a blower and an air dumper in the inlet duct, and the outlet duct (stack). The sodium test apparatus does not physically simulate the SFR plant design, because the test scale of PLANDTL is estimated to be about 1/7 with respect to the primary piping diameter, and the differences of the vertical levels of the components such as the core, PHX and air cooler. On the other hand, thermal-hydraulics in the fuel subassemblies, heat transfer in the PHX, and the initial temperature difference between the primary and secondary systems for the natural circulation tests are simulated better than the water test because of the sodium coolant. The heat transfer characteristic tests for the PHX, the startup transient tests for the PRACS and the scram transient tests coupling with the primary system and the PRACS for the NC-DHRS have been conducted while the Ri numbers of the tests have been chosen to be the same as those of the SFR plant design at the observation locations. The non-dimensional numbers concerning the similarity rule and the essential specifications are shown in .
Table 3. Similarity and specifications of the sodium test model.
Figure 17. Schematics of the plant dynamics test loop (PLANDTL).
3.2.2. Validation analyses
Validation analyses have been carried out for the sodium tests described above. Among them a test case of the scram transient tests is picked up in this paper as a typical case for the NC-DHRS. This test simulates loss-of-off-site-power and the transient boundary conditions of the analyses are given as input data, such as the core power decrease, primary pump coast-down curve, secondary side inlet flow rates and temperatures of the IHX, inlet air temperature and flow resistance decrease of the air damper.
3.2.2.1. One-dimensional safety analysis
The one-dimensional flow network model applied to the sodium test is shown in , in which the characteristics of the test loop such as the pressure losses in the primary system and PRACS, and heat transfer coefficients in the IHX, PHX and air cooler are given based on functional test results of the loop as input data.
Figure 18. One-dimensional modeling for the sodium test analysis.
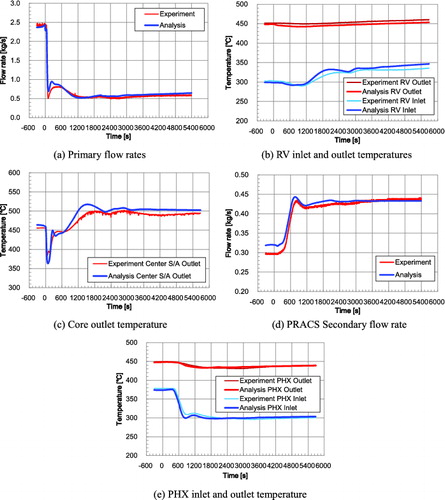
The analysis results are shown in for the primary flow rate, inlet and outlet temperature of the RV, core outlet temperature, secondary flow rate in the PRACS, and the secondary inlet and outlet temperatures of the PHX, compared with the test results. The primary flow rate behaves quite similarly to that of the water test result in the loss-of-off-site-power case, and the analysis results of the primary flow rate, inlet and outlet temperatures of the RV show good agreement with the test results, including the core outlet temperature. The analysis results of the secondary flow rate in the PRACS and secondary inlet and outlet temperatures of the PHX also show good agreement with the test results.
Figure 19. One-dimensional analysis results for the sodium test.
3.2.2.2. Three-dimensional fluid analysis
shows a constructed three-dimensional mesh division for STAR-CD to simulate the geometry of the primary system, PRACS and air cooler. The total number of meshes is about 3,900,000. Almost all of the characteristic data and the boundary condition data are incorporated into the three-dimensional calculation as in the one-dimensional safety analysis, but the pressure drops and heat transfer coefficients due to wall friction inside the primary and PRACS components are internally calculated by STAR-CD and the air flow rate is calculated based on the buoyancy in the air cooler with the stack and air side pressure loss, including the air damper.
Figure 20. Three-dimensional modeling for the sodium test analysis.
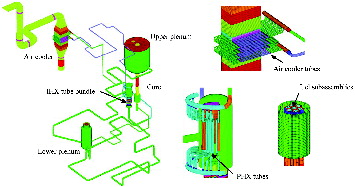
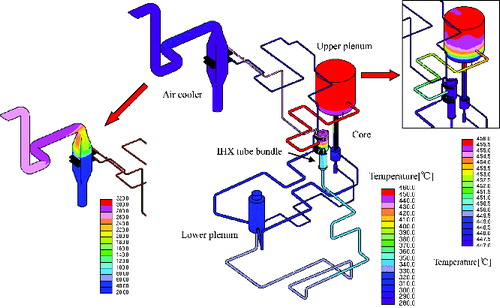
shows the analysis results of the primary flow rate, inlet and outlet temperature of the RV, core outlet temperature, secondary flow rate in the PRACS, secondary inlet and outlet temperatures of the PHX, and air flow rate as compared with the test results. The analysis results of the primary flow rate and the temperatures at the inlet and outlet of the RV show good agreement with the test results, including the core outlet temperature. The analysis results of the secondary flow rate in the PRACS and the secondary inlet and outlet temperatures of the PHX also show good agreement with the test results, including the air flow rate. The temperature distributions in the primary system and PRACS at the natural circulation condition (3600 seconds after the trip) are shown in . Thermal stratification occurs in the upper plenum of the RV and the temperature distribution due to a bypass flow occurs between the heat transfer tube bundle and its casing in the air cooler.
Figure 21. Three-dimensional analysis results for the sodium test.
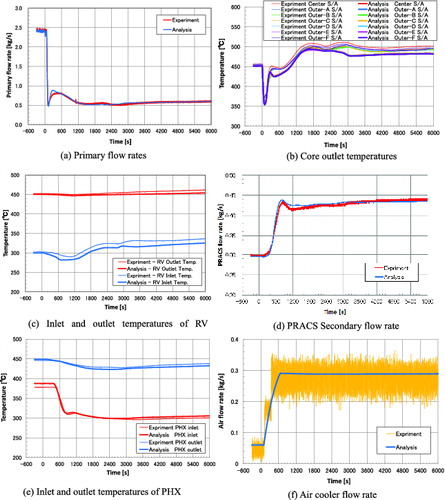
Figure 22. Temperature distribution in PLANDTL under the natural circulation condition (at 3600 seconds).
4. Application to SFR
4.1. Comparison of one-dimensional evaluation with three-dimensional evaluation
The one-dimensional safety analysis is applied to the statistical safety evaluation which enhances the objectivity of the safety evaluation for the NC-DHRS toward future licensing. Since the model scales of the water test and sodium test used for the validation of the safety analysis are as small as 1/10 and 1/7, respectively, it is necessary to confirm whether the safety analysis can sufficiently take into account the local phenomena and scale effect (Re-number dependency). On the other hand, the three-dimensional fluid flow analysis can predict convections and thermal stratifications locally occurring in each component with natural circulation flow rates in the cooling systems, and it can evaluate the scale effect based on an incorporated turbulence model. Thus, a confirmation analysis has been performed with both methods for the SFR of the plant scale and the results of the safety analysis are compared with those of the three-dimensional analysis.
4.1.1. Evaluation condition
A comparison has been made for a representative event, loss-of-off-site-power of the NC-DHRS. Since the aim of the comparison is to confirm the scale effect concerning multi-dimensional thermal-hydraulic phenomena, the following parameters are made basically common to both methods: the geometries, thermal-hydraulic performance of each component in the primary system and DHRS, boundary conditions such as the core power decrease, pump coast-down curve and heat removal due to the secondary side of the IHX, and the initial condition. The configuration of the safety analysis model is shown in and the knowledge obtained from the water test analyses has been reflected in the modeling parameters of the SFR plant analysis. The configuration of the three-dimensional analysis is shown in .
4.1.2. Comparison and discussion
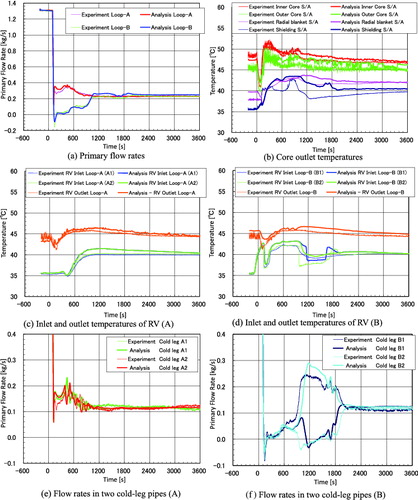
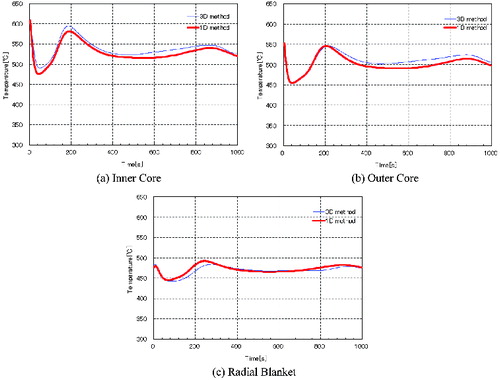
shows comparisons of the flow rates and temperatures in the primary system and DHRS (PRACS and DRACS). The discrepancy of the DHX secondary outlet temperature shown in (c) is caused by the temperature discrepancy at the primary inlet of the DHX installed in the upper plenum of the RV where thermal stratification occurs, as shown in . Although the one-dimensional model cannot predict thermal stratification as correctly as the three-dimensional model, almost all the comparison results show good agreement. The comparison of each primary flow rate in the two cold-leg pipes of the primary loop is shown in . Although the flow rates in the two cold-leg pipes of the safety analysis behave identically, those of the three-dimensional analysis behave differently, showing an out-of-phase oscillation for the two cold legs. The oscillating phenomena in the parallel cold-leg pipes occur similarly at the water test and its analysis for the same event after the primary pump trip. The amplitude of the oscillations increases violently at 1500 seconds in this analysis for the SFR because relatively cold fluid enters the vertical part in one of the cold-leg pipes earlier than the other cold-leg pipe and accelerates the downward flow in the cold-leg pipe due to its buoyancy force when the fluid cooled by the PHX reaches the cold-leg pipes. Afterward the primary flow rates in the two parallel cold-leg pipes approach each other and a stable natural circulation is established in the primary system because the cold-leg pipes, including the vertical part, are filled with cold fluid cooled by the PHX. The violent increase of the oscillation amplitude is not observed in the water test of loss-of-off-site-power and its analysis result. The turbulence condition is almost kept in the water test, since the Re number at the primary piping is about 5000 or more under the natural circulation condition. The Re number of the SFR plant, however, is about 200 times larger than that of the water test. The discrepancy of the Re number influences an unstable buoyant flow in the annular region of the IHX which induces the oscillating phenomena, and the scale effect is significant in the analysis result. The primary flow rate hardly decreases even when the coolant flows partially to one side of the cold-leg pipes, since the pressure drop in the cold leg is sufficiently small amounting only to 4% of the total pressure drop in the primary loop. shows comparisons of the core outlet temperatures around the secondary peak after the primary pump coast down. Each result shows good agreement.
Figure 23. Comparison between one-dimensional and three-dimensional analysis results for the SFR.
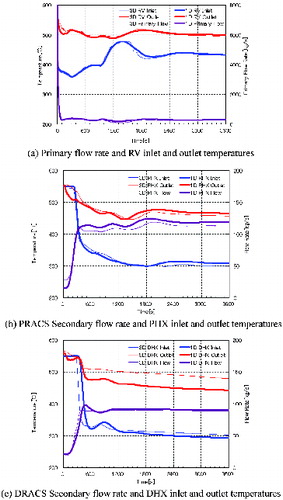
Figure 24. Temperature distribution in the SFR plant under the natural circulation condition (at 3600 seconds).
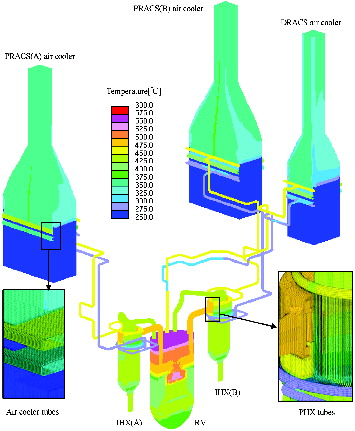
Figure 25. Flow rates in two cold-leg pipes of the SFR plant.
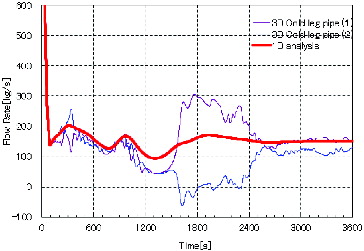
Figure 26. Comparison of core outlet temperature transients between one- and three-dimensional analysis results.
One of the factors to determine the natural circulation flow rate is the total pressure drop in the primary loop. Under the natural circulation condition, the pressure drops are about 38% in the core, 44% in the primary pump, 8% in the tube bundle of the IHX and the remaining 10% in the piping, and the pressure drops in the plena are very small. Another determining factor is the natural circulation head due to the temperature distribution in the primary loop. The one-dimensional mixing models rely on the Ri number which has been verified by the water test simulating the SFR plant based on the similarity rule and assembled into the safety analysis method so that the outlet temperatures of the upper and lower plena in the RV and the lower plenum in the IHX can be well simulated. The flow regime in the fuel subassemblies, tube bundle of the IHX and primary piping becomes almost one dimensional in the flow direction when a flow rate exists, causing a significant pressure drop. Moreover, the heat transfer coefficients on the surfaces of the fuel pins and heat transfer tubes are hardly influenced by the wall turbulence because the heat conductivity of the coolant sodium is very high and the flow velocities are low (the Pe number is small) under the natural circulation condition. From these considerations, it can be regarded that the results of the safety analysis and three-dimensional analysis show good agreement. On the other hand, since the three-dimensional analysis can simulate detailed phenomena such as the flow rate oscillation and the thermal stratifications in the plena which cannot be simulated by the one-dimensional safety analysis, it is expected that the three-dimensional analysis can support the safety analysis in future licensing of the SFR with the experimental results.
4.2. Statistical core hot spot temperature evaluation
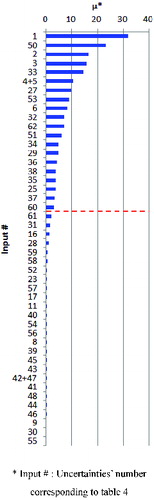
The statistical core hot spot temperature evaluation has been performed for the maximum fuel cladding temperature of the secondary peak at loss-of-off-site-power according to the procedure described in Section 2.3. The uncertainties concerning the input data for the safety analysis have been selected according to the PIRT. The number of the uncertainties is 63, and the ranges and the statistical characters of the uncertainties have been determined based on the plant designer's knowledge, as shown in . High importance uncertainties have been extracted according to the importance index μ* [Citation21] based on the global sensitivity analysis, and the high importance uncertainties are shown in order of the magnitude of μ* in . The decay heat, specific heat of coolant sodium, pressure drop in the fuel bundle, pressure drop in the primary pump, etc., are recognized as high importance uncertainties from the global sensitivity analysis. The 29 uncertainties with small μ* are regarded as negligible and constant nominal values are assigned to these uncertainties for the safety analyses. Two epistemic uncertainties of the delay time of the primary pump trip and the friction torque of the primary pump are recognized as the high importance uncertainties from the global sensitivity analysis. The number of sampling processed by the outer loop in the “double loop sampling structure” [Citation22] to obtain a sufficient convergence is estimated as follows:
Table 4. Uncertainties for the hot spot temperature evaluation.
Figure 27. Result of global sensitivity analysis for loss of off-site power.
The number of sampling for an aleatory uncertainty processed in the inner loop can be obtained from the reliability level P regardless of the number of uncertainties. If the reliability level is higher than 95% (P = 0.95, % error in P ≦ 5), the number of sampling N for an aleatory uncertainty is estimated by the method of Ang and Tang [Citation24] as follows:
The number of sampling for the aleatory uncertainty processed in the inner loop is estimated to be 85 or more, so that 850 or more cases of the safety analysis are required in total. The safety analysis has been performed for 1000 cases in which the number of sampling for the epistemic uncertainties is 10, and 100 for the aleatory uncertainties.
The cumulative density functions of the hot spot temperature from 1000 cases of the safety analysis are shown by the black colored curves in . The total number of curves is 10 which equals the sampling number of epistemic uncertainties. The scattered range of the curves shows a possible range of the cumulative density functions due to the epistemic uncertainties. The temperature 666 °C at the cumulative density function of 0.95 on the extreme right-hand side black curve is the hot spot temperature with a reliability level of 95%.
Figure 28. Cumulative density function of hot spot temperature for loss of off-site power.
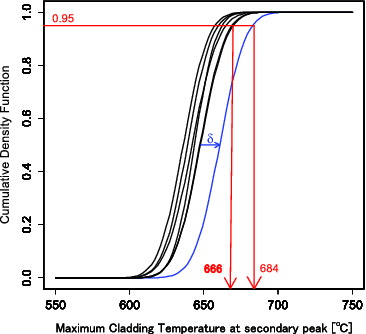
In the next step, the modeling error and the numerical calculation error of the safety analysis are taken into account. The validation errors of the primary flow rate and the core inlet temperature which directly influence the hot spot temperature are assigned to the modeling error. The modeling error of the primary flow rate is 50 kg/s into which the validation error is converted by the similarity rule of the Ri number, based on the water test analysis results. On the other hand, the modeling error of the core inlet temperature is 0 °C because the temperature does not change until the secondary peak temperature buildup. The numerical calculation error can be reduced to less than 1% at the maximum by the GCI method [Citation23]. Therefore, the whole-core analysis, which uses the primary flow rate involving its error as the boundary condition, has been performed to evaluate the hot spot temperature rise δmodel and then the cumulative density function curve described above is shifted by δmodel to the right, as shown by the blue colored curve in . The hot spot temperature is finally obtained as 684 °C with more than 95% reliability for the loss-of-off-site-power case. The hot spot temperature 684 °C is lower than 708 °C due to the deterministic safety analysis without the temperature flatting effect in the core, and the hot spot temperatures evaluated in the statistical analysis and in the deterministic analysis are sufficiently lower than 830 °C, the safety criterion for the SFR.
5. Conclusion
A natural circulation evaluation methodology has been developed to ensure the safety of the large-scale SFR adopting the NC-DHRS. The methodology consists of a one-dimensional safety analysis which can evaluate the core hot spot temperature taking into account the temperature flattening effect due to the buoyancy force in the core, a three-dimensional fluid flow analysis which can evaluate the thermal-hydraulics for local convections and thermal stratifications in the primary system and DHRS, and a statistical safety evaluation method which has been introduced to the hot spot temperature evaluation ensuring the objectivity of the evaluation. The safety analysis method and the three-dimensional analysis method have been validated using the results of the 1/10 scaled water tests and sodium tests of PLANDTL and the applicability of the safety analysis for the SFR has been confirmed by comparing with the three-dimensional analysis adopting the turbulence model. Furthermore, statistical safety evaluation has been performed for the SFR using the safety analysis method.
Concluding remarks of this study are as follows:
The safety analysis and three-dimensional analysis can simulate the water and sodium test results very well.
The one-dimensional safety analysis can well simulate the transient phenomena in the primary system and DHRS after the reactor trip with a short computational time.
The three-dimensional analysis can predict the transient phenomena, including the local thermal-hydraulic phenomena in detail and becomes quite useful to support the safety analysis in future licensing of the NC-DHRS, although it requires much computational time.
The statistical safety evaluation method is quite useful for future licensing of the NC-DHRS, in which the small primary flow rate and temperature distribution interact strongly to dominate the flows.
The NC-DHRS would be applicable to SFRs of any electric output regardless of the reactor type, the loop or the tank, if the heights of the components are arranged appropriately in the primary system and DHRS.
Acknowledgements
The authors are grateful to Prof. H. Ohashi of the University of Tokyo, Prof. T. Okawa of the University of Electro-Communications and Dr M. Uotani of CREAPI for their helpful comments to perform this study. Special thanks are due to Mr T. Koga of CRIEPI for his help in conduction of the 1/10 scaled water test and Ms. M. Suemori of MFBR for her help in the development of the three-dimensional analysis method. This paper describes the outlines of “Development of Natural Circulation Evaluation Methods for Decay Heat Removal” entrusted to “Mitsubishi FBR Systems, Inc.” supported by the Ministry of Education, Culture, Sports, Science and Technology of Japan (MEXT).
References
- Sawada M, Arikawa H, Mizoo N. Experiment and analysis on natural convection characteristics in the experimental fast reactor Joyo. Nucl Eng Design. 1990;120:341–347.
- Yamaguchi A, Oiwa A, Hasegawa T. Plant wide thermal hydraulic analysis of natural circulation test at Joyo with MK-II irradiation core. Proc. NURETH-4; Karlsruhe (F.R. Germany); 1989.
- Kotake S, Sakamoto Y, Mihara T, et al. Development of advanced loop-type fast reactor in Japan. J Nucl Technol. 2010;170:133–147.
- Nishimura M, Kamide H, Hayashi K, Momoi K. Transient experiments on fast reactor core thermal-hydraulics and its numerical analysis inter-subassembly heat transfer and inter-wrapper flow under natural circulation conditions. Nucl Eng Design. 2000;200:157–175.
- Standard method for safety evaluation using best estimate code based on uncertainty and scaling analysis with statistical approach ( AESJ-SC-S001). Tokyo: Atomic Energy Society of Japan; 2008. Japanese.
- Koga T, Murakami T, Eguchi Y, Watanabe O, et al. Water test of natural circulation for decay heat removal in JSFR. Proc. NURETH-14; Toronto (Canada); 2011.
- Kamide H, Kobayashi J, Ono A, Watanabe O, et al. Sodium experiment on fully natural circulation systems for decay heat removal in Japan sodium-cooling fast reactor. Proc. NURETH-14; Toronto (Canada); 2011.
- Murakami T, Eguchi Y, Ohyama K, Watanabe O. Reduced scale water test of natural circulation for decay heat removal in loop type sodium-cooled fast reactor. Nucl Eng Design ( in printing).
- Ono A, Kamide H, Kobayashi J, Watanabe O. An experimental study on natural circulation decay heat removal system for a loop type fast reactor. J Nucl Sci Technol. ( under review).
- Kazuhiro O, Endo J, Doda N, Ono A, Murakami T, Watanabe O. Development of natural circulation analysis methods for a sodium cooled fast reactor. J Nucl Sci Technol. ( under review).
- Doda N, Ohshima H, Kamide H, Watanabe O. Development of core hot spot evaluation method for a loop type fast reactor equipped with natural circulation decay heat removal system. J Nucl Sci Technol. ( under review).
- Yamada F, Ohira H. Numerical simulation of Monju plant dynamics by Super-COPD using previous startup tests data. Proc. FEDSM-ICNMM2010; Montreal (Canada); 2010.
- Watanabe O, Kotake S, Kubo S, et al. Study on natural circulation evaluation method for a large FBR. Proc. NURETH-8; 1997 Apr; Kyoto (Japan); 1997.
- Ninokata H, Efthimiadis A, Todreas NE. Distributed resistance modeling of wire-wrapped rod bundles. Nucl Eng Design 1987;104:93–102.
- Methodology STAR-CD version 4.14. CD-adapco; 2010.
- Cheng S-K, Todreas NE. Hydrodynamic models and correlations fore bare and wire-wrapped hexagonal rod bundles - Bundle friction factors, subchannel friction factors and mixing parameters. Nucl Eng Design 1986;92:227–251.
- Dwyer OE. Eddy transport in liquid-metal heat transfer. AIChE J. 1963;9:261–268.
- Jameson SL. Tube spacing in finned tube banks. ASME Trans. 1945;67:633–642.
- Wilson G E, Boyack BE. The role of the PIRT in experiments, code development and code applications associated with reactor safety assessments. Nucl Eng Design 1998;186:341–347.
- Boyack BE, Duffey RB, Griffith P, et al. Quantifying reactor safety margins: application of CSAU methodology to LBLOCA, part 1: an overview of the code scaling, applicability, and uncertainty evaluation methodology. Nucl Eng Design 1990;119(1):1–5.
- Saltelli A, Ratto M, Andres T, Campolongo F, et al. Global sensitivity analysis the primer. New York: Wiley; 2008.
- William LO, Christopher JR. Verification and validation in scientific computing. New York: Cambridge University Press; 2010.
- Roache PJ. Fundamentals of verification and validation. Albuquerque (NM): Hermosa Publishers; 2009
- Ang AH-S, Tang WH. Probability concepts in engineering: emphasis on applications to civil and environmental engineering. New York: Wiley; 2006.