
 ?Mathematical formulae have been encoded as MathML and are displayed in this HTML version using MathJax in order to improve their display. Uncheck the box to turn MathJax off. This feature requires Javascript. Click on a formula to zoom.
Abstract
The variations in the nuclear waste management performance have been assessed for 40 fuel-cycle examples with the calculation of the mass, activity, toxicity and decay heat of spent nuclear fuel and high-level waste at 10, 100 and 100,000 years after reactor discharge. The variation in the 10 years activity is primarily due to the variation in the specific activity of the fission products, which is higher for thorium fuel cycles, and is reduced when the fuel residence time is long. The variation in the 100,000 years activity is primarily explained by the quantity of U-233 and Pu-239 sent to nuclear waste, which is linked to the type of fuel and of reprocessing scheme employed. The difference between the inhalation toxicity and the activity is explained by the variations in the effective dose coefficients since heavy actinides such as Pu, Am and Cm have a predominant effect on the inhalation toxicity. Materials for disposal such as fission products and transuranics are responsible for most of the mass, and radiotoxicity of high-level waste, but the reprocessing/separation losses also have a potentially significant impact on the results.
1. Introduction
One of the key objectives of the US Department of Energy (DOE) Nuclear Energy R&D Roadmap is the development of sustainable nuclear fuel cycles that can improve natural resource utilization and provide solutions to the management of nuclear wastes [Citation1]. Recently, an evaluation and screening of fuel-cycle systems has been conducted [Citation2] to identify those options that provide the best opportunities for obtaining such improvements and also to identify the required research and development activities that can support the development and deployment of such advanced fuel-cycle options. As part of that evaluation and screening, a set of 40 fuel-cycle examples were analyzed to provide a comprehensive spectrum of options and they form the basis of this paper. The titular summary descriptions of the 40 fuel-cycle examples discussed in this paper are provided in Appendix 1. Detailed description is available in [Citation2,Citation3]. These options include those pertaining to (1) once-through fuel-cycle strategies in which only spent nuclear fuel (SNF) is sent to disposal, examples 1–8; (2) limited recycle strategies in which used nuclear fuel can be recycled a limited number of times and consequently both SNF and high-level waste (HLW) are sent to disposal, examples 9–18; and (3) continuous recycle strategies in which fuel is continuously recycled and only processing losses or unrecycled elements are sent to disposal as HLW, examples 19–40.
As part of the evaluation and screening study, evaluation metrics were defined for informing the nuclear waste management evaluation criterion, one of the high-level criteria considered. Some of the evaluation metrics considered for nuclear waste management criterion include quantity of waste estimated with the mass of SNF+HLW to be disposed and the volume of low-level waste, which are not considered in this paper. Others included the characteristics of the SNF+HLW at different time points.
The high level of radioactivity of the SNF+HLW drives the requirements for shielding during handling/ storage and isolation for disposal. The activity at 10, 100 and 100,000 years was selected for its ability to inform on the operational and handling challenges associated with SNF and HLW. While such a metric could be expressed in terms of heat generation, radiotoxicity or radiation field, all of these are caused by the total radioactivity, or “activity.” As complementary information to the activity, the inhalation and ingestion toxicity and the decay heat values of SNF+HLW were also calculated. As the activity (or any of these other measures) changes with time, it was necessary to select a representative time for operations and handling for disposal. Many waste management approaches include a significant delay prior to disposal to allow the initial very high level of activity to decay. A time of 100 years after discharge from a reactor was selected as being representative for the metric, but as complementary information, the value at 10 years after discharge was also evaluated. Similarly, a total activity at a representative time for geologic disposal is relevant to a range of issues including the radiotoxicity of the disposed wastes, and is dependent on the fundamental characteristics of the fuel cycle. A time of 100,000 years was chosen to represent the long-term isolation challenge.
The mass of SNF and HLW is extracted from the fuel composition discharged from the reactor at equilibrium calculated by the developer of each fuel-cycle example. The activity of the nuclear waste mass at 10, 100 and 100,000 years after reactor discharge were calculated by modeling the decay of the nuclides using the ORIGEN2 code [Citation4]. For the fuel-cycle examples 9–40 involving fuel reprocessing, it was assumed that 1% of the processed fuel is processing losses to disposal as HLW, except for the fuel-cycle examples 10 and 26 that adopted online reprocessing with molten salt reactors. It was also assumed that the post-irradiation time is five years and the reprocessing is promptly completed. The time lag from fuel fabrication to fuel charging was assumed to be two years. It is noted that the mass flow data of the 40 fuel-cycle examples had been developed using assumed thermal efficiencies for specific reactor and externally driven system (EDS) technologies. To be technologically independent and to focus on physics differences the parameters were renormalized using a uniform thermal efficiency of 33% and the activity, toxicity and decay heat of the nuclear wastes were normalized to the unit energy generation.
The comparisons of the activity, the inhalation and ingestion radiotoxicity, and decay heat values at the three different time points for the 40 fuel-cycle examples revealed some interesting physics trends that are reported in this paper. First, the variations in the total mass of radioactive waste are analyzed in Section 2. In Section 3, a global overview of the results obtained is presented prior to analyzing the variations in the short-term and long-term nuclear waste management performances. A sensitivity analysis to the reprocessing/separation losses is performed in Section 4. Finally, the conclusions of the study are provided in Section 5.
2. Variations in the mass of SNF and HLW
The mass of HLW and SNF generated in the 40 fuel-cycle examples analyzed and normalized to unit electricity generation (t/GWe-yr) is displayed in . Note that the depleted uranium, the extra recovered uranium or thorium, and the activation products are not considered as HLW in the accounting for this study. The variations in the mass of SNF and HLW are primarily explained by the recycling strategy employed. As observed in , the continuous-recycle strategies consistently display low masses of HLW where the main contribution to its mass come from the fission products and from the 1% of losses due to separation. For once-through recycled strategies, the main components are uranium and thorium.
Figure 1. Mass of HLW and SNF per GWe-yr with the composition at 10 years after discharge.
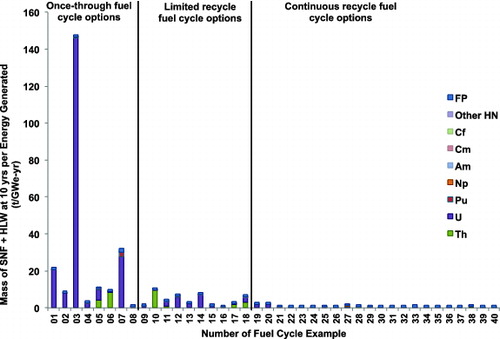
Variations in the mass of SNF and HLW are also explained by differences in burnup reached for the average discharge fuel in the different reactor systems analyzed. The discharge burnup is 7.5 GWd/tHN in fuel-cycle example 3 based on once-through natural-uranium-fueled heavy water reactor (HWR) system, and 277 GWd/tHN in fuel-cycle example 4 based on once-through breed and burn sodium-cooled fast reactor (SFR). The burnup is directly proportional to the annual mass flow of fuel per unit of GWe-yr, which is equal to the mass flow of SNF for once-through fuel cycles, and is proportional to the reprocessing losses for continuous-recycle fuel cycles.
The thermal efficiency also affects proportionally the mass of waste, and systems with lower thermal-efficiency will display proportionally higher mass of SNF and HLW generated. As already mentioned, the parameters were renormalized in this analysis using a uniform thermal efficiency of 33%. It is noted that there are still some small differences that are due to the accelerator-driven systems (ADS) that need to generate additional electrical power to send 1 GWe-yr on the grid while operating the accelerator.
3. Variations in the radioactivity of SNF and HLW
3.1. Preliminary analysis of the variations in the radioactivity results
The total activity of SNF+HLW is shown in for the 40 fuel-cycle examples at 10, 100 and 100,000 years after discharge. It is noted that the SNF+HLW activity is normalized to unit electricity generation (Ci/GWe-yr). The averaged contributors to the activity are shown in and as a function of time in . The activity of SNF+HLW varies per the fuel-cycle examples and decreases with the time after discharge. It decreases about an order of magnitude from 10 to 100 years, which is primarily explained by the reduction of the activity of the fission products. The activity decreases by additional 2 or 3 orders of magnitude when the SNF+HLW decays till 100,000 years, which is still primarily explained by the decay of fission products, but also of americium and plutonium.
Figure 2. SNF+HLW activity of 40 fuel-cycle examples at 10, 100 and 100,000 years.
Table 1. Comparison of the values of the SNF+HLW management parameters calculated for the 40 fuel-cycle examples.
Figure 3. Time evolution of the contributors to SNF+HLW activity averaged over the 40 fuel-cycle examples.
As complementary information to the activity results, the decay heat of the SNF+HLW was calculated with ORIGEN2 taking into account the energy released per disintegration, and the inhalation toxicity and the ingestion toxicity of the SNF and HLW were calculated from the values of activity by applying EquationEquation (1)(1)
(1) taking into account the hazard of disintegration (a similar equation is used for the ingestion toxicity):
(1)
(1) where Tinhalation(t) [Sv] is inhalation toxicity after t years of decay, Ai(t) [Bq] is activity for isotope i after t years of decay and einhalationi [Sv/Bq] is effective inhalation dose conversion factor for isotope i obtained from the ICRP for 737 isotopes [Citation5].
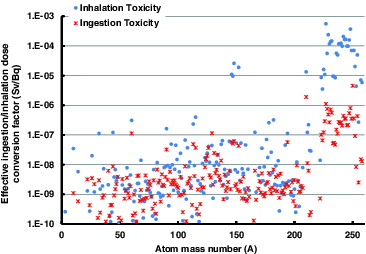
The values of the activity are weighted by the inhalation and ingestion dose conversion factors that strongly vary from one isotope to another, taking into account the hazard of the radioactivity in the lung and the digestive systems, respectively. This fact is illustrated in displaying the atomic mass evolution of the dose coefficients. The dose coefficients of the heavy nuclei are typically two to four orders of magnitude higher than those for the lower atomic mass elements, suggesting that actinides will play a predominant role in the toxicity parameter. In general, it has been observed that alpha-emitters have considerably larger dose coefficients than beta-emitters. The differences in the inhalation and ingestion toxicities that are observed in this study will be explained by the different values of effective dose conversion factors (Sv/Bq): the heavy nuclei have a much reduced effective ingestion dose conversion factor (∼two orders of magnitude) when compared to the effective inhalation dose conversion factor. This indicates that the actinides are far more hazardous if inhaled than ingested because they are more readily absorbed into the blood stream via the lungs than via the stomach.
Figure 4. Comparison of the effective ingestion and inhalation dose conversion factors.
Large variations in the values of the activity, toxicity and decay heat of the nuclear wastes (SNF+HLW) were observed for the different times of 10, 100 and 100,000 years after reactor discharge, which justifies their analysis in this paper. Those variations are summarized in , which contains:
The minimum and maximum values obtained for every parameter. The ratio (2.4 in the case of the activity 10 years after discharge) gives an estimate of the dispersion in the results.
The relative contributions of the different elements in the SNF+HLW of every parameter averaged over the 40 fuel-cycle examples. The elements of interest in this paper include: thorium (Th), uranium (U), plutonium (Pu), neptunium (Np), americium (Am), curium (Cm), californium (Cf), other heavy nuclei (HN) generated through the decay of actinides; and fission products (FP).
The correlation matrix between the values of the parameters. This analysis identified the statistical relationship between two parameters, and gives a value between 0 and 1. The bold numbers have a value greater than 0.80, which represents a strong linear correlation between the two considered parameters. Strongly correlated parameters are usually driven by similar phenomena that explain the variations in their results.
Results for 100 years are not included in , because this correlation analysis indicated that the results for 10 and 100 years always display a strong relationship, as also observed in , suggesting that variations in their results have very similar causes. The ingestion toxicity 10 years after discharge and the decay heat also display a relatively strong relationship with the inhalation toxicity. The ingestion toxicity and the decay heat at 100,000 years after discharge display a strong relationship with the inhalation toxicity and with the activity. However, the activity and inhalation toxicity at 10 years and 100,000 years after discharge display a poor correlation. As a consequence to this correlation analysis, this paper focuses mainly on the variations of the activity and inhalation toxicity at 10 years and 100,000 years after discharge for the 40 fuel-cycle examples.
3.2. Variations in the short-term nuclear waste management metrics
3.2.1. Variations in activity 10 years after discharge
The values of the activity 10 years after discharge for the 40 fuel-cycle examples are displayed with their components in . Large values of this parameter are observed in once-through, limited and continuous recycling options. For the 40 fuel-cycle examples, the average activity at 10 years after discharge is 1.1×10⁷ Ci/GWe-yr. The maximum value is for the fuel-cycle example 6 with 1.5×10⁷ Ci/GWe-yr and the minimum value is for the fuel-cycle example 4 with 6.5×10⁶ Ci/GWe-yr. Consequently, there is a ratio of a factor of 2.4 between the maximum and the minimum values of the activity 10 years after discharge. Across the 40 fuel-cycle examples, on average about 93% of the activity 10 years after discharge is due to the fission products (FP), 6% is due to plutonium (Pu) and 1% is due to curium (Cm):
Among the fission products, the leading nuclides are Cs-137 (and its beta-daughter Ba-137m) and Sr-90 (and its beta-daughter Y-90) with half-lives of 30 and 29 years, respectively.
Among the Pu isotopes, the leading isotope is Pu-241 with a half-life of 14 years.
Among the Cm isotopes, the leading isotope is Cm-244 with a half-life of 18 years.
Figure 5. Contributions to SNF+HLW activity at 10 years after discharge.
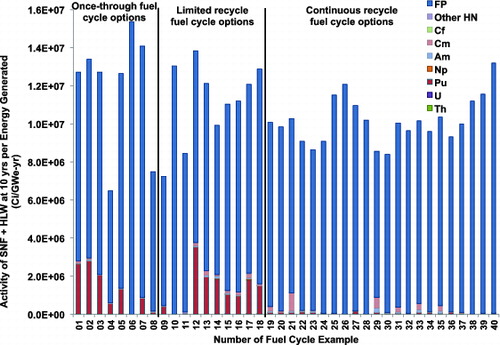
As a consequence, the variation by a factor of 2.4 in the activity 10 years after discharge is primarily due to the variation in the quantity and specific activity of the fission products. Secondly, the presence of Pu-241 in some fuel cycles explains some variations in the activity 10 years after discharge for U/Pu fuel cycles (the effect of Cm-244 on the activity can be neglected for this analysis).
3.2.1.1. Variations in the quantity of FP
As aforementioned, the results analyzed were re-normalized for 33% thermal efficiency. This means that the quantity of fission products generated per GWe-yr should be similar in every fuel-cycle example and equal to ∼1.14 tFP/GWe-yr. Some observed variations are explained by the difference between the 33% thermal efficiency of the system and the effective thermal efficiency. The effective thermal efficiency is sometimes lower than 33% when accounting for the additional power required to operate the accelerator in an EDS like an ADS. For instance, it is 20.7% for the fuel-cycle example 7, which employs an ADS to irradiate natural uranium fuel in a breed and burn once-through strategy. Consequently, the variation in the mass of FP generated is directly explained by the ratio between the effective efficiency and the 33% thermal efficiency of the system. For the fuel-cycle example 7, this means that the effective mass of fission products is (33%)/(20.7%)×1.14 = 1.82 tFP/GWe-yr. Two fuel-cycle exceptions are for the fusion-fission hybrid (FFH) systems (fuel-cycle examples 6 and 8) where 20%–25% of the thermal power is generated by the fusion source, reducing by the same fraction the mass of fission products generated in these systems. Consequently, the activity 10 years after discharge is increased in the ADS (and FFH to a lesser extent) cases, where the mass of FP is larger than the average because FP plays such a large role in the activity 10 years after discharge. This is especially observed for the fuel-cycle example 7 where a large part of additional power is generated (with the 33% normalization) to operate the accelerator, leading to a significant additional quantity of fission products.
3.2.1.2. Variations in the activity of FP
The variation in the quantity of FP does not explain the difference in the activity 10 years after discharge of fuel-cycle examples 6 and 4, for instance. In these cases, it is the variation in the activity of the FP that matters. In fact, the 10 years activity normalized per ton of FP generated in the fuel-cycle example 4 is 5×10⁶ Ci/tFP, which is significantly lower than for the fuel-cycle example 6 for which it is 1.2×10⁷ Ci/tFP. The specific activity of the fission products is displayed for every fuel-cycle example in . The different fission yields and residence times are the two main causes for this observed variation.
Figure 6. Specific activity of the fission products 10 years after discharge.
Fission yield
displays the activity for the fission products at 10 years, generated from fission of one mole of U-233, U-235 and Pu-239 in both thermal and fast spectra. It has been noted that Cs-137 and Sr-90 are the two main contributors to the activity at 10 years after discharge. The decay daughters, Ba-137m and Y-90 give the same activity as their parents since they have a much shorter decay time. The neutron spectrum of the reactor or EDS does not significantly impact the activity of the fission products generated. There is however as much as 30% of difference in the activity of the FP from U-233 when compared with the FP from Pu-239. This difference is explained by the much smaller fraction of Sr-90 (and consequently of Y-90) in the fission yields of Pu-239 when compared to U-233. The fission product yield of Sr-90 (and its direct parents) is 6.8% for U-233, 5.8% for U-235 and 2.1% for Pu-239 because the left peak of the fission yield shifts to higher atomic number as the fissile nuclide becomes heavier. This explains why most of the fuel-cycle examples using Th fuel (5, 6, 8, 10, 11, 17, 18, 25, 26, 27, 28, 37, 38, 39 and 40) have the highest specific activity of fission products at 10 years. The only exceptions are the fuel-cycle examples 11 and 8, due to the influence of residence time on the activity as explained in the following section.
Figure 7. Comparison of fission products activities after 10-year cooling following fission of U-233, U-235 and Pu-239 in fast and thermal spectra.
Fuel residence time
A long residence time of the fuel in the reactor leads to the lowest total activity at 10 years. This is especially observed for fuel-cycle examples 4, 8, 9 and 11 that have a fuel residence time greater than 25 years, compared to the other fuel cycles that have a residence time shorter than 10 years. This trend is because the activity of Sr-90 and Cs-137 (including decay daughters) varies with the fuel residence time. It was already noted with that these nuclides are dominant contributors to the FP activity at 10 years, their half-lives (∼30 years) are typically longer than the cycle length per batch, and the neutron capture cross-sections are negligibly small. Thus, these nuclides are accumulated in the core without saturating. Total fissions occurring in the core from the time of fuel charge to discharge are comparable in all fuel-cycle examples because the values are normalized to unit electricity generation. As a result, comparable Sr-90 and Cs-137 nuclides are created with minor variations due to the different fission yield values depending on fissile nuclides. However, the long fuel residence time increases the decay of these nuclides in the core. For instance, fuel-cycle example 4 adopts a 34-batch scheme with 1.5-year cycle length, while example 1 adopts a 3-batch scheme with 1.0-year cycle length. Thus, total decay time for example 4 in the core is much longer than that of example 1. Consequently, the normalized FP activity is small for the fuel-cycle examples that have a long fuel residence time.
3.2.1.3. Variations in the fraction of Pu-241
Pu-241 can be responsible for up to 25% of the activity 10 years after discharge. Its part is only significant for uranium–plutonium fuel cycles without continuous reprocessing of plutonium. Among these fuel cycles, there is still a significant discrepancy in the activity generated by the Pu at 10 years after discharge (comparing, for instance, once-through fuel-cycle examples 1 and 2 with example 4). This difference is explained not only by the difference in the discharged mass of Pu but more importantly by the larger fraction of Pu-241 generated in thermal spectrum systems (15%–20% of Pu-241 content in the Pu) when compared with the fast spectrum systems (2%–3% of Pu-241 content in the Pu).
3.2.1.4. Comparison of the activity at 10 years after discharge between specific fuel cycles
For completeness, the different results obtained with some couples of fuel cycles are explained as follows:
Fuel-cycle examples 4 and 6 have the lowest and highest activity values, respectively, at 10 years after discharge, which is nearly exclusively explained by their fission products. The fuel-cycle example 4 is a breed and burn fuel cycle using an SFR with natural uranium fuel (fissile element is Pu-239) and a very long residence time of about 50 years. As a consequence, it benefits both from the lower activity of the Pu-239-based fission products and from their decay during the long residence time. On the other hand, the fuel-cycle example 6 is an FFH fuel cycle using thorium fuel (fissile element is U-233) and with a short residence time of 3.7 years.
Fuel-cycle examples 21 and 22 are two pressurized water reactor (PWR) fuel cycles involving the recycle of transuranic elements (TRU). The only difference between these scenarios is the continuous recycling of the minor actinides in the case of fuel-cycle example 22 while these are sent to waste for fuel-cycle example 21. The difference in the activity at 10 years after discharge observed in these two options is explained by the curium being sent to waste disposal in example 21. Note that for thermal spectrum, curium build-up with irradiation is important. This effect will have a much larger impact on the toxicity and on the decay heat.
Fuel-cycle examples 1 and 22 are two PWR fuel cycles but the specific activity at 10 years after discharge for the fission products of fuel-cycle example 1 is 8.6×10⁶ Ci/tFP while it is 7.9×10⁶ Ci/tFP for fuel-cycle example 22, as displayed in . Fuel-cycle example 1 uses low-enriched uranium (LEU) in once-through system, while fuel-cycle example 22 involves fuel for continuous reprocessing of plutonium. As a consequence, the fraction of U-235 over Pu-239 fissions is higher in the case of fuel-cycle example 1 than for fuel-cycle example 22. Thus, the higher 10 years specific fission products activity of fuel-cycle example 1 is explained by the 22% higher activity of U-235 versus Pu-239, as displayed in .
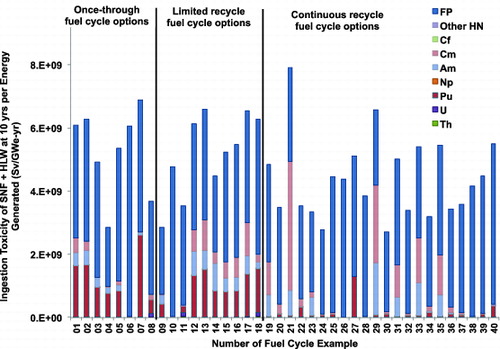
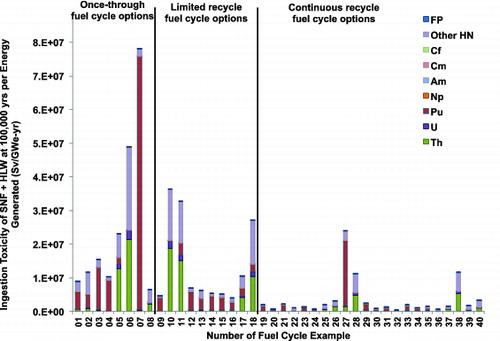
3.2.2. Variations in inhalation toxicity 10 years after discharge
The inhalation toxicity 10 years after discharge is displayed in . There is a very large variation (by a factor of ∼90) in the values observed with a minimum inhalation toxicity of 2.6×10¹⁰ Sv/GWe-yr for the fuel-cycle example 10 and a maximum value of 2.4×10¹² Sv/GWe-yr for the fuel-cycle example 21. The average contributions of the elements to the values of the inhalation toxicity 10 years after discharge are summarized in . It is observed that 40% contribution is due to plutonium, 23% to americium and 34% to curium. Note that fission products contribute only to 2% of this parameter.
Figure 8. Contributions to SNF+HLW inhalation toxicity at 10 years after discharge.
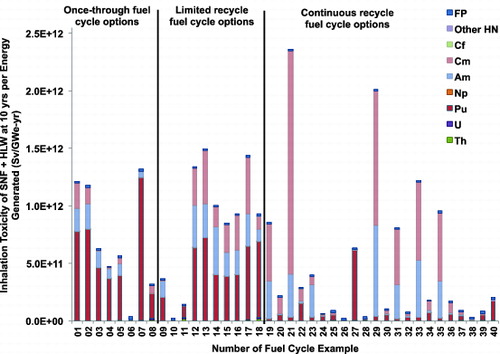
As a consequence, thorium fuel cycles such as fuel-cycle examples 6, 8, 10, 26, 28, 38 and 40, always display low values of inhalation toxicity 10 years after discharge (<3.2×10¹¹ Sv/GWe-yr). Uranium fuel cycles, on the other hand, display low inhalation toxicity values only when 99% of their TRU content is being reprocessed (the remaining 1% are the assumed reprocessing losses). This is the case, for instance, for fuel-cycle examples 20, 22, 24, 30, 32, 34 and 36 that have an inhalation toxicity 10 years after discharge that is lower than 3×10¹¹ Sv/GWe-yr. The sensitivity to the separation/reprocessing loss parameter is analyzed in Section 4 based on fuel-cycle example 32.
Large values of inhalation toxicity at 10 years after discharge are always observed with uranium-based fuel cycles that have large amounts of Pu-241 in the waste, those are especially the once-through and limited recycle fuel cycles options 1, 2, 7, 12 and 13. The largest values of inhalation toxicity 10 years after discharge (>1.0×10¹² Sv/GWe-yr) are always observed in uranium-based fuel cycles with thermal systems where minor actinides are not being recycled such as in fuel-cycle examples 1, 2, 7, 12, 13, 17, 21, 29, 31, 33 and 35. Note that curium is a predominant contributor for the fuel-cycle examples 21 and 29. These fuel cycles use PWR to recycle plutonium in mixed oxide fuels (MOX), generating a large fraction of Cm-244 (∼7–13 kg(Cm)/GWe-yr of discharged fuel) that is sent with other minor actinides into the wastes. This isotope has a strong impact on the inhalation toxicity due to its high dose conversion factor of 5×10⁻⁵ Sv/Bq.
3.2.3. Variations in ingestion toxicity 10 years after discharge
The ingestion toxicity 10 years after discharge is displayed in ; it is 2 orders of magnitude smaller compared to the inhalation toxicity. There is a factor of ∼3 between the maximum value of ingestion toxicity at 10 years after discharge obtained for the fuel-cycle example 21 (7.9×10⁹ Sv/GWe-yr) and the minimum value obtained for the fuel-cycle example 30 (2.7×10⁹ Sv/GWe-yr). The main components for the ingestion toxicity 10 years after discharge are fission products (73%), plutonium (11%), americium (6%) and curium (9%). It is interesting to note that displays a relatively satisfactory correlation between the ingestion toxicity 10 years after discharge, the activity 10 years after discharge and with the inhalation toxicity 10 years after discharge. The relationship between the ingestion toxicity and the activity is explained by the similar variations in the FP components. The relationship between the ingestion toxicity and the inhalation toxicity is explained by the similar variations in the Pu, Am and Cm components. As a consequence, uranium-based fuel cycles with continuous recycling of TRU such as examples 20, 22, 24, 30, 32 and 34 are responsible for the lowest values of ingestion toxicity 10 years after discharge. If only Pu is being continuously recycled instead of the entire TRU vector, fast systems (such as in example 23) still display low values of ingestion toxicity while thermal systems (such as examples 21, 29, 31, 33 and 35) display some of the largest values of ingestion toxicity 10 years after discharge because of curium build-up. Fuel cycles employing very long fuel residence time such as examples 4, 8, 9 and 11 also display some of the lowest values of ingestion toxicity 10 years after discharge.
Figure 9. Contributions to SNF+HLW ingestion toxicity at 10 years after discharge.
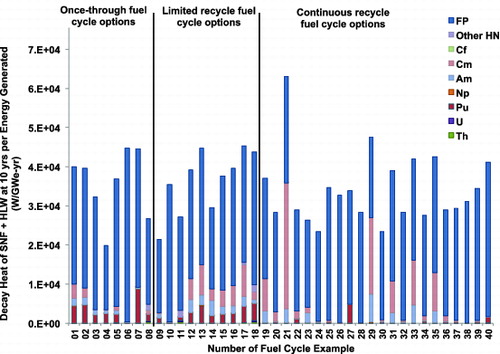
3.2.4. Variations in decay heat 10 years after discharge
The decay heat at 10 years after discharge is displayed in . There is a factor ∼3 between the maximum value of decay heat at 10 years after discharge obtained for the fuel-cycle example 21 (6.3×10⁴ W/GWe-yr) and the minimum value obtained for the fuel-cycle example 4 (2.0×10⁴ W/GWe-yr). As already noted in the previous section, the different contributors to the ingestion toxicity also explain the variations in the decay heat. This is also evident when comparing and . As a consequence, the largest values of decay heat at 10 years after discharge are also obtained with thermal systems in uranium-based fuel cycles that send minor actinides into the waste and the lowest values are obtained for fuel cycles with very long residence time and for uranium-based fuel cycles with continuous recycling of TRU.
Figure 10. Contributions to SNF+HLW decay heat at 10 years after discharge.
3.2.5. Variations in nuclear waste management metrics 100 years after discharge
The variations in nuclear waste management metrics at 10 and 100 years after discharge displayed a very strong correlation, which justified focusing on the 10 years values in this paper. For instance, 92% of the average activity at 100 years after discharge is still driven by fission products. However, slightly different phenomena drive the 10 and 100 years inhalation toxicity, ingestion toxicity and decay heat. As displayed in Sections 3.2.2, 3.2.3 and 3.2.4, Cm-244 and Pu-241 are responsible for the largest values of toxicity and decay heat 10 years after discharge; their impact disappear after 100 years to be replaced by Am-241 and Pu-238 with half-lives, respectively, of 432 and 88 years. As a consequence, uranium-based fuel cycles that have large amounts of plutonium and minor actinides in their SNF or HLW are still responsible for some of the largest toxicity and decay heat parameters at both 10 and 100 years after discharge. This is especially true if the plutonium and minor actinides are generated in a thermal spectrum system because of the higher fraction of Pu-238 and Pu-241 in the plutonium vector and of the build-up of americium and curium.
3.3. Variations in the long-term nuclear waste management metrics
3.3.1. Variations in activity 100,000 years after discharge
The activity 100,000 years after discharge is poorly correlated to the activity 10 years after discharge, suggesting that different phenomena are responsible for the variations in these values. The variations in the 100,000 years activity are displayed in . There is indeed a factor of 25 between the lowest activity 100,000 years after discharge, which is 5.3×10² Ci/GWe-yr for the fuel-cycle example 32, and the highest value, which is 1.3×10⁴ Ci/GWe-yr for the fuel-cycle example 6. In this case, long-life fission products are only responsible for 20% of the SNF+HLW activity at 100,000 years after discharge on the average for the 40 examples. Note that in some continuous recycling cases such as fuel-cycle example 32, the fission products are the main components of the long-term activity. Uranium, thorium and the others heavy nuclei (that mainly come from the decay of actinides) are responsible for ∼62% of the activity 100,000 years after discharge. The remaining 18% are due to plutonium and discussed as follows:
Among the fission products, the leading nuclides are Tc-99, Cs-135 and Zr-93. These are not further investigated since every fuel-cycle example has a relatively similar activity 100,000 years after discharge that is attributable to these fission products.
Among the Pu isotopes, the leading isotope is Pu-239 with a half-life of 24,100 years.
Among the U isotopes, the leading isotope is U-233 with a half-life of 159,200 years. It decays into highly active heavy nuclei such as Th-229, Ac-225, Ra-225, Fr-221, At-217, Po-213, Bi-213 and Pb-209 that are responsible for higher SNF+HLW activity. Another significant long-term contributor associated with U-233 is U-234 that has a half-life of 246,000 years.
Figure 11. Contributions to SNF+HLW activity at 100,000 years after discharge.
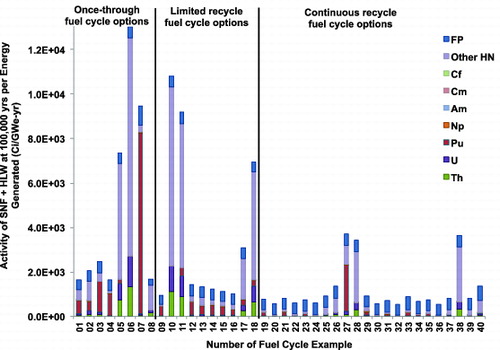
As a consequence, the variation by a factor of 25 in the activity 100,000 years after discharge is primarily explained by the quantities of U-233 (associated with U-234) and Pu-239 in waste. Accordingly, there are two factors of variations to take into account: (Equation1(1)
(1) ) Th/U or U/Pu fuel cycles and (2) reprocessing.
For the first point, as observed in , the decay of U-233 and U-234 leads to a much larger activity at 100,000 years after discharge, respectively, by a factor ∼15 and ∼4, when compared to the decay of Pu-239. This is because U-233 and U-234 decay products at 100,000 years after discharge are more radioactive than those from Pu-239. U-233 is mainly responsible for the long-term activity of Th/U fuel cycles while Pu-239 is mainly responsible for the long-term activity of U/Pu fuel cycles. Consequently, the thorium fuel cycles have the highest activities at 100,000 years after discharge. This is the case for fuel-cycle examples 6 and 10 that give 0.26 and 0.20 t(U+Pa)/GWe-yr, respectively, in the SNF component, but also for fuel-cycle examples 5, 11 and 18. The only outlier is for the fuel-cycle example 7, which has the third highest activity 100,000 years after discharge while being a once-through U/Pu fuel-cycle. This is because 2.5 t/GWe-yr of plutonium is sent into the SNF in the fuel-cycle example 7, which is ten times more compared to the fuel-cycle example 1 (and in addition it has a higher isotopic content in Pu-239 because of the fast spectrum system design).
Figure 12. Comparison of the main isotopic components of activity 100,000 years after discharge from decay daughters of U-233, U-234 and Pu-239.

The second point is that fuel cycles with continuous recycling usually achieve the lowest values of activity at 100,000 years after discharge when U-233 and Pu are being recovered and recycled so that only FP and processing loss amounts of actinides are being sent to waste. This is the case for fuel-cycle examples 20, 22, 24, 30, 32, 34 and 36 but not for the fuel-cycle examples 28 and 38 because of the relatively large quantity of U-233 being sent to the HLW through the reprocessing losses.
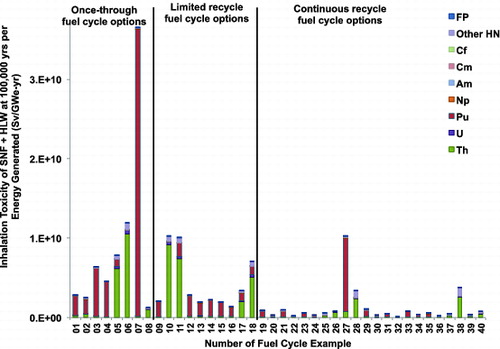
3.3.2. Variations in inhalation toxicity 100,000 years after discharge
The values of the inhalation toxicity 100,000 years after discharge are displayed in . There is a factor of about 370 between the maximum value of inhalation toxicity 100,000 years after discharge obtained for the fuel-cycle example 7 and the minimum value obtained for the fuel-cycle example 32. The main components for the inhalation toxicity 100,000 years after discharge are plutonium (57%) and thorium (36%). There is a surprisingly good correlation between the activity and inhalation toxicity 100,000 years after discharge observed by comparing with : the differences come from the absence of the FP component and the reduction of the HN and U components that are partly compensated by the Th component. This is explained by the relatively large value in the Th effective inhalation dose conversion factor (∼10−4 Sv/Bq) compared to uranium (∼10−6 Sv/Bq), to the heavy nuclei from their decay chain (∼10−8 Sv/Bq) and to the fission products (∼10−9 Sv/Bq). As a consequence, thorium fuel cycles that have U-233 in wastes have some of the largest values of the inhalation toxicity, because of the Th dose coefficient (Th-229 is one of the decay daughters of U-233). However, the largest values in the inhalation toxicity 100,000 years after discharge are dominated by uranium fuel cycles that send a large amount of Pu-239 into the waste such as fuel-cycle examples 7, 27 and 3.
Figure 13. Contributions to SNF+HLW inhalation toxicity at 100,000 years after discharge.
3.3.3. Variations in ingestion toxicity 100,000 years after discharge
The values of the ingestion toxicity 100,000 years after discharge are displayed in . There is a factor of 226 between the largest ingestion toxicity at 100,000 years after discharge for the fuel-cycle example 7 and the lowest for the fuel-cycle example 32. The ingestion toxicity 100,000 years after discharge is both very well correlated with the long-term inhalation toxicity and activity parameters. Pu and Th are very large components in the long-term ingestion toxicity (representing 41% and 25%, respectively), similarly to the inhalation toxicity. The other heavy nuclei that primarily come from the decay of U-233 are also a major component (representing 30%) of the long-term ingestion toxicity. As a consequence, fuel cycles that have large amounts of Pu and of U-233 in their SNF or HLW are responsible for the largest long-term ingestion toxicity.
Figure 14. Contributions to SNF+HLW ingestion toxicity at 100,000 years after discharge.
3.3.4. Variations in decay heat 100,000 years after discharge
The variations in the decay heat 100,000 years after discharge are very similar to the ones of the long-term activity and ingestion toxicity, as observed with the correlation analysis in . The main components of the long-term decay heat are the daughters of U-233 and the Pu-239. As a consequence, fuel cycles that have large amounts of Pu and of U-233 in their SNF or HLW are responsible for the largest long-term decay heat.
4. Sensitivity to the reprocessing/separation losses
As already mentioned, HLW consists of materials intentionally separated for disposal as waste and the losses (assumed to 1%) of desired product materials from the processing of fuel material (e.g., separations of used nuclear fuel and fuel manufacturing). If disregarded material such as fission products, Pu and MA are responsible for most of the activity, radiotoxicity and decay heat, it was also observed in Sections 3.2 and 3.3 that the reprocessing/separation losses also have a potentially large impact on the nuclear waste management results. The objective of the following sensitivity analysis is to further investigate the impact of reprocessing/separation losses on the nuclear waste management performance for a typical uranium-based continuous recycling fuel cycle.
In order to assess the impact of the separation efficiency on the nuclear waste management performance, a sensitivity study in which the separation efficiency value varied from 95% to 99.99% was performed using fuel-cycle example 32, which is a two-stage continuous recycle case. The first stage contains PWRs with enriched-uranium oxide fuel, representing the design and performance of typical PWRs utilizing commercially supplied LEU fuel with an average discharge burnup of 50.0 GWd/t. The used nuclear fuel of Stage 1 is reprocessed and the recovered TRU material is used as part of the feed fuel for Stage 2. The reprocessed uranium (RU) from the Stage 1 used fuel is utilized in Stage 2 as needed, and the extra RU is sent to waste disposal. The actinide losses during reprocessing and the FPs are also part of the waste. SFRs with TRU/RU fuel are used in Stage 2. The average burnup is 132 GWd/t and the TRU conversion ratio is ∼0.5. The recovered TRU and RU from the discharged fuel are recycled back into Stage 2, while the recovered TRU and RU from Stage 1 are used as makeup feed. The actinide losses during fuel separations and the FPs become part of the waste.
The calculated waste mass and activity of fuel-cycle example 32 for separation efficiencies from 95% to 99.99% are provided in and the activity and the inhalation toxicity profiles are plotted in and . For the separation efficiency of 99%, the electricity power sharing for Stage 1 and Stage 2 are 67.8% and 32.2%, respectively. This power sharing is adjusted with change in the separation efficiency in order to account for the change in the recovered TRU mass and the TRU mass balance between the stages, but the variation of the power sharing is small.
Table 2. Variations in mass and activity of HLW with separation efficiency for fuel-cycle example 32.
Figure 15. Activity of SNF+HLW for fuel-cycle example 32 with different separation efficiency values.
Figure 16. Inhalation toxicity of SNF+HLW for fuel-cycle example 32 with different separation efficiency values.
Since most of the actinides are continuously recycled in fuel-cycle example 32, the fission products are the dominant contributors to the nuclear waste mass. The minor variation in the FP mass in is due to the change in the electricity-sharing between Stages 1 and 2 as separation efficiency is changed. The actinide loss masses decrease as the separation efficiency increases and as a result, the nuclear waste (SNF+HLW) mass ranges between 1.153 t/GWe-yr and 2.012 t/GWe-yr (only HLW mass is in table).
The activity during the first few hundred years after discharge is comparable regardless of the separation efficiencies, as shown in , because the FP contribution is dominant while 100% of the FP is sent to waste disposal. However, noticeable differences in the activity are observed after a few hundred years because the TRU mass, which is the dominant contributor to the activity after most FPs have decayed out, varies as the separation efficiency is changed. For instance, the activity at 3,000 years after discharge is twice larger with a separation efficiency of 99% compared to 99.9%. The activity 100,000 years after discharge is mostly due to the long-life fission products, which does not depend on the separation efficiencies. As a consequence, for the activity only the intermediate time range between ∼200 and ∼50,000 years after discharge depends on the separation efficiency as observed in .
As displayed in and , the inhalation toxicity of fuel cycle 32 mostly depends on the plutonium and minor actinides present in the waste through the separation losses rather than on the fission products. This explains the behavior observed in where a factor 10 in the separation loss impacts in a similar way the inhalation toxicity throughout the decay time.
The ingestion toxicity and decay heat parameters are both impacted by the fission products and by the plutonium and minor actinides sent in the losses. As a consequence, the short-term ingestion toxicity and decay heat values are not significantly affected by the separation losses (similar to the activity), while the long-term values are affected (similar to the inhalation toxicity).
5. Conclusions
Variations in the values of mass, activity, toxicity and decay heat at 10, 100 and 100,000 years after reactor discharge of nuclear waste for 40 fuel-cycle examples were assessed to inform on the nuclear waste management performance. A correlation analysis was performed to enable identification of the parameters that follow similar trends and justified the focus in this paper on the activity and inhalation toxicity at 10 and 100,000 years after discharge. To be technology independent and to focus on physics differences, these parameters were normalized using a uniform thermal efficiency of 33% for the nuclear reactor systems in all fuel-cycle examples. This analysis underlined the benefits and drawbacks in the nuclear waste management metrics of different fuel-cycle options: the use of critical and/or subcritical reactors with fast and/or thermal neutron spectrum, and the type of recycling from once-through to continuous recycling.
Fuel cycles with long fuel residence time always display nuclear wastes with lower activity at 10 years after discharge, while ADSs are responsible for larger activity at 10 years because they generate additional power for operating the accelerator. Nuclear wastes generated from thorium fuel cycles display larger activity at 10 years than those from uranium fuel cycles because of the different fission yields of U-233 and Pu-239. Uranium fuel cycles are always responsible for the largest values of inhalation toxicity at 10 years because the heavy actinides such as Pu, Am and Cm have a predominant effect on this parameter. In fact, the largest values of inhalation toxicity at 10 years are obtained with uranium fuel cycles using thermal systems with continuous recycling of plutonium only, which leads to large amounts of americium and curium contained in the HLW. Thorium fuel cycles and uranium fuel cycles with continuous recycling of all the trans-uranium, both display low values of inhalation toxicity at 10 years.
The trends in long-term activity and inhalation toxicity metrics are primarily explained by the quantity of Pu-239 and U-233 contained in the wastes, which is directly linked to the type of fuel used and to the reprocessing scheme employed. In fact, thorium fuel cycles generally display the largest values of activity at 100,000 years after discharge since the decay of U-233 and U-234 leads to larger long-term activity, compared with the decay of Pu-239. As a consequence, both uranium and thorium fuel cycles display low activity and inhalation toxicity at 100,000 years when minimizing the amounts of Pu-239 and U-233 that are sent for disposal or contained in their reprocessing/separation losses.
These reprocessing/separation losses have a significant impact on the nuclear waste management metrics even though the primary components generally are the materials sent for disposal, such as fission products, Pu and MA. The sensitivity analysis performed on the separation efficiency showed that the nuclear waste management performance of a continuous recycling fuel cycle combining PWR and SFR technologies estimated with the activity at 10, 100 and 100,000 years after discharge are not much affected by the efficiency. Other parameters, such as the inhalation toxicity, the ingestion toxicity, the decay heat and the medium-term activity, are however very much impacted by the separation efficiency.
Acknowledgements
The authors acknowledge the fuel-cycle options’ analysis performed by teams led by Dr M. Todosow of Brookhaven National Laboratory, Dr R. Wigeland and Dr B. Dixon of Idaho National Laboratory, Dr W. Halsey of Lawrence Livermore National Laboratory, Dr J. Gehin of Oak Ridge National Laboratory, and B. P. Singh of Department of Energy.
The submitted manuscript has been created by UChicago Argonne, LLC, Operator of Argonne National Laboratory (“Argonne”). Argonne, a US Department of Energy Office of Science laboratory, is operated under Contract No. DE-AC02-06CH11357. The US Government retains for itself, and others acting on its behalf, a paid-up nonexclusive, irrevocable worldwide license in said article to reproduce, prepare derivative works, distribute copies to the public, and perform publicly and display publicly, by or on behalf of the Government. The direction and support of the US DOE Office of Nuclear Energy is greatly appreciated.
Disclosure statement
No potential conflict of interest was reported by the authors.
References
- Nuclear Energy Research and Development Roadmap. Report to Congress. USA: US Department of Energy; April 2010.
- Wigeland R, Taiwo TA, Ludewig H, Todosow M, Halsey W, Gehin J, Jubin R, Buelt J, Stockinger S, Jenni K, Oakley B. Nuclear fuel cycle evaluation and screening – final report. USA: US DOE Fuel Cycle Technologies; 8 October 2014 (FCRD-FCO-2014-000106).
- Nuclear Fuel Cycle Options Catalogue [Internet]. Available from: https://connect.sandia.gov/sites/NuclearFuel CycleOptionCatalog/SitePages/a/homepage.aspx
- ORIGEN2 V2.2: Isotope generation and depletion code - matrix exponential method. USA: Oak Ridge National Laboratory; June 2002 (CCC-371).
- Eckerman K, Harrison J, Menzel HG, Clement CH. Compendium of dose coefficients based on ICRP Publication 60. ICRP; 2012 (ICRP Publication 119. Ann. ICRP 41).
Appendix 1. Summary descriptions of the 40 fuel-cycle examples.