
 ?Mathematical formulae have been encoded as MathML and are displayed in this HTML version using MathJax in order to improve their display. Uncheck the box to turn MathJax off. This feature requires Javascript. Click on a formula to zoom.
Abstract
New benchmark models with respect to criticality data are established on the basis of seven uranium-fueled assemblies constructed in the ninth experimental series at the fast critical assembly (FCA) facility. By virtue of these FCA-IX assemblies, where the simple combinations of uranium fuel and diluent (graphite and stainless steel) in their core regions were systematically varied, the neutron spectra of these benchmark models cover those of various reactor types, from fast to sub-moderated reactors. The sample calculations of the benchmark models by a continuous-energy Monte Carlo (MC) code showed obvious differences between even the latest versions of two major nuclear data libraries, JENDL-4.0 and ENDF/B-VII.1. The present benchmark models would be well suited for the assessment and improvement of the nuclear data for 235U, 238U, graphite, and stainless steel. In addition, the verification of the deterministic method was performed on the benchmark models by comparison with the MC calculations. The present benchmark models are also available to users of deterministic calculation codes for the assessment and improvement of nuclear data.
1. Introduction
The fast critical assembly (FCA) facility of the Japan Atomic Energy Agency has played an important role in studies on the assessment and improvement of nuclear data and calculation methods in the reactor physics field. In the 1980s, seven uranium-fueled assemblies, the so-called FCA-IX assemblies, were constructed to evaluate and adjust the cross-section data for minor actinides at FCA, where criticalities, fission rate ratios, and small-sample reactivity worths for minor actinides were measured [Citation1]. Each assembly is identified by a number (1–7) after the “IX,” e.g., IX-1 for the first one. FCA-IX assemblies are simple, both in geometry and composition. In the first six assemblies, IX-1–IX-6, each core region was composed of a simple combination of high-enriched uranium (HEU) fuel plates and diluent plates of graphite or stainless steel. Their neutron spectra covered those of various reactor types, from fast to sub-moderated reactors, by varying the combinations of fuel and diluent plates. In addition, assembly IX-7 was constructed as a low-enriched uranium (LEU) assembly without diluent.
The main purpose of this paper is to provide new benchmark models of FCA-IX assemblies with respect to criticalities (keff) as one of the most basic reactor physics parameters. Even simple assemblies, such as those of FCA-IX, include too many geometric details in exact experimental configurations. For the user's convenience, because the benchmark models should be as simple as possible, simplifying the benchmark models without increasing the total uncertainty far beyond that of the original experiment is important. Therefore, we have established three-dimensional heterogeneous benchmark models by simplifying the geometric details, except for the plate-wise heterogeneity, to a practical level. In the future, we will open the heterogeneous benchmark models, which include detailed data of FCA's fuel plates. However, in this paper, we provide the three-dimensional homogeneous benchmark models where the plate-wise heterogeneity is homogenized, together with correction factors for the heterogeneous effect. Adopting the correction factors on the results of the homogeneous benchmark models, users of Monte Carlo (MC) codes can obtain equivalent results to those of heterogeneous benchmark models. Furthermore, the present benchmark models provide available correction factors to users of deterministic calculation codes.
The following section describes the measurement data and uncertainties of the experimental configurations of FCA-IX assemblies. Section 3 describes the establishment of benchmark models and provides the specifications of homogeneous benchmark models together with several correction factors. Section 4 describes the sample benchmark calculations performed by the continuous-energy MC code MVP [Citation2] with two major nuclear data libraries, JENDL-4.0 [Citation3] and ENDF/B-VII.1 [Citation4]. The verification of the deterministic calculation method performed by comparing with the MC results is also described. Finally, conclusions are presented in Section 5.
2. Experiments
2.1. General description of the FCA facility
FCA is a horizontal split-table type comprising two half-assemblies: one is constructed on a fixed table and the other is on a movable one [Citation5]. shows a schematic of the FCA facility. Square tubes of stainless steel are horizontally stacked on each table to form a 51-row and 51-column square matrix. Each square tube is 5.52 cm square (outside dimension) and 132.4 cm long. As shown in , the two half-assemblies are separated by 200 cm when the facility is not operating.
Figure 1. Schematic of the FCA facility.
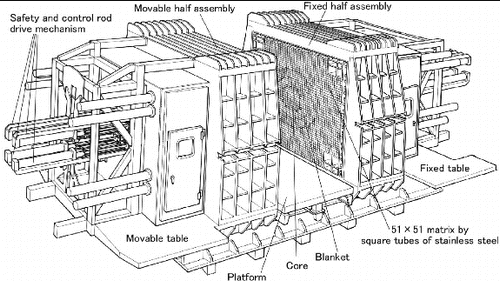
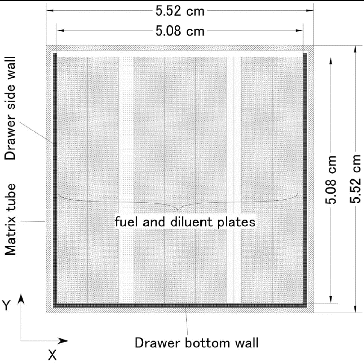
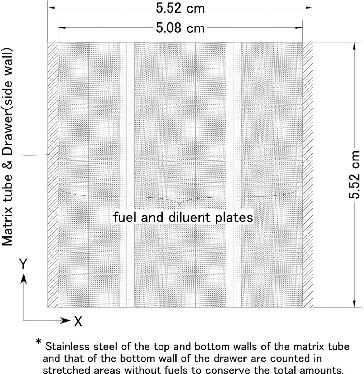
illustrates the construction of the experimental assemblies at the FCA facility. Each assembly is realized by loading drawers, where rectangular plates or blocks of different kinds of material, such as enriched uranium, depleted uranium, graphite, and stainless steel, are packed, into the square tube matrices. There are two types of drawers: one is an ordinary drawer and the other is a special one for the safety and control rods (SCRs) that are connected to the SCR drive mechanisms. The ordinary drawers are made of 0.0771 cm thick stainless steel. The 5.08 cm cubic material unit, which is composed of stacking the fuel and diluent plates, and the depleted uranium blocks (DUBs), can be packed into the ordinary drawers. illustrates the XY-cross-sectional view of the matrix tube loading an ordinary drawer, where fuel and diluent plates are packed. For startup operation, a neutron source (NS) has to be present in each half of the uranium-fueled assemblies because there is no inherent source. Hence, the uranium-fueled assemblies include drawers with a hole for NS insertion (NS-hole drawer), where plates or blocks with a 2.0 cm diameter hole are partially stacked to form an X-directed hole. Since the NS-hole drawers are loaded in a horizontal row, NS can be inserted into the core from the outside along the hole.
Figure 2. Construction of the experimental assemblies at the FCA facility.
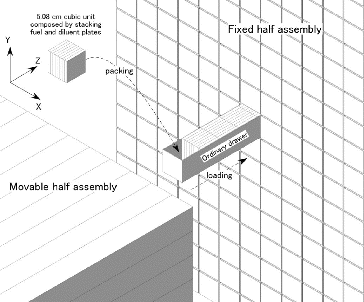
Figure 3. XY-cross-sectional view of matrix tube loading an ordinary drawer.
In FCA, fuel plates are used in the SCR drawers. The structure and contents of the SCR drawers are similar to the ordinary drawers, but they have some special features. The SCR drawer is composed of stainless steel with twice the side and bottom wall thickness (0.15 cm) of the ordinary drawer walls, because it has to be strong enough to undergo rapid acceleration and deceleration in scram operations. Hence, the units for SCRs have to be 1/16 inch (0.159 cm) thinner than those for the ordinary drawers along the X-direction owing to the thicker walls of the SCR drawers. All the safety rods are fully inserted when the facility is operating. Critical state is achieved by bringing the movable table to the fixed one and adjusting the insertion depth of the control rods.
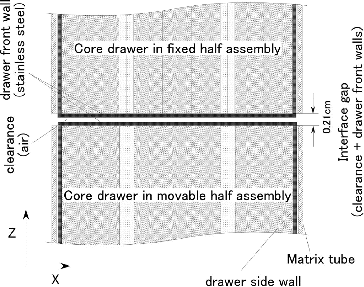
illustrates an XZ-cross-sectional view near the interface between the fixed and movable half-assemblies when operating. Owing to a mechanical clearance, there is a small air gap between the drawers loaded in the fixed half and those loaded in the movable one, even at the closest position of the movable table to the fixed one. As a result, the interface gap is 0.21 cm in total owing to the mechanical clearance gap and the drawer front walls, which are filled with the air and the stainless steel, respectively. The front wall (3 mm) of the SCR drawer is also thicker than that of the ordinary drawer. Therefore, the region boundaries along the Z-direction in the SCR drawers are slightly different from those in the ordinary drawers owing to the difference between their front wall thicknesses.
Figure 4. XZ-cross-sectional view near interface between fixed and movable half-assemblies when operating.
2.2. Specific description of FCA-IX assemblies
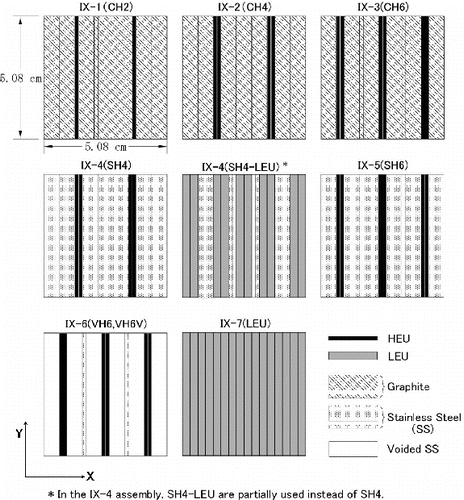
The core specifications of the experimental configurations are summarized in . shows the XY-cross-sectional views of the plate-stacking patterns of core units. Each pattern was symmetric with respect to the YZ mid-plane within the core unit. In assemblies IX-1–IX-6, HEU plates were used as fuel. Note that LEU plates were partially used instead of HEU plates in assembly IX-4. In assembly IX-7, only LEU plates were stacked in core units. Graphite plates were used as diluent in assemblies IX-1–IX-3 and stainless steel plates in assemblies IX-4–IX-6.
Table 1. Core specifications of the experimental configurations.
Figure 5. XY-cross-sectional views of plate-stacking patterns of core units.
In FCA assemblies, the total amount of fuel is divided into the fixed and movable half-assemblies owing to the feature of the horizontal split-table type. Therefore, in each core drawer of FCA-IX assemblies, the core units with the half of the core height given in were packed and the blanket units of the DUBs with 15.24 cm height were packed behind the core units. In each blanket drawer, the blanket units of DUBs were packed to the same height as the core drawer.
In each of the FCA-IX assemblies, the plate-stacking pattern in SCR units was designed to be similar to that in core units. However, SCR units have to be 1/16 inch (0.159 cm) thinner than the ordinary core units owing to the thicker walls of the SCR drawers, as mentioned in Section 2.1. Therefore, a 1/16 inch thick diluent plate was removed from the respective core unit to design each unit for SCRs in assemblies IX-1–IX-6. In the SCR unit of assembly IX-7, a 1/16 inch thick LEU plate was removed because there was no diluent.
In the NS-hole drawers of assembly IX-1, the unit with the NS-hole was located 22.86 cm from the drawer front wall along the Z-direction. As for the other assemblies, units with an NS hole were located in a suitable position depending on the assembly.
In each assembly, the core, blanket, SCR drawers, and NS-hole drawers were loaded into the matrix tubes in accordance with the drawer-loading map. The loading position in the matrix is identified by the initial letters of the half (Fixed or Movable), row number, and column number. The row numbers (101–151) start from the top. The column numbers (1–51) increase along the X-direction. For example, the central position in the fixed half is F126/26. and show the central portion of the drawer-loading maps at the fixed and movable halves of assembly IX-1 as an example.
Figure 6. Drawer-loading map at fixed half of assembly IX-1.
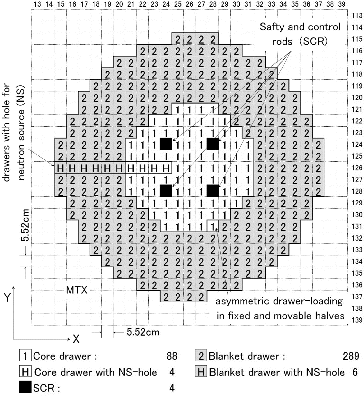
Figure 7. Drawer-loading map at movable half of assembly IX-1.
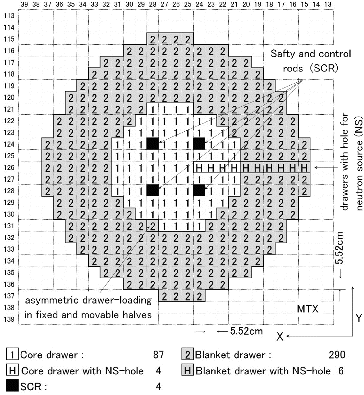
In the fixed half of assembly IX-1, there were 88 core and 289 blanket drawers, as shown in . NS-hole drawers were loaded into 10 matrix tubes from F126/15 to F126/24. The loading numbers of the core and blanket drawers with NS-holes were 4 and 6, respectively. In each assembly, four SCR drawers were loaded at F124/24, F128/24, F124/28, and F128/28. In the movable half of assembly IX-1, there were 87 core and 290 blanket drawers, as shown in . The core drawer at F131/28 and the blanket drawer at M131/28 were asymmetrically loaded in the experimental configuration, whereas other drawers were symmetric between both the halves, because the loading number of core drawers was adjusted to achieve criticality under the operational regulation of the FCA facility. Such asymmetric drawer-loadings occurred in the experimental configurations of assemblies IX-1–IX-4.
2.3. Criticalities of FCA-IX assemblies
In each of the FCA-IX assemblies, the excess reactivity of the experimental configuration was measured with the calibrated control rod. The excess reactivity is the system reactivity when all SCRs are fully inserted. The calibrations were performed using the rod compensation and positive period methods. The excess reactivity in units of dollars thus measured was converted into that in units of Δk/k by the effective delayed neutron fraction, which was re-evaluated with the delayed neutron data in the latest nuclear data library of JENDL-4.0. The uncertainties in the excess reactivity were conventionally evaluated by considering the mechanical reproducibility of the SCR positions, that of closeness between the two tables, the measurement errors of the doubling time, and the core temperature [Citation5]. In this study, we also considered the uncertainties due to the delayed neutron data of decay constants (λ), fractional group yields (a), and the total number of delayed neutrons per fission (νd). summarizes the excess reactivity and uncertainties due to the measurement techniques of FCA-IX assemblies. The uncertainties due to the measurement techniques are within 0.02% Δk/k, as shown in .
Table 2. Excess reactivity and uncertainties due to the measurement techniques (% Δk/k).
The uncertainties due to the compositions in keff values were also evaluated. The standard errors of the mean of the plate weights and uranium enrichments were considered as main composition uncertainties. The reactivity effects of these uncertainties were estimated by the MC calculations using MVP. A reference keff value was calculated with the nominal weights for all plates and blocks, and the nominal enrichments for all the uranium plates. To evaluate the uncertainty due to the weight of the enriched uranium plates, the perturbed keff′ value was calculated by changing the enriched uranium weight by its standard error of mean and fixing all other conditions. The uncertainty was estimated as (keff′ − keff)/keff using the reference keff value to the perturbed keff′ value. For the stainless steel plates and DUB blocks, uncertainties were estimated in the same manner.
FCA has two different lots of graphite plates. The standard error of the mean of the plate weights is expected to be small when graphite plates are selected from one of the lots. However, we should consider two extreme cases where each assembly was constructed by the respective lots because there is no information that either lot was selected in constructing assemblies IX-1–IX-3. Therefore, the nominal weight of the graphite plates was assumed to be the middle value of the averaged weights of the two lots by taking its error to be the difference between the nominal weight and one of the averaged weights. Note that the standard error of mean of each extreme case is negligibly small in comparison with the thus-defined error.
To evaluate the uncertainty due to the enrichment of uranium plates, the perturbed keff′ value was calculated by changing the enrichment by the standard error of mean and fixing all other conditions.
summarizes the uncertainties in keff value due to the compositions. The number of neutron histories was 200 million for each calculation. The statistical uncertainties of MC calculations were less than 0.01% Δk/k. In comparisons between and , the overall composition uncertainties dominate the measurement uncertainties. In assemblies IX-1–IX-3, the uncertainties are mainly caused by that in the weight of the graphite plates.
Table 3. Uncertainties in keff value due to the compositions (% Δk/k).
summarizes the experimental keff values. The total uncertainties were estimated as the square root summation of squares of the uncertainties due to the measurement techniques and compositions. The results show that the total uncertainties in the experimental keff values are within 0.24% Δk/k.
Table 4. Summary of the experimental keff values.
3. Benchmark models
As mentioned in the previous section, there were too many geometric details in the exact experimental configurations, even simple assemblies, such as those in FCA-IX. For the user's convenience, because the benchmark models should be as simple as possible, simplifying the benchmark models without increasing the total uncertainty far beyond that of the original experiment is important. Therefore, the three-dimensional heterogeneous benchmark models were established by simplifying the geometric details, except for the plate-wise heterogeneity, to a practical level. Section 3.1 provides the benchmark keff values for the heterogeneous models. In the future, we will open the heterogeneous benchmark models, which include detailed data of FCA's fuel plates. However, in this paper, we establish the three-dimensional homogeneous benchmark models where the plate-wise heterogeneity is homogenized, together with correction factors for the heterogeneous effect. Section 3.2 provides the specific configuration and composition data of the homogeneous benchmark models. Section 3.3 provides the correction factors for the heterogeneous effect, so that users of MC codes can obtain results comparable to the benchmark keff values from the homogeneous calculation results. Section 3.4 provides several correction factors for the deterministic scheme, so that users of deterministic calculation codes can obtain results comparable to the benchmark keff values using simpler homogeneous calculation results based on the diffusion method.
3.1. Benchmark keff values of the heterogeneous benchmark models
The heterogeneous models, which maintain the plate-wise heterogeneity, are based on the experimental configurations with the following simplifications:
• replacement of the SCR drawers with the ordinary core drawers,
• elimination of the clearance gap and the drawer front walls at the interface,
• elimination of the NS-holes,
• symmetrization of the drawer-loading between half-assemblies (only for assemblies IX-1–IX-4).
The heterogeneous models, which exclude the geometric details of SCR drawers, the interface gap, and NS-holes, are desirable so as to easily perform benchmark calculations. By taking advantage of the symmetrized drawer-loading, the half-assembly under the reflective condition at the mid-plane instead of the full assembly can be easily applied in the benchmark calculations. The relevant reactivity worths corresponding to these simplifications were measured in each of the FCA-IX assemblies. The descriptions of the measurement techniques for these reactivity worths at FCA were reported in [Citation5]. summarizes the measured reactivity worths.
Table 5. Reactivity worths for the simplifications (% Δk/k).
The reactivity worths for simplifications were verified by the MC code MVP with the latest libraries, i.e., JENDL-4.0 and ENDF/B-VII.1. For each of the FCA-IX assemblies, we constructed an as-built model, which includes the geometric details of the experimental configuration. Starting from this as-built model, simplified models were constructed stepwise by each simplification, such as SCR drawers, the interface, NS holes, and the asymmetric drawer-loading. Each reactivity worth was estimated using the keff values of the two models before and after the relevant simplification. The calculation results are summarized in . The number of neutron histories was 200 million for each calculation. The statistical uncertainties of the MC calculations were 0.01% Δk/k on the reactivity worth. Each calculation value is consistent with the measured value within two times of the experimental error. From these results, the validity of the measured results for simplifications was confirmed using the geometric detailed MC calculations.
summarizes the keff values of the heterogeneous benchmark models. The benchmark keff values were estimated by adopting the measured results of total reactivity worth on the experimental keff values. Note that the MC calculation for the reactivity worth to symmetrize the drawer-loading was adopted in assembly IX-4 because there was no measurement. The total uncertainties in the benchmark keff values are within 0.24% Δk/k. In Appendix 1, we prepared a correlation matrix between the benchmark keff values of assemblies IX-1–IX-7.
Table 6. Summary of keff values of the heterogeneous benchmark models.
3.2. Specifications of homogeneous benchmark models
For the homogeneous benchmark models, the composition data were provided by homogenizing the constituents of the packed plates, the drawer walls, the matrix tube, and the air gaps per cell. Here, the cell corresponds to product of the XY-cross-sectional area of 5.52X×5.52Y cm2 (outer boundary of the square matrix tube) and the unit length along the Z-direction. provides the homogenized atomic number densities of the core, blanket, and the empty matrix tube (MTX) cells of FCA-IX assemblies. Here, amount of uranium isotopes other than 235U was assumed to be that of 238U because there is only measurement data of the total uranium and 235U amounts for HEU and LEU plates.
Table 7. Homogenized atomic number densities of cells of FCA-IX assemblies (×1024 atoms/cm3).
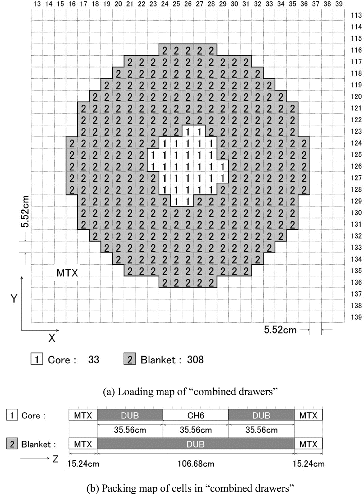
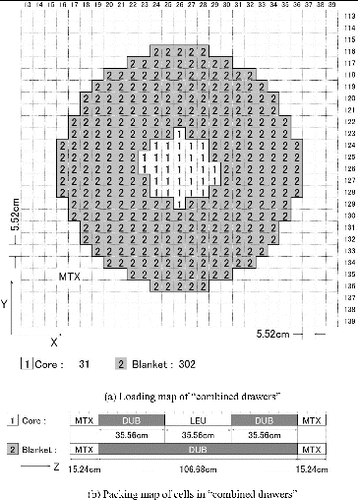
– describe the configurations of the homogeneous benchmark models. In these figures, mutually facing drawers in respective half-assemblies are given as “combined” drawers by virtue of the elimination of the clearance gap and the drawer front walls at the interface in the benchmark models. Using the combined drawers, the packing maps of the cells are described for the full assembly from the back end of the movable half to that of the fixed half along the Z-direction. Here, the maps are symmetric with respect to the mid-plane owing to the symmetrized drawer-loadings in the benchmark models. Simultaneously, the loading maps of the combined drawers are described in perspective seen towards the fixed half from the back end of the movable half.
Figure 8. Homogeneous benchmark model of assembly IX-1.
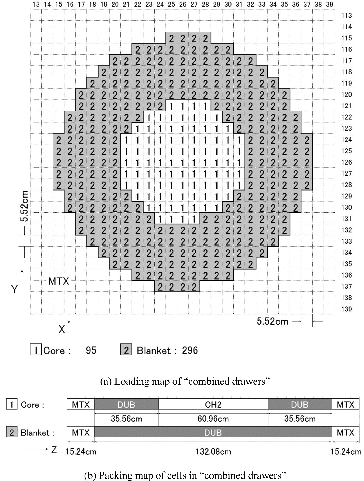
Figure 9. Homogeneous benchmark model of assembly IX-2.
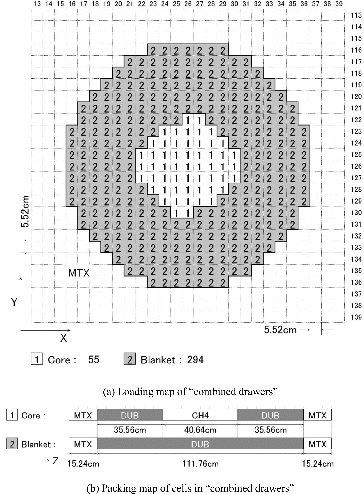
Figure 10. Homogeneous benchmark model of assembly IX-3.
In assembly IX-4, extra core drawers were partially loaded, as shown in . In the extra core drawers, the SH4-LEU cells, composed of LEU and stainless steel, were packed instead of the SH4 cells. In assembly IX-6, two types of core cells, VH6 and VH6V, were packed at the center and the edges of the core region, respectively, as shown in . Note that the number densities of the stainless steel materials in the VH6 and VH6V cells were slightly different, as shown in .
Figure 11. Homogeneous benchmark model of assembly IX-4.
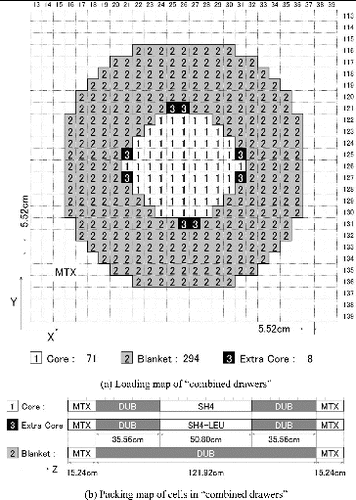
Figure 12. Homogeneous benchmark model of assembly IX-5.
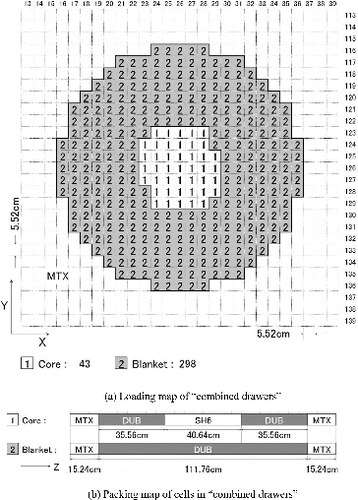
Figure 13. Homogeneous benchmark model of assembly IX-6.
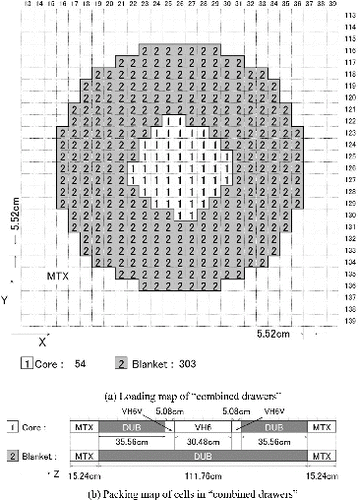
Figure 14. Homogeneous benchmark model of assembly IX-7.
Using these specific configuration and composition data, one can easily obtain the keff values of the homogeneous benchmark models by MC calculation codes or deterministic codes. The following sections provide correction factors from which users of MC calculation codes or deterministic codes can obtain results equivalent to those of the heterogeneous benchmark models.
3.3. Correction factor for Monte Carlo calculations
The heterogeneous effect should be considered to obtain results equivalent to those of the heterogeneous benchmark models. The correction factor for the heterogeneous effect was obtained as the ratio of the kheteroeff value for the heterogeneous benchmark model to the khomoeff value for the homogeneous one using MVP. In the heterogeneous benchmark model, the geometries of the plates, drawer walls, matrix tubes, and air gaps were modeled to maintain the plate-wise heterogeneity. The homogeneous benchmark model was equivalent to that provided in Section 3.2. The number of neutron histories was 200 million for each calculation. The MC statistical uncertainties were smaller than 0.0001 for all the correction factors. provides the correction factors for the heterogeneous effect for JENDL-4.0 and ENDF/B-VII.1.
Table 8. Correction factor for the heterogeneous effect.
The heterogeneous correction factors range from 1.0001 to 1.0123 for JENDL-4.0. In assembly IX-7, the correction is small because of its homogeneous plate-stacking. The discrepancies between the factors for JENDL-4.0 and ENDF-B/VII.1 are within 0.04%.
3.4. Correction factors for deterministic calculations
For users of deterministic calculation codes, we provided several correction factors, such as the ultra-fine (UF) energy group effect, anisotropic effect, mesh effect, heterogeneous cell effect, transport effect, SN- and PL-order effects, and effect of detailed-energy treatment on the core calculation. The deterministic calculation conditions and the definitions of the correction factors are summarized in and , respectively.
Table 9. Deterministic calculation conditions.
Table 10. Definitions of correction factors for deterministic calculations.
The base calculation was defined as a simple one that was based on the diffusion method as follows. The effective macroscopic cross sections were prepared to consider the resonance self-shielding effect in the homogeneous media with the Bondarenko type of the 70-energy group constant set called JAERI Fast Set. Cell calculations were performed using the SLAROM-UF code [Citation6]. Transport cross sections were conventionally defined as ΣCtr = ΣtC − ΣCs, with the current-weighted total cross sections (ΣCt) and the P1 component of the scattering cross sections (ΣCs). Isotropic diffusion coefficients were defined as D = 1/(3ΣCtr). Using the 70-energy group effective cross sections, core calculations were performed by the CITATION diffusion calculation code [Citation7]. Mesh intervals were conventionally set to 2.76 (=5.52/2) cm in the X- and Y-directions and 2.54 (=5.08/2) cm in the Z-direction. Hereafter, this condition of mesh intervals is called the 2-mesh condition.
The most accurate values by the deterministic calculation method can be obtained by adopting the correction factors. provides the correction factors for JENDL-4.0 and ENDF-B/VII.1.
Table 11. Correction factors for deterministic calculations.
3.4.1. Ultra-fine energy group effect
The effective cross sections were calculated in the UF energy group of about 100,000 below 50 keV by SLAROM-UF and were collapsed into 70 groups for core calculations. The correction factor for the effect of the UF calculation scheme was estimated as the ratio of the keff value by the UF calculation scheme to that by the base calculation. Here, the other conditions were fixed and the core calculations were commonly performed in the 70-energy group structure. The correction factors range from 0.9995 to 1.0009 for JENDL-4.0. The discrepancies between the factors for JENDL-4.0 and ENDF-B/VII.1 are within 0.03%; hence, they are not significant.
3.4.2. Anisotropic effect
In general, the diffusion coefficient of the vertical direction with respect to plates is different from that of the horizontal directions. The effect due to the anisotropic diffusion coefficients should be considered because of the use of the plate-type of fuel and diluent in all FCA assemblies. The anisotropic diffusion coefficients were defined as Benoist's formula [Citation8]. The correction factor for the anisotropic effect was estimated as the ratio of the keff value by the anisotropic diffusion coefficient to that by the isotropic one, while the other conditions were fixed. In both calculations, a plate-stretch model was adopted. illustrates the XY-cross-sectional view of the plate-stretch model. Here, the stainless steel of the top and bottom walls of the matrix tube and that of the bottom wall of the drawer were counted in stretched areas without fuel to conserve the total amounts. In all FCA-IX assemblies, the correction factors are negligibly small for both libraries.
Figure 15. XY-cross-sectional view of the plate-stretch model.
3.4.3. Mesh size effect
The correction factor for the mesh size effect was estimated as the ratio of the keff value under the infinite-mesh condition to that under the 2-mesh condition by the diffusion calculations. Here, the keff value under the infinite-mesh condition was evaluated by extrapolating with respect to the square of the mesh interval. In the extrapolation, we used the results of the 2-, 4-, and 6-mesh conditions. Here, the intervals of the 4- and 6-mesh conditions corresponded to half and one-third of the 2-mesh condition, respectively. The correction factors range from 0.9967 to 0.9984 for JENDL-4.0. The discrepancies between the factors for JENDL-4.0 and ENDF-B/VII.1 are within 0.01%; hence, they are not significant.
3.4.4. Heterogeneous cell effect
The heterogeneous cell effect was conventionally considered for the plate-wise heterogeneity on the basis of the deterministic method. The correction factor was estimated as the ratio of the keff value by the plate-stretch model to that by the homogeneous model. The correction factors range from 1.0000 to 1.0102 for JENDL-4.0. In assembly IX-7, the effect is negligibly small because of its homogeneous plate-stacking. The discrepancies between the factors for JENDL-4.0 and ENDF-B/VII.1 are within 0.04%; hence, they are not significant.
It is noted that there are some differences between the heterogeneous correction factors by the MC and deterministic methods given in and , respectively. In the MC method, the geometric details of the plates, drawer walls, matrix tubes, and air gaps were modeled for the heterogeneous calculations as mentioned in Section 3.3. In contrast, the geometric details were one dimensionally simplified into the plate stretch models used for the heterogeneous calculations in the deterministic method. From the point of view of accuracy on the heterogeneous effect, adoption of the correction factors by MC calculations given in is one of the useful options also for users of deterministic calculation codes.
3.4.5. Transport effect
The correction factor for the transport effect was estimated as the ratio of the keff value by the transport calculation to that by the diffusion one. Here, both the keff values were commonly calculated under the 6-mesh condition as the finest one. The diffusion calculation was performed with the isotropic diffusion coefficients defined as D = 1/(3ΣCtr). The transport calculation was performed under the P0-order diagonal transport approximation (P0 − Σtr) and the S8 order. The transport core calculation was performed using the DANTSYS SN neutron transport code [Citation9]. The correction factors range from 1.0085 to 1.0219 for JENDL-4.0. The discrepancies between the factors for JENDL-4.0 and ENDF-B/VII.1 are within 0.03%; hence, they are not significant.
3.4.6. SN- and PL-order effects
The correction factor for the higher SN-order effect was estimated as the ratio of the keff value under the S16 order to that under the S8 order. In all FCA-IX assemblies, the SN-order effects are negligibly small for both libraries. The correction factor for the higher PL-order effect was estimated as the ratio of the keff value under the P4-extended transport approximation to that under the P0 − Σtr one. The correction factors for PL-order effect range from 0.9978 to 0.9991 for JENDL-4.0. The discrepancies between the factors for JENDL-4.0 and ENDF-B/VII.1 are within 0.04%; hence, they are not significant.
3.4.7. 900-group effect
Since many stainless steel plates were used in the core cells for the two assemblies IX-4 and IX-5, the core calculations with a fine energy group structure would be required to treat resonances in detail for structural materials in the higher energy regions. The 900-energy group constant set provided in the SLAROM-UF code was employed. The correction factor for the energy group effect on core calculations was estimated as the ratio of keff values of the 900-energy group to the 70-energy group. In both calculations, the other conditions were fixed and the UF calculation scheme was commonly adopted. The correction factors range from 0.9912 to 1.0013 for JENDL-4.0. For assemblies IX-4 and IX-5 with large amounts of stainless steel, the energy group effects are significant and increase with the stainless steel content. The discrepancies between the factors for JENDL-4.0 and ENDF-B/VII.1 are within 0.03%; hence, they are not significant.
4. Sample calculations and discussion
4.1. Results by Monte Carlo calculations
Sample calculations were performed using MVP to discuss the usefulness of the present benchmark models for the assessment of the nuclear data. Two major libraries, JENDL-4.0 and ENDF-B/VII.1, were employed. The number of neutron histories was 200 million for each calculation. The statistical uncertainties of the MC calculations were less than 0.01%. The ratios of the MC calculations to the experimental results (C/E) are shown in and . Here, the correction factor for the heterogeneous effect was adopted for the MC calculation result. The results are discussed by dividing FCA-IX assemblies into the following three categories 4.1.1, 4.1.2, and 4.1.3. The sensitivity analyses are additionally described in the Appendix 2.
Figure 16. Ratio of the MC calculation result to the experimental result (C/E).
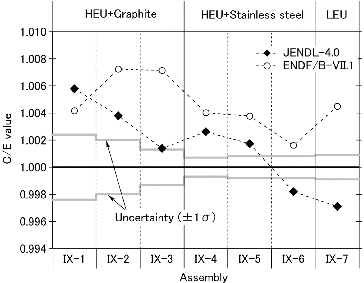
Table 12. Ratio of the MC calculation result to the experimental result.
4.1.1. Comparison among assemblies IX-1, IX-2, and IX-3
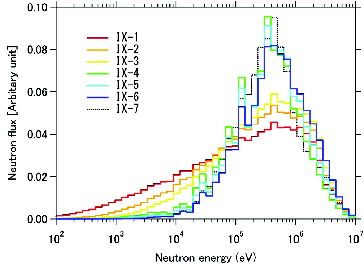
In assemblies IX-1–IX-3, HEU and graphite were the main components of the core regions. As shown in , the graphite content per core cell decreases from assembly IX-1 to assembly IX-3, whereas the 235U content increases. The ratios of the atomic number density of 12C to that of 235U range from 29.1 to 8.4. The neutron spectrum of the core region becomes harder as the graphite content decreases from assembly IX-1 to assembly IX-3, as shown in .
Figure 17. Neutron spectra at the core centers of FCA-IX assemblies.
For assembly IX-1, the calculation value by JENDL-4.0 overestimates the experimental value by 0.58%, as shown in . As the neutron spectrum becomes harder, the C/E value by JENDL-4.0 decreases from 1.0058 to 1.0014. The calculation value for assembly IX-3 agrees with the experimental value. In contrast, the calculation values by ENDF-B/VII.1 overestimate by 0.42%, 0.72%, and 0.71% for assemblies IX-1, IX-2, and IX-3, respectively. The assembly dependences of the C/E values are quite different between JENDL-4.0 and ENDF-B/VII.1. The difference between the C/E values of these two libraries obviously increases from −0.16% in assembly IX-1 to 0.57% in assembly IX-3 as the spectrum becomes harder. Assemblies IX-1–IX-3 would be effective in the systematic assessment of 235U and 12C cross sections at the softer neutron spectra.
4.1.2. Comparison among assemblies IX-4, IX-5, and IX-6
In assemblies IX-4 and IX-5, HEU and stainless steel were the main components of the core regions. Their spectra are harder than those in assemblies IX-1–IX-3 with graphite. As shown in , the calculation values by JENDL-4.0 overestimate the experimental value by 0.26% and 0.17% in assemblies IX-4 and IX-5, respectively. The calculation values by ENDF-B/VII.1 also overestimate the experimental value by 0.40% and 0.38% in assemblies IX-4 and IX-5, respectively. The overestimations by ENDF-B/VII.1 are larger than those by JENDL-4.0. Assemblies IX-4 and IX-5, together with the previous three assemblies, would be effective in the systematic assessment of 235U cross sections in a wide range of neutron energy.
In assembly IX-6, voided stainless steel plates were used instead of the stainless steel plates in the core region. As shown in , the stainless steel content of assembly IX-6 is smaller than that of assembly IX-5 by a factor of approximately 0.36, whereas their fuel contents are the same. From these composition features, the change in the C/E value of keff from assembly IX-6 to assembly IX-5 can be roughly regarded as the C/E value of the stainless steel reactivity worth. As shown in , the C/E value by JENDL-4.0 increases from 0.9982 in assembly IX-6 to 1.0017 in assembly IX-5, which means 0.35% Δk/k overestimation of the stainless steel reactivity worth. On the other hand, the C/E value by ENDF-B/VII.1 increases from 1.0016 in assembly IX-6 to 1.0038 in assembly IX-5. The stainless steel reactivity worth by ENDF-B/VII.1 also overestimates by 0.22% Δk/k. The stainless steel reactivity worth by ENDF/B-VII.1 is better than JENDL-4.0 by 0.13% Δk/k, although both still overestimate. The comparison between assemblies IX-5 and IX-6 would mainly be useful in the assessment of cross sections of stainless steel materials.
4.1.3. Comparison between assemblies IX-6 and IX-7
In assembly IX-7, LEU was the only component of the core region. One finds a significant difference of 0.74% between the C/E values using the two libraries for assembly IX-7. As shown in , the 238U content of assembly IX-7 is larger than that of assembly IX-6 by a factor of approximately 62. In contrast, the contents of 235U and stainless steel of assembly IX-7 are almost the same as those of assembly IX-6. From these composition features, the change in the C/E value of keff from assembly IX-6 to assembly IX-7 can be roughly regarded as the C/E value of the 238U reactivity worth. As shown in , the C/E value by JENDL-4.0 decreases from 0.9982 in assembly IX-6 to 0.9971 in assembly IX-7, which means a slight underestimation of the 238U reactivity worth. In contrast, the C/E value by ENDF/B-VII.1 increases from 1.0016 in assembly IX-6 to 1.0045 in assembly IX-7. The 238U reactivity worth by ENDF-B/VII.1 overestimates by 0.29% Δk/k. There is an obvious difference between the C/E values of 238U reactivity worth by JENDL-4.0 and ENDF/B-VII.1. The comparison between assemblies IX-6 and IX-7 would be useful in the assessment of 238U cross sections.
4.2. Results by deterministic calculations
For users of deterministic codes, it is worth noting that the assessment and improvement of nuclear data can be achieved by simpler and more efficient calculations on the basis of the diffusion method. Therefore, the verification of the deterministic calculation method was also performed through comparison with the MC calculation results. Here, JENDL-4.0 and ENDF/B-VII.1 were employed. The most accurate deterministic result (Cdet) was estimated as Cdet = ftotal×Cbase by multiplying the base calculation result (Cbase) by the total correction factor (ftotal) given in . The base calculation corresponds to Method-0 in . compares the most accurate deterministic result and the MC calculation result. Here, the correction factor for the heterogeneous effect was adopted for the MC calculation result (CMC). The ratio of Cdet/CMC by JENDL-4.0 decreases as the neutron spectrum becomes softer. One finds that the most accurate deterministic results underestimate the MC calculations by approximately 0.6% for the assemblies with the softer neutron spectra. The degrees of underestimations are almost equal to the accuracy of the nuclear data. The results by ENDF-B/VII.1 show a similar tendency to those by JENDL-4.0.
Table 13. Comparison between the most accurate deterministic result and the MC calculation result.
As mentioned in Section 3.4 for the deterministic calculation method, the current-weighted total cross sections were conventionally adopted in the definition of transport cross sections. However, there is another option for the definition of transport cross sections as discussed in [Citation10]. Since the current is inversely proportional to the square of the resonance peak, the total cross section condensed by current weighting is extremely small in the resonance region, especially in the blanket region where a large amount of 238U was loaded. Therefore, flux weighting instead of current weighting was reconsidered for the transport cross section in the blanket region to overcome the above-mentioned underestimations. Here, the weighting factor (fweight) was introduced as the ratio of the kflux-weighedeff value by the flux-weighted transport cross section to the kcurrent-weighedeff value by the current-weighted transport cross section. The revised deterministic result (Crev) was estimated as Crev = fweight × Cdet. compares the revised deterministic result and the MC calculation result. For all assemblies, the kflux − weighedeff values are larger than the kcurrent − weighedeff values. The weighting factor by JENDL-4.0 increases from 1.0015 in assembly IX-7 to 1.0060 in assembly IX-1 as the spectrum becomes softer. The revised deterministic results by the weighting factors are confirmed to be consistent with the MC calculations within 0.2%, as shown in . The results by ENDF-B/VII.1 show a similar tendency to those by JENDL-4.0. From these results, the adoption of the weighting factor given in is recommended to obtain values consistent with the MC calculation.
Table 14. Comparison between revised deterministic result and the MC calculation result.
5. Conclusions
New benchmark models for criticalities of FCA-IX assemblies with systematically changed neutron spectra were established. This paper provides the specifications of homogeneous benchmark models, which were established by simplifying the geometric details and homogenizing the plate-wise heterogeneity, with several correction factors.
The sample calculations of the benchmark models were performed using the continuous-energy MC code with the two major nuclear data libraries, JENDL-4.0 and ENDF-B/VII.1. It was found that the assembly dependences of the C/E values were obviously different between JENDL-4.0 and ENDF-B/VII.1. The present benchmark models would be well suited for the assessment and improvement of the nuclear data for 235U, 238U, graphite, and stainless steel because of their advantages of simplicity and systematically changed neutron spectra. The verification of the deterministic method was further performed on the benchmark models by comparison with the MC calculations. The present simplified benchmark models are also available to users of deterministic calculation codes for the assessment and improvement of nuclear data.
Acknowledgements
The authors express thanks to Mr. M. Ishikawa for valuable information and helpful discussion about the weighting functions of transport cross sections. The authors also wish to thank Mr. T. Sakino for performing the calculations and to express their gratitude to the FCA staff for maintaining the facilities.
Disclosure statement
No potential conflict of interest was reported by the authors.
References
- Mukaiyama T, Ohbu M, Nakano M, et al. Actinide integral measurements in FCA assemblies. Radiation Effects. 1986;93:147–152.
- Nagaya Y, Okumura K, Mori T, Nakagawa M. MVP/GMVP II: general purpose Monte Carlo codes for neutron and photon transport calculations based on continuous energy and multigroup methods. Tokai mura (Japan): Japan Atomic Energy Research Institute; 2005. (JAERI 1348).
- Shibata K, Iwamoto O, Nakagawa T, et al. JENDL-4.0: a new library for nuclear science and engineering. J Nucl Sci Technol. 2011;48:1–30.
- Chadwick MB, Herman M, Obložinský P, et al. ENDF/B-VII.1 nuclear data for science and technology: cross sections, covariances, fission product yields and decay data. Nucl Data Sheets. 2011;112:2887–2996.
- Hirota J, Nomoto S, Hirakawa N, Nakano M. Studies of the criticality of 20% enriched uranium fast critical assemblies (FCA-I). J Nucl Sci Technol. 1969;6:35–42.
- Hazama T, Chiba G, Sugino K. Development of a fine and ultra-fine group cell calculation code SLAROM-UF for fast reactor analysis. J Nucl Sci Technol. 2006;43:908–918.
- Fowler TB, Vondy DR, Cunningham GW. Nuclear reactor core analyses code: CITATION. Oak Ridge (TN): Oak Ridge National Lab.; 1971. (ORNL-TM-2496 Rev.2).
- Benoist P. Streaming effects and collision probabilities in lattices. Nucl Sci Eng. 1968;34:285–307.
- Alcouffe RE, Baker RS, Brinkley FW, et al. DANTSYS: a diffusion accelerated neutral particle transport code system. Los Alamos (NM): Los Alamos National Lab.; 1995. (LA-12969-M).
- Keifhaber E. Comments on the calculation of reaction rate traverses. Karlsruhe (Germany): Kernforschungszentrum. Karlsruhe; 1970. (KEK 1314).
- Kugo T, Andoh M, Kojima K, et al. Prediction accuracy improvement of neutronic characteristics of a breeding light water reactor core by extended bias factor methods with use of FCA-XXII-1 critical experiments. J Nucl Sci Technol. 2008;45:288–303.
- Hara A, Takeda T, Kikuchi Y. SAGEP: two-dimensional sensitivity analysis code based on generalized perturbation theory [in Japanese]. Tokai mura (Japan): Japan Atomic Energy Research Institute; 1984. (JAERI-M 84-027).
Appendix 1.
We prepared a correlation matrix between the benchmark keff values of assemblies IX-1–IX-7 in . The matrix was evaluated by adopting the method mentioned in [Citation11]. All uncertainties were classified to either uncorrelated or correlated components between these assembles. The correlation factor was zero or unity according to whether they were uncorrelated or correlated.
Table A1. Correlation matrix between the benchmark keff values.
The statistical uncertainties were identified as uncorrelated components: uncertainties due to the mechanical reproducibility of the SCR positions, that of closeness between the two tables, the measurement errors of the doubling time, the core temperature, and reactivity worths for the simplifications. The uncertainties due to the delayed neutron data were identified as correlated components because the same date for delayed neutron was adopted in all the assemblies. The uncertainties due to the compositions were considered as follows. For instance, the HEU plates were commonly used in assemblies IX-1–IX-6. The uncertainties due to the weights and uranium enrichments of HEU plates were assumed to be correlated between assemblies IX-1–IX-6 except assembly IX-7. For the other plates and blocks, the correlation factors were determined in the same manner.
Appendix 2.
Sensitivity analyses were performed to investigate the differences between JENDL-4.0 and ENDF/B-VII.1. The sensitivity coefficients are defined as
Here, m, x, g, and L denote the nuclide, reaction type, energy group, and library, respectively. Sensitivity coefficients were obtained by the 70-group diffusion calculation using the SAGEP generalized perturbation code [Citation12]. Here, the group constant set based on JENDL-4.0 was employed to prepare the effective cross sections by SLAROM-UF. (a) and (b) show the energy-wise sensitivity coefficients of the keff values to the 235U capture and the 235U fission cross sections (σU235, cap and σU235, fis, hereafter), respectively. These sensitivity coefficients shift to the high-energy region as the neutron spectrum becomes harder from assembly IX-1 to assembly IX-6. Using the sensitivity coefficients and the changes of cross sections by replacing from JENDL-4.0 to ENDF/B-VII.1, the changes in the keff values were evaluated as follows:
(a) and (b) show the energy-wise changes in the keff values caused by the changes of σU235, cap and σU235, fis, respectively. summarizes the nuclide-reaction-wise changes in the keff values, which were summed over all energy groups.
Figure B1. Energy-wise sensitivity coefficients of keff values.
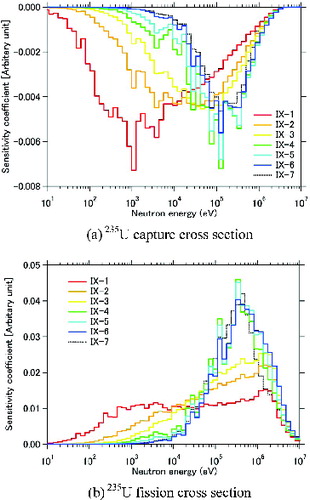
Figure B2. Energy-wise changes in keff values by replacing from JENDL-4.0 to ENDF/B-VII.1.
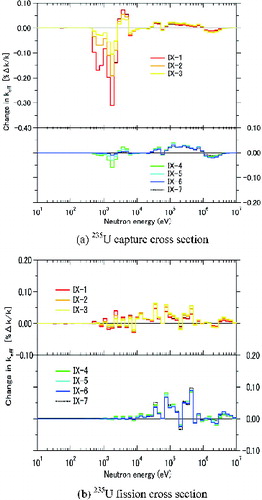
Table B1. Nuclide-reaction-wise changes in keff values by replacing from JENDL-4.0 to ENDF/B-VII.1.
B.1. Comparison among assemblies IX-1, IX-2, and IX-3
In assembly IX-1, the changes of σU235, cap and σU235, fis by replacing from JENDL-4.0 to ENDF/B-VII.1 mainly cause the keff changes of −0.94% Δk/k and 0.32% Δk/k, respectively, as shown in (a). The total keff change is −0.17% Δk/k due to a large cancelation of the keff changes caused by σU235, cap, σU235, fis, and other cross sections, such as the 12C elastic and the μ-average, i.e., the average cosine of the 12C scattering angle. (a) shows that the negative change in keff caused by σU235, cap of several keV obviously decreases as the neutron spectrum becomes harder from assembly IX-1 to assembly IX-3. In assembly IX-3, the keff change caused by σU235, cap is −0.11% Δk/k, as shown in (a). In contrast, (b) shows that the positive changes in keff caused by σU235, fis in the energy region from 10 keV to 1 MeV are almost constant in assemblies IX-1–IX-3. In assembly IX-3, the keff change caused by σU235, fis is 0.45% Δk/k, as shown in (a). From the results for assemblies IX-1–IX-3, the larger σU235, fis of ENDF/B-VII.1 compared with that of JENDL-4.0 in the energy region from 10 keV to 1 MeV is one of the factors that causes the overestimations in keff values by ENDF/B-VII.1. Simultaneously, the smaller σU235, cap of JENDL-4.0 compared with that of ENDF/B-VII.1 of several keV is one of the factors that causes the assembly dependence of C/E values by JENDL-4.0.
B.2. Comparison among assemblies IX-4, IX-5, and IX-6
In assemblies IX-4–IX-6, the changes of σU235, fis by replacing from JENDL-4.0 to ENDF/B-VII.1 mainly cause the keff changes from 0.45% Δk/k to 0.48% Δk/k, as shown in (b), and their keff changes are almost constant in the energy region from 10 keV to 1 MeV, as shown in (b). Therefore, the larger σU235, fis of ENDF/B-VII.1 compared with that of JENDL-4.0 in the energy region from 10 keV to 1 MeV is one of the factors that causes the overestimations in keff values by ENDF/B-VII.1 also in assemblies IX-4–IX-6.
As mentioned in Section 4.1, the C/E change of the keff values from assembly IX-6 to assembly IX-5 can be roughly regarded as the C/E value of the stainless steel reactivity worth. shows that the C/E values of keff by JENDL-4.0 are 0.9982 and 1.0017 for assembly IX-6 and assembly IX-5, respectively. From these results by JENDL-4.0, the C/E change from assembly IX-6 to assembly IX-5 is 0.35%. On the other hand, the C/E change by ENDF/B-VII.1 is 0.22% because the C/E values of keff are 1.0016 and 1.0038 for assembly IX-6 and assembly IX-5, respectively. These results mean that the stainless steel reactivity worth by ENDF/B-VII.1 provides a better result than that by JENDL-4.0 by 0.13% Δk/k. On the other hand, (b) shows that the keff change caused by the μ-average of 52Cr by replacing from JENDL-4.0 to ENDF/B-VII.1 becomes more negative from −0.08% Δk/k in assembly IX-6 to −0.17% Δk/k in assembly IX-5. It is one of the contributions that causes the difference between the C/E values of stainless steel reactivity worths by JENDL-4.0 and ENDF/B-VII.1.
B.3. Comparison between assemblies IX-6 and IX-7
In assemblies IX-6 and IX-7, the positive changes in keff caused by σU235, fis are almost the same, as shown in (b). In contrast, the keff changes caused by the 238U cross sections are quite different. As mentioned in Section 4.1, the C/E change of the keff values from assembly IX-6 to assembly IX-7 can be roughly regarded as the C/E value of the 238U reactivity worth. shows that the C/E values of keff by JENDL-4.0 are 0.9982 and 0.9971 for assembly IX-6 and assembly IX-7, respectively. From these results by JENDL-4.0, the C/E change from assembly IX-6 to assembly IX-7 is −0.11%. On the other hand, the C/E change by ENDF/B-VII.1 is 0.29% because the C/E values of keff are 1.0016 and 1.0045 for assembly IX-6 and assembly IX-7, respectively. These results imply that the 238U reactivity worths are different by 0.40% Δk/k between the libraries. On the other hand, (b) shows that the keff change caused by the 238U inelastic cross section by replacing from JENDL-4.0 to ENDF/B-VII.1 obviously increases, from −0.12% Δk/k in assembly IX-6 to 0.12% Δk/k in assembly IX-7, by 0.24% Δk/k. It mainly contributes to the difference between the C/E values of 238U reactivity worths by JENDL-4.0 and ENDF/B-VII.1.