
 ?Mathematical formulae have been encoded as MathML and are displayed in this HTML version using MathJax in order to improve their display. Uncheck the box to turn MathJax off. This feature requires Javascript. Click on a formula to zoom.
Abstract
The effect of low-temperature pre-deformation on the microstructural evolution of a Zr–Sn–Nb–Fe–Cu–O alloy was investigated by optical metallography, scanning electron microscope, transmission electron microscope, and electron backscattering diffraction (EBSD). It is found that a reasonably homogeneous and fine equiaxed grain structure with uniformly distributed second-phase particles (SPPs) can be obtained in 40% pre-deformed samples (Group A) but not in directly hot-rolled ones (Group B) after hot rolling. The initial SPPs diameter in Group A is also reduced. Noticeable differences in microstructural evolutions including the distribution and size of SPPs, grain size of matrix, and texture are observed between both groups. Reasons for such discrepancies are attributed to the defects (such as dislocations and interfaces) introduced during the pre-deformation and more preferred precipitation sites formed in Group A. The aging after the pre-deformation results in new slip systems activated during hot rolling, leading to more thorough refinement of grains. In addition, the growth of SPPs is interpreted by the Lifshitz–Slyozov–Wagner model.
1. Introduction
Zirconium alloys are typically used in nuclear pressurized water reactors (PWR) as fuel cladding tubes due to their excellent corrosion resistance and their sufficient mechanical strength at operating temperature (553–573 K) [Citation1–4 ]. The corrosion resistance of zirconium alloys is one of the most important factors limiting the burn-off rate in PWRs. Apart from the chemical composition of alloys, microstructural features including grain size [Citation5], crystallographic texture [Citation6,Citation7], and distribution and size of second-phase particles (SPPs) [Citation2] also play significant roles on corrosion resistance. For instance, Zhang et al. [Citation5] constructed a computation model of corrosion rate versus grain size of nanocrystalline zirconium, where the corrosion resistance of zirconium can be improved by grain refinement. Ly et al. [Citation8] found that recrystallized Zircaloy-4 samples with smaller grain size have better corrosion resistance. Li et al. [Citation9] found that SPPs can provide an extra stress field in oxide film and uniformly distributed SPPs can largely maintain the existence of t-ZrO2. Parallelly, Hatano et al. [Citation10] suggested that, as the oxide layer is thickened, the coarser grained SPPs presented at the oxide–metal interface oxidize more slowly than the surrounding Zr matrix. These partially oxidized metallic particles could then act as a hydrogen ion migration pathway (bridge) through oxide layer [Citation10]. Thus, refined grains and uniformly distributed fine SPPs in microstructure are beneficial for better corrosion resistance of zirconium alloys.
It is commonly accepted that properly modifying thermomechanical fabrications can effectively optimize the microstructure of zirconium alloys, such as refining grains and controlling the size of SPPs [Citation1–4]. As shown in literature, some processing technologies, such as accumulative roll bonding (ARB) [Citation11], high-pressure torsion (HPT) [Citation12], cryorolling [Citation13], equal channel angular pressing (ECAP) [Citation14], and friction stir processing (FSP) [Citation15], can result in ultrafine grains (even nanograins) due to a large deformation degree. Nevertheless, these technologies are hard to achieve commercial-scale production. In addition, Steinberg et al. [Citation16] introduced cumulative annealing parameter A, which normalized the annealing temperature and time for zirconium alloys after β-quenching. In general, for a certain zirconium alloy, the higher the value of A is, the larger the size of SPPs is [Citation17]. Therefore, the size of SPPs could be controlled by optimizing the value of A during the conventional fabrication of fuel cladding tubes. To manipulate the precipitation behavior of SPPs, a pre-deformation between solution treatment and subsequent α region annealing has frequently been adopted for a great number of other alloys, such as Cu [Citation18], Al [Citation19], and stainless steels [Citation20]. Defects such as dislocations and interfaces present during pre-deformation could offer more preferred precipitation sites and thus promote uniform distribution of the SPPs. It was reported [Citation21] that 20% compressive pre-deformation at room temperature after β-quenching could considerably both accelerate recrystallization and reduce the average recrystallized grain sizes for zirconium alloys.
In general, zirconium alloy fuel cladding tubes are fabricated by cold working followed by a subsequent heat treatment to obtain dimensional accuracy and good mechanical properties [Citation22,Citation23]. The microstructural features, such as grain size, crystallographic texture, and distribution and size of SPPs, are altered during conventional fabrication [Citation1–3]. In order to optimize the conventional manufacturing route, pre-deformation is utilized in this work to investigate whether these effects can be retained by a subsequent heat treatment and deformation. During this process, the precipitation behavior of alloys would be affected via pre-deformation which might exert a great influence on the growth kinetics of SPPs. Moreover, multiple deformations during cladding tube fabrication also play an important role in microstructure controlling. It is also needed to explore whether grains can be refined further via adding pre-deformation to conventional manufacturing route.
So far, very few studies have been carried out on the influence of pre-deformation on microstructural evolution of zirconium alloys during a conventional fabricating route. This work compares the microstructural characteristics of zirconium alloy prepared through both low-temperature pre-deformation (LTP) and direct hot rolling. Optical metallography (OM), scanning electron microscope (SEM), transmission electron microscope (TEM), electron backscattering diffraction (EBSD), microhardness tests, and some statistical work were jointly carried out to study the microstructural evolution associated with the fabricating routes.
2. Materials and methods
Zr–Sn–Nb–Fe–Cu–O alloy was manufactured by vacuum arc re-melting for three times to obtain chemical homogeneity of alloying. The chemical composition was well controlled within (balance = Zr): Sn (0.6–0.7), Nb (0.3–0.4), Fe (0.25–0.35), Cu (0.045–0.055), O (0.07–0.09), all in weight percentage (wt%). The ingot was forged at ∼1273 K, and then treated with β-solution at ∼1323 K for 30 min before being quenched in water. Some samples were pre-deformed at ∼743 K with the reduction rate of 40% in thickness via rolling, followed by aging at ∼743 K for 3 h. Afterwards, all samples were hot rolled to the same thickness at ∼873 K, resulting in thickness reduction of ∼58% for the pre-deformed samples and of ∼75% for the directly hot-rolled samples. Hot rolling was carried out via several passes to achieve the designed thickness of samples. Each pass achieves about 20% reduction in thickness. The pre-deformed samples are indicated as Group A, and the directly hot-rolled ones as Group B, hereafter. Subsequently, both groups were annealed at ∼843 K and cold rolled with a reduction rate of 40% in thickness for three cycles. Finally, annealing at ∼773 K for 5 h was employed for both groups. illustrates in detail the sequences of the machining works and heat treatments. Since both Group A and Group B include many processing steps, some denotations were further clearly specified, for example, using Group A-2nd CR to indicate the samples after the second cold rolling and Group B-HR to indicate the Group B samples after hot rolling step, and so on. The abbreviations for processing steps were also shown in .
Figure 1. Fabrication process flow of experimental alloy.
The microstructural characterization of both groups was performed by an Axio Imager A1m optical microscope, a FEI QUANTA 250 field emission gun scanning electron microscope, and a JEOL-2100F transmission electron microscope. The obtained samples were examined by mounting them in epoxy resin and polishing them according to standard metallographic techniques. Then, the samples were etched in a mixed solution (HF:HNO3:H2O = 2:9:9). All examined planes were of rolling direction (RD)–transverse direction (TD) type. SEM images with a magnification of 50,000× were believed appropriate for analyzing the SPPs [Citation17]. Software of Image-Pro Plus 5.0 was used to acquire the statistical information of SPPs’ size. To guarantee the reliability of the statistical results, at least 600–1000 particles from each sample were counted [Citation17]. Samples for EBSD measurement were etched in the solution (HF:HNO3:H2O = 2:9:9), followed by colloidal silica polishing. EBSD measurements were carried out in an AZtec HKL Max system with a NOVA NanoSEM 230 scanning electron microscope. The EBSD patterns were analyzed by the channel 5 software. The grain boundary angle condition used to define a grain is fixed at 10°. Samples for the TEM observation were prepared using a twin-jet polishing with a mixed solution (C2H5OH:HClO4 = 9:1) after mechanical thinning the samples to about 70 μm at a voltage of 20 V and a temperature of 243 K.
Vickers microhardness tests on polished samples were performed using a CK-AH 402SCV microhardness tester. Ten different microhardness measurements were conducted on each sample by using a loading–unloading test mode at a test force of 1960 mN for 15 s at each location.
3. Results
3.1. Microstructure after low-temperature pre-deformation
shows the microstructure of as-quenched samples. As shown in a), prior β-grain boundaries and lamellar structure are clearly observed, which are produced during fast cooling from β-phase region [Citation24]. The size of prior β-grains is in nearly hundreds of microns. A magnified SEM image is shown in b). Lamellar fingers have considerably clean interiors and SPPs are invisible, indicating an oversaturation of alloying elements. The β-quenched texture is much more random in crystallographic orientations which can be found elsewhere [Citation25].
Figure 2. (a) Optical image of as-quenched sample and (b) SEM image of as-quenched sample with higher magnification.
exhibits the typical microstructure of Group A-LTP sample. The pre-deformation step tends to provide new preferred precipitation sites due to introduced defects such as dislocations or interfaces, which is in good agreement with the results in [Citation21]. As shown in a), the microstructure consists of the classical Widmanstätten structure with lamellar fingers. The SPPs with irregular shape are presented mainly along lamellar boundaries and distribute discontinuously. Apart from lamellar boundaries, precipitation also takes place within lamellar fingers, as indicated by the ellipses in b). These locations are regarded as new preferred precipitation sites.
Figure 3. (a) SEM image of Group A-LTP after low-temperature pre-deformation; (b) magnified micrograph for the square regions marked in (a).
3.2. Microstructure after hot rolling
The microstructures of the as-hot rolled samples observed by SEM and TEM are presented in . As shown in a), a homogeneous microstructure with equiaxed grains and randomly distributed SPPs are well observed in Group A-HR. In contrast, Group B-HR after directly hot-rolling treatment followed by β-quenching contains undesirably heterogeneous/linear distribution of SPPs (b)). The SPPs have a spherical or ellipse shape in both groups, which is different from those after LTP. As presented in (c) and (d), both group samples have a considerably high recrystallization degree. The SPPs in Group A-HR are randomly distributed within the grains and along the grain boundaries (c)). The linearly distributed SPPs are also observed in d) as indicated by white dashed line. The insets in (c) and (d) are selected area diffraction patterns (SADPs) of SPPs and α-Zr is indicated by white arrows. The intermetallic (Zr, Nb, Cu)2Fe-type precipitates are found in both groups and have face-centered cubic (FCC) structure. The chemical composition of SPPs is summarized in . The single type of SPPs means that all particles have the same growth kinetics.
Figure 4. SEM and TEM images for (a) and (c) Group A-HR, and (b) and (d) Group B-HR. The insets are the SADPs of SPPs which are indicated by white arrows in (c) and (d).
Table 1. Chemical composition of the second-phase particles (wt%).
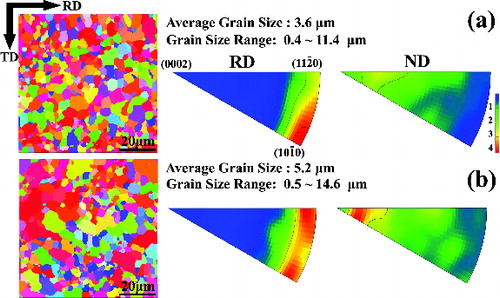
reveals EBSD inverse pole figure (IPF) maps and IPFs for both groups. By comparing (a) and (b), it could be seen that Group A-HR has much more homogenous grain size than Group B-HR. Almost all the grains are refined in Group A-HR (a)). The average grain size is 3.6 μm (range: 0.4–11.4 μm). The directions are parallel to the RD and ⟨0002⟩ directions are tilted approximately 25° from the ND in Group A-HR, as is commonly detected in rolled Zr [Citation26]. The average grain size is 5.2 μm (range: 0.5–14.6 μm) for Group B-HR. Nevertheless, it exhibits large grains in association with smaller grains in Group B-HR (b)). The size of some large grains in Group B-HR is even greater than 10 μm. It had been reported that large grains are identified as non-fragmenting in the rolled structures [Citation25]. In Group-B, the RD tends to spread along the
–
symmetry boundary of the stereographic triangle, and ⟨0002⟩ directions are tilted approximately 15° from the ND, respectively (b)). This finding is an indicative of inhomogeneous deformation in Group B-HR, such as the significant difference in grain size. Therefore, it can be concluded that a reasonably homogeneous microstructure and a clear rolling texture have been obtained in the samples after LTP followed by hot rolling, which cannot be obtained in the directly hot-rolled samples.
Figure 5. EBSD inverse pole figure maps and inverse pole figure maps for: (a) Group A-HR and (b) Group B-HR.
3.3. SPPs growth during processing
shows the morphologies and distributions of SPPs for both groups after each annealing. As shown in (a)–(d), the morphologies of Group A-1st A, Group A-2nd A, Group A-3rd A, and Group A-FA are almost unchanged except for slight coarsening of SPPs. The morphologies of Group B-1st A, Group B-2nd A, Group B-3rd A, and Group B-FA are shown in (e)–(h). Unlike Group A, linear distribution of SPPs could still be easily observed even after the first annealing and the second annealing (as indicated by white dashed lines in (e) and (f)). Random distribution of SPPs becomes more and more evident after the third annealing. The difference in microstructural morphology for both groups is little after final annealing.
Figure 6. Microstructural evolution of samples after each annealing stage: (a) Group A-1st A, (b) Group A-2nd A, (c) Group A-3rd A, (d) Group A-FA, (e) Group B-1st A, (f) Group B-2nd A, (g) Group B-3rd A and (h) Group B-FA. Note that the discrepancy of microstructure between both groups is becoming little with annealing times accumulated. All the images have the same direction and scale bar.
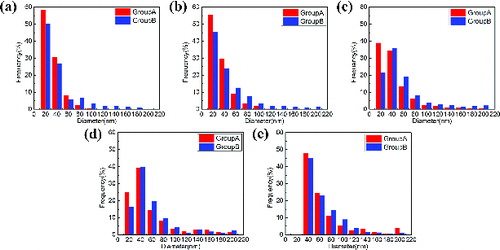
A typical histogram of the SPPs size distribution is used to characterize the evolution of the SPPs size after each annealing, as shown in . The obtained distributions are generally in heterotropic mode. A striking feature, as can be seen in (a)–(d), is that Group A-HR, Group A-1st A, Group A-2nd A, and Group A-3rd A contain a higher fraction of small SPPs (diameter in the range from 20 to 60 nm) than Group B-HR, Group B-1st A, Group B-2nd A, and Group B-3rd A. Nevertheless, the distinction of the SPPs size distribution between two groups becomes smaller with the increase in annealing time. The SPPs size distribution is extremely similar after final annealing, especially between 40 and 100 nm (e)). In addition, the same growing trend of SPPs is also observed in Group A and Group B, revealing a general evolution profile of SPPs growth for the experimental zirconium alloy during the fabrication process. These results clearly show that the SPPs grow with the increase in annealing time.
Figure 7. Distribution of the SPPs grain size in samples: (a) after hot rolling, (b) after the first annealing, (c) after the second annealing, (d) after the third annealing, (e) after final annealing. Similar trend of SPPs growth is also evident in Group A and Group B, suggesting a general evolution profile for the experimental Zr alloy during process of fabrication.
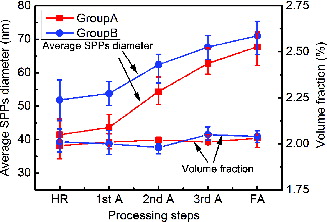
exhibits the variations of the average diameter and the volume fractions of SPPs with respect to each annealing. The SPPs in both groups are coarsened with the increase in annealing time. The average SPPs diameter of Group A is substantially smaller than that of Group B, and the difference in size between the SPPs of both groups after hot rolling is about 10 nm. Then, such difference becomes smaller with the increase in annealing time, which reaches about 3 nm after final annealing. Furthermore, the volume fractions of the SPPs with respect to processes are presented as well. It can be found that the volume fractions are almost the same (2 ± 0.05%) for both groups after hot rolling and each annealing, taking the inevitable statistical error into consideration. This result demonstrates that the SPPs have completely precipitated after hot rolling.
Figure 8. The variations of average diameter of SPPs and volume fraction of the SPPs after hot rolling and each annealing.
3.4. Variations of grain size and texture during processing
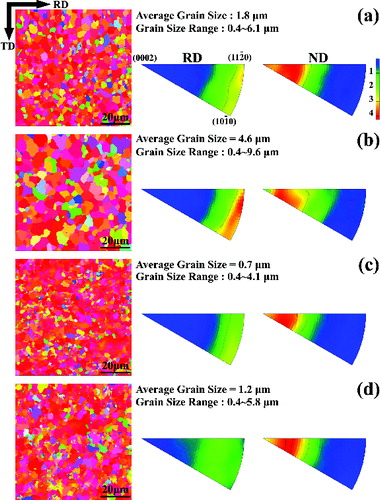
reveals the EBSD IPF maps and IPFs for both groups after the second annealing and the final annealing. Both groups present a homogeneous microstructure in grain size after the second annealing and Group A-2nd A has a finer grain size than Group B-2nd A ((a) and (b)). The average grain size is 1.8 μm (range: 0.4–6.1 μm) for Group A-2nd A and 4.6 μm (range: 0.4–9.6 μm) for Group B-2nd A. The RD tends to spread along the –
direction, and the orientations with ⟨0002⟩ tilted approximately 25° from the ND are found in both groups. However, Group A-2nd A has stronger orientations with ⟨0002⟩ close to ND than Group B-2nd A. On the contrary, Group B-2nd A has much more intensive orientations with
close to RD than Group A-2nd A. (c) and (d) shows the microstructural characteristics for Group A-FA and Group B-FA, respectively. Similar microstructure is evident in both groups. The microstructures of both groups still diverge from the equilibrium state due to low temperature of final annealing [Citation25]. The IPFs for both groups are almost the same. The grain size of both groups is substantially approximate. The distinct difference in grain size between both groups gradually disappears after hot rolling. Combined with the results of SPPs distribution, these findings hint at the point that the effects of LTP on microstructure gradually vanish after multiple rolling and annealing.
Figure 9. EBSD inverse pole figure maps and inverse pole figures of (a) Group A-2nd A, (b) Group B-2nd A, (c) Group A-FA and (d) Group B-FA.
3.5. Microhardness test
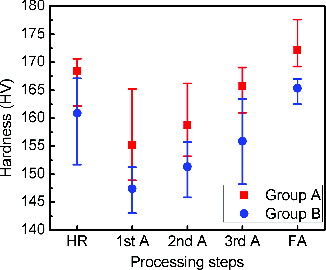
shows the microhardness values for the samples of both groups during fabrication. The hardness values are 168.4 and 160.9 HV for Group A-HR and Group B-HR, respectively. They decrease after the first annealing. As the process continues, the hardness for both groups has slightly increased. The hardening effect in fuel cladding zirconium alloy tubes caused by precipitation is often minimal [Citation27]. By correlating the hardness of samples with their microstructures ( and ), the increase in hardness may due to grain refinement during fabrication. It should be noted that Group A always has the greater hardness than Group B during the whole fabrication process. This result also demonstrates that the grains in Group A are finer than those in Group B.
Figure 10. Values of hardness for both groups during fabrication.
4. Discussion
4.1. Effect of low-temperature pre-deformation on the precipitation of SPPs
In general, SPPs prefer to precipitate at the sites of defects such as dislocations and vacancies [Citation21,Citation28]. Therefore, the purpose of pre-deformation is to introduce a large amount of defects which could provide much more preferred precipitation sites, thus facilitating uniform distribution of the SPPs. By using X-ray peak broadening analysis, Kumar et al. [Citation29] found that, in Zircaloy-2, the relative lattice strain (0.22) of the starting lamellar structure drastically increased to 0.86 after a 20% deformation by cold working. This variation in value means that the enhanced number of defects could be brought in via plastic deformation.
In view of the fact that zirconium has a very low thermal conductivity (about 17 W m K−1) compared with other metals such as Al (210 W m K−1) [Citation11], adiabatic heating during deformation might contribute particularly to enhanced diffusion, promoting the supersaturated alloying elements to precipitate. To calculate the temperature increase of Group A-LTP, the following equation is used [Citation11]:
(1)
(1) where ϵ and σ are the strain and stress at the mid-thickness, respectively; ρ is the density of the alloy; Cp is specific heat capacity of alloy; ▵T is the absolute temperature increase during rolling; β is a constant. In this work, ϵ = 0.4, β = 0.9, ρ = 6.53 g cm−3, σ = 610 MPa, and Cp = 302 J K−1 kg−1 [Citation30]. Since the concentration of zirconium in the alloy is nearly 99%, data of pure zirconium are used in this calculation as an approximate approach. The calculated ▵T closes to 115 K. After pre-deformation, the temperature of Group A could be higher than ∼843 K (the intermediate annealing temperature). As shown from the experimental result, the precipitation of SPPs occurs during this course. Meanwhile, the enhanced amount of defects is introduced and more preferred precipitation and nucleation sites are provided in Group A-LTP. Therefore, fine and uniformly distributed SPPs could be obtained.
4.2. Influence of pre-deformation on growth kinetic of SPPs
In general, cumulative annealing parameter A can compare the size of SPPs for a certain zirconium alloy after aging [Citation31]. A is expressed as
(2)
(2) where the t and T are the annealing temperature and time, respectively. The subscript i refers to the thermal treatment steps involved in the production schedule after β-quenching; Q is the activation energy to precipitate SPPs; R is the gas constant. The value of A for both groups at various processing steps is listed in
Table 2. The value of A for both groups at various processing steps.
According to EquationEquation (2)(2)
(2) , the value of A of Group A should be higher than that of Group B at the same processing step, since Group A is subjected to more aging/annealing time. As shown in and , the average size of SPPs for both groups increases with the increase in A. However, the average size of SPPs of Group A is consistently smaller than that of Group B. This result conflicts with the statement of “the higher the value of A is, the larger the SPPs are” [Citation16]. Therefore, it demonstrates that the kinetic growth of SPPs is altered by LTP.
According to Kahlweit's study [Citation31], the growth equation for the second order kinetics is
(3)
(3) where d0 is the average diameter of SPPs at the onset of growing; d is the average diameter of SPPs during the growing; t is the aging time; and k is the coarsening rate constant which is a function of temperature T.
The initial average diameter of SPPs (d0) is quite different in both groups, as shown in . As is known, the SPPs prefer to precipitate at the site of defects [Citation28]. For instance, the linear distribution of SPPs after hot rolling is an evidence of the precipitation of SPPs at the lamellar boundaries (b)). Nevertheless, the quantity of alloying elements addition is fixed. The d0 precipitated at the nucleation sites can be estimated semi-quantitatively. d0 could be defined as
(4)
(4) where M is the total mass of the formed SPPs of zirconium alloy (ideal concept), N is the amount of intrinsic nucleation sites (such as grain boundaries, sub-grains boundaries, and dislocations). In this study, volume fractions of SPPs are almost the same (2 ± 0.05%) for both groups (b)). In other words, only in this condition that SPPs have precipitated completely,
EquationEquation (4)
(4)
(4) would be able to work well.
When samples are pre-deformed, more defects are introduced and more preferred precipitation sites are provided. Thus, EquationEquation (4)(4)
(4) can be expressed as
(5)
(5) where Nin is the increment in preferred precipitation sites induced by pre-deformation. Obviously, d0 would decrease when more defects are introduced as M is fixed.
As discussed above, a qualitative schematic explanation is given in . It is defined that transformed α grain with a lamellar structure which produced via β-quenching as an initial state. a) shows the manner in which SPPs are precipitated in the directly hot-rolled samples. Upon aging before hot rolling, SPPs generally precipitate at prior β-grain boundaries and/or at lamellar boundaries. As presented in b), pre-deformation introduces more defects, some of which are inside lamellar fingers. Therefore, the average diameter of SPPs at the onset of growing d0 decreases as interpreted in EquationEquation (5)(5)
(5) . The discrepancy average size of SPPs resulted from different d0 is in good agreement with those experimental statistical data.
Figure 11. Schematic interpretation of the precipitation of SPPs in: (a) directly hot rolled samples, and (b) in pre-deformed ones. The amount of SPPs and precipitation sites is only a schematic, not a quantitative representation.
4.3. Microstructural homogeneity
A remarkable difference in microstructure is observed between both groups after hot rolling. Although both groups have considerably recrystallized microstructure, the distribution of SPPs and grain size in Group A-HR are more homogenous than those in Group B-HR ( and ). Due to the high plastic anisotropy of zirconium alloys, highly heterogeneous deformation is inevitable during thermomechanical work [Citation25,Citation32]. This is believed to be responsible for heterogeneous microstructure of Group B-HR obtained after hot rolling. It should be noted that Group A-HR samples were aged at ∼743 K for 3 h between pre-deformation and hot rolling. The recovery would take place during this stage and result in grain boundary movement, dislocation movement, and lattice rotation [Citation33]. New slip systems are activated when hot rolled. Thus, the grains in Group A-HR are flattened more thoroughly than those in Group B-HR under identical strain from the quenching step.
Various studies have investigated the texture of zirconium alloys, which describe the characterization of texture in detail [Citation11,Citation25,Citation26,Citation29,Citation34]. Such as the directions paralleling to the RD and the ⟨0002⟩ directions tilting approximately 25° from the ND in Group A-HR had been observed in rolled zirconium alloys [Citation11,Citation26]. This finding indicates that the preferred orientations in Group A-HR have been obtained from a quenched texture by LTP and hot rolling [Citation25]. The strong texture of
directions along RD and ⟨0002⟩ directions tilted approximately 15° from the ND in Group B-HR are always found in annealed zirconium alloys [Citation26,Citation29]. It can be calculated from EquationEquation (1)
(1)
(1) that the temperature increase in Group A-HR and Group B-HR during hot rolling is 165 and 209 K, respectively. Hence, it is understandable that such a high temperature increasing during hot rolling is likely to render some crystallites rotate around the c-axis to form bimodal texture along RD and the c-axis gradual rotates toward the ND. The orientations with
close to RD are much weaker in Group A-HR, which could attribute to the relatively low temperature increase when hot rolled. In addition, non-fragmenting grains in Group B-HR may maintain the texture of as-quenched state. This might be a possible explanation for the strong ⟨0002⟩ directions tilted from ND in Group B-HR.
With the processing ongoing, the textures in both groups become similar (). A pronounced basal texture, with directions parallel to the RD and ⟨0002⟩ directions tilt from the ND, develops after the second annealing. Compared with the texture after hot rolling, it is obviously observed that
directions are strengthened by annealing. It has been reported that the large grains are more textured than the smaller ones [Citation25]. This could explain why the
directions in Group A-2nd A are weaker than those in Group B-2nd A whose grain size is relatively larger ((a) and (b)). It demonstrates that the effect of LTP on grain refinement is overwhelmingly stronger than that of direct hot-rolling treatment, as the discrepant grain size or hardness in both groups has been observed (, and ).
The distribution of SPPs in Group A become uniform after hot rolling, which is exceedingly earlier than that of Group B. Explaining this phenomenon is difficult as hot rolling is a complex process involving deformation and recrystallization (static and dynamic). Many studies had reported that as the aging temperature and/or time increase, not only the coarsening of SPPs is remarkable, but also the distribution of SPPs becomes more random [Citation17]. As is known, the classical Lifshitz–Slyozov–Wagner (LSW) model suggests that the SPPs’ growth is controlled by matrix diffusion and interface transfer [Citation35,Citation36]. One could notice that the SPPs in Group A-LTP have precipitated are much fine as discussed in Section 4.2. The pre-deformation also induces detects and leads to refined grains after hot rolling. These findings provide the evidence to interpret that a large number of diffusion paths exist in Group A-LTP before hot rolling. Furthermore, the SPPs in Group A-HR grow at the holding time at 873 K. In contrast, the SPPs in Group B-HR nucleate and precipitate at the lath boundaries first. Therefore, uniform distribution of SPPs is facilitated during hot rolling. The narrowing gap of the size of SPPs with the increase in annealing time can also be explained by the LSW model. As the grain size of Group A is always smaller than that of Group B, the amount of interface in Group A is more than that in Group B. Consequently, the growth rate of SPPs of Group A is slightly faster than that of Group B.
4.4. Related to corrosion resistance
The difference in microstructural features between both groups, including grain size, texture, and distribution of SPPs, is inconspicuous after final annealing ((d), (h), (c) and (d)). Nevertheless, it is noted that, in the present work, a homogeneous microstructure obtained in Group A is much earlier than in Group B. The homogeneous microstructure is a relevant factor to acquire excellent performance of zirconium alloys in service [Citation1,Citation37]. As mentioned in Section 1, uniformly distributed and fine SPPs can delay the degradation of oxide and may reduce the hydrogen pick up [Citation9,Citation10]. Meanwhile, Ly et al. [Citation8] found that even decreasing the mean grain size of Zircaloy from 10 to 6 μm can extend the period from pre- to post-transition from 100 to 170 days in primary water condition.
Therefore, such a homogeneous microstructure obtained at an early stage of fabrication is beneficial for optimizing the conventional manufacturing route for improving the corrosion resistance and other properties of zirconium alloys. In order to be compatible with the directly hot-rolled ones, the degree of deformation of hot rolling in Group A is limited in the current work. In fact, larger deformation of hot rolling could be applied after LTP to meet the acquirement of dimensional accuracy during fabrication. Then, similar or even more optimum microstructure would be obtained with fewer times “cold rolling and intermediate annealing” imposed on. Therefore, adding LTP into fabrication route could enhance the controllability of microstructure of zirconium alloys and greatly reduce the cost of production.
5. Conclusions
The effect of LTP on microstructural evolution of a Zr–Sn–Nb–Fe–Cu–O alloy during fabrication process has been investigated. Some key conclusions can be drawn as follows:
Refined grains and uniform distribution SPPs are obtained after hot rolling in Group A, whereas a homogeneous microstructure is detected in Group B after two cycles of cold rolling and annealing. The grain size of Group A is consistently smaller than that of Group B during processing. These observations elucidate that LTP has a remarkable effect on the formation of refined grains and uniform distribution SPPs.
Although Group A samples have a slight higher value of the cumulative annealing parameter, the SPPs in Group A are consistently smaller than that of Group B after each annealing. The reason is that pre-deformation could introduce defects and thus reduce the initial SPPs diameter.
Typical rolling and annealing textures develop in Group A with ⟨0002⟩ directions rotating slightly away from the ND and
directions aligning with the RD after rolling or
Albeit the different microstructural features between both groups, including grain size, texture, and distribution of SPPs, are inconspicuous after final annealing, the homogeneous microstructure obtained in Group A at an early stage of fabrication is beneficial for optimizing the conventional manufacturing route for improving the properties of zirconium alloys.
Acknowledgements
The authors would like to acknowledge the financial support provided by 973 Program [grant number 2014CB046701]; National Science Foundation [grant number 51302168]; and Shanghai Natural Science Foundation [grant number 12ZR1445500].
Disclosure statement
No potential conflict of interest was reported by the authors.
References
- Kim YJ, Kook DH, Kim TH, et al. Stress and temperature-dependent hydride reorientation of Zircaloy-4 cladding and its effect on the ductility degradation. J Nucl Sci Technol. 2015;52:717–727.
- Sawabe T, Sonoda T, Kitajima S, et al. Analysis of atomic distribution in as-fabricated Zircaloy-2 claddings by atom probe tomography under high-energy pulsed laser. J Nucl Mater. 2013;442:168–174.
- Narukawa T, Amaya M. The effect of oxidation and crystal phase condition on the ballooning and rupture behavior of Zircaloy-4 cladding tube-under transient-heating conditions. J Nucl Sci Technol. Forthcoming 2015. doi:10.1080/00223131.2015.1025884
- Yang H, Shen J, Matsukawa Y, et al. Effects of alloying elements (Sn, Nb, Cr, and Mo) on the microstructure and mechanical properties of zirconium alloys. J Nucl Sci Technol. Forthcoming 2015. doi:10.1080/00223131.2014.996622
- Zhang XY, Shi MH, Li C, et al. The influence of grain size on the corrosion resistance of nanocrystalline zirconium metal. Mater Sci Eng A. 2007;448:259–263.
- Garner A, Gholinia A, Frankel P, et al. The microstructure and microtexture of zirconium oxide films studied by transmission electron backscatter diffraction and automated crystal orientation mapping with transmission electron microscopy. Acta Mater. 2014;80:159–171.
- Ni N, Hudson D, Wei J, et al. How the crystallography and nanoscale chemistry of the metal/oxide interface develops during the aqueous oxidation of zirconium cladding alloys. Acta Mater. 2012;60:7132–7149.
- Ly A, Ambard A, Blat-Yrieix M, et al. Understanding crack formation at the metal/oxide interface during corrosion of Zircaloy-4 using a simple mechanical Model. J ASTM Int. 2011;8:1–29.
- Li C, Zuo R, Li Z, et al. Transmission electron microscopy investigation of Zr2(Fe, Ni) particles incorporated in the oxide film formed on a Zirconium alloy. Thin Solid Films 2004;461:272–276.
- Hatano Y, Isobe K, Hitaka R, et al. Role of intermetallic precipitates in hydrogen uptake of Zircaloy-2. J Nucl Sci Technol. 1996;33:944–949.
- Jiang L, Pérez-Prado MT, Gruber PA, et al. Texture, microstructure and mechanical properties of equiaxed ultrafine-grained Zr fabricated by accumulative roll bonding. Acta Mater. 2008;56:1228–1242.
- Hegedűs Z, Gubicza J, Szommer P, et al. Inhomogeneous softening during annealing of ultrafine-grained silver processed by HPT. J Mater Sci. 2013;48:7384–7391.
- Guo D, Li M, Shi Y, et al. Simultaneously enhancing the ductility and strength of cryorolled Zr via tailoring dislocation configurations. Mater Sci Eng A. 2012;558:611–615.
- Su LH, Lu C, He LZ, et al. Study of vacancy-type defects by positron annihilation in ultrafine-grained aluminum severely deformed at room and cryogenic temperature. Acta Mater. 2012;60:4218–4228.
- Wang J, Yuan W, Mishra RS, et al. Microstructure and mechanical properties of friction stir welded oxide dispersion strengthened alloy. J Nucl Mater. 2013;432:274–280.
- Steinberg E, Schaa A, Weidinger HG. Analytical approaches and experimental verification to describe the influence of cold work and heat treatment on the mechanical properties of zircaloy cladding tubes. Zirconium in the Nuclear Industry: Sixth International Symposium, ASTM STP 824; 1984; British Columbia, Canada. p. 106–122.
- Luan BF, Chai LJ, Chen JW, et al. Growth behavior study of second phase particles in a Zr–Sn–Nb–Fe–Cr–Cu alloy. J Nucl Mater. 2012;423:127–131.
- Liu P, Kang BX, Cao XG, et al. Aging precipitation and recrystallization of rapidly solidified Cu–Cr–Zr–Mg alloy. Mater Sci Eng A. 1999;265:262–267.
- Deschamps A, Brechet Y. Influence of predeformation and ageing of an Al–Zn–Mg alloy – II. Modeling of precipitation kinetics and yield stress. Acta Mater. 1998;47:293–305.
- Yuan Z-X, Song S-H, Wang Y-H, et al. Effect of pre-deformation on the age hardening of a niobium-microalloyed steel. Mater Lett. 2005;59:2048–2051.
- Chai L, Luan B, Murty KL, et al. Effect of predeformation on microstructural evolution of a Zr alloy during 550–700°C aging after β quenching. Acta Mater. 2013;61:3099–3109.
- Saibaba N. Fabrication of seamless calandria tubes by cold pilgering route using 3-pass and 2-pass schedules. J Nucl Mater. 2008;383:63–70.
- Yang ZN, Liu FC, Zhang FC, et al. Microstructural evolution and mechanical properties in Zr705 during the rolling process. Mater Sci Eng A. 2012;544:54–58.
- Nene SS, Sharma G, Singh RN, et al. Microstructural evolution in and flow properties of Zr–2.5Nb pressure tube material at elevated temperature. J Nucl Mater. 2014;449:62–68.
- Krishna KM, Sahoo SK, Samajdar I, et al. Microstructural and textural developments during Zircaloy-4 fuel tube fabrication. J Nucl Mater. 2008;383:78–85.
- Jiang L, Ruano OA, Kassner ME, et al. The fabrication of bulk ultrafine-grained zirconium by accumulative roll bonding. J Miner Met Mater Soc. 2007;59:42–45.
- Sabol GP, Comstock RJ, Nayak UP. Effect of dilute alloy additions of molybdenum, niobium, and vanadium on zirconium corrosion. Zirconium in the Nuclear Industry: Twelfth International Symposium, ASTM STP 1354; 2000; West Conshohocken, PA. p. 525–544.
- Chai LJ, Luan BF, Gao SS, et al. Study of precipitate evolution and recrystallization of β-quenched Zr–Sn–Nb–Fe–Cr–Cu alloy during aging. J Nucl Mater. 2012;427:274–281.
- Kiran Kumar M, Vanitha C, Samajdar I, et al. Deformation texture and microtexture developments in a cold rolled single phase hexagonal Zircaloy 2. Mater Sci Technol. 2006;22:331–342.
- Miller G. Metallurgy of the rarer metals – 2. Zirconium. London: Butterworths; 1957.
- Kahlweit M. Ostwald ripening of precipitates. Adv Colloid Interface Sci. 1975;5:1–35.
- Ungár T, Castelnau O, Ribárik G, et al. Grain to grain slip activity in plastically deformed Zr determined by X-ray micro-diffraction line profile analysis. Acta Mater. 2007;55:1117–1127.
- Mozzani N, Auzoux Q, Le Boulch D, et al. Mechanical behavior of recrystallized Zircaloy-4 under monotonic loading at room temperature: tests and simplified anisotropic modeling. J Nucl Mater. 2014;447:94–106.
- Luan B, Qing YE, Chen J, et al. Deformation twinning and textural evolution of pure zirconium during rolling at low temperature. Trans Nonferrous Met Soc China. 2013;23:2890–2895.
- Lifshitz IM, Slyozov VV. The kinetics of precipitation from supersaturated solid solutions. J Phys Chem Solids 1961;19:35–50.
- Greenwood GW. The growth of dispersed precipitates in solutions. Acta Metall. 1956;4:243–248.
- Ni N, Lozano-Perez S, Sykes JM, et al. Focussed ion beam sectioning for the 3D characterisation of cracking in oxide scales formed on commercial ZIRLO™ alloys during corrosion in high temperature pressurised water. Corros Sci. 2011;53:4073–4083.