
 ?Mathematical formulae have been encoded as MathML and are displayed in this HTML version using MathJax in order to improve their display. Uncheck the box to turn MathJax off. This feature requires Javascript. Click on a formula to zoom.
Abstract
A method to obtain a hazard curve of a forest fire was developed. The method has four steps: a logic tree formulation, a response surface evaluation, a Monte Carlo simulation, and an annual exceedance frequency calculation. The logic tree consists domains of “forest fire breakout and spread conditions”, “weather conditions”, “vegetation conditions”, and “forest fire simulation conditions.” Condition parameters of the logic boxes are static if stable during a forest fire or not sensitive to a forest fire intensity, and non-static parameters are variables whose frequency/probability is given based on existing databases or evaluations. Response surfaces of a reaction intensity and a fireline intensity were prepared by interpolating outputs from a number of forest fire propagation simulations by fire area simulator (FARSITE). The Monte Carlo simulation was performed where one sample represented a set of variable parameters of the logic boxes and a corresponding intensity was evaluated from the response surface. The hazard curve, i.e. an annual exceedance frequency of the intensity, was therefore calculated from the histogram of the Monte Carlo simulation outputs. The new method was applied to evaluate hazard curves of a reaction intensity and a fireline intensity for a typical location around a sodium-cooled fast reactor in Japan.
1. Introduction
After the Fukushima Daiichi nuclear power plant (NPP) accidents, serious concerns are being raised on the safety of an NPP against external hazards; one of which is a forest fire. Safety assessments of an NPP on external hazards had been performed by a deterministic approach in general where bounding conditions (e.g. initial and boundary conditions) are conservatively given, and safety-related systems of an NPP had been designed based on these assessments [Citation1]. According to a guide for external fire accidents by the regulation [Citation2], possible forest fire breakout locations are identified taking into account the forest fire causes and land utilization, then a reaction intensity around an NPP is evaluated for the worst weather overlapped condition of, e.g., prevailing wind speed (PWS), relative humidity (RH), and ambient temperature by a numerical simulation of a forest fire propagation using, e.g., fire area simulator (FARSITE) [Citation3]. Appropriateness of measures against a forest fire is confirmed by this deterministic analysis, although it is not enough to utilize for quantitative comparison of a relative risk of a forest fire to other external hazard risks. A frequency–intensity combination of a forest fire is necessary to be obtained for a risk assessment.
The previous studies of a risk assessment of a forest fire had been focused on an occurrence frequency, typically based on a statistical approach using a forest fire database, and the studies did not include an assessment of frequency–intensity combination. For the cases that there are enough number of data in a forest fire database, a statistical analysis on spatial and temporal distributions of a forest fire occurrence frequency are possible to summarize a so-called “hazard map.” For example, a static spatial occurrence frequency map had been created for a location in Ontario, Canada [Citation4] and spatial and temporal maps of a forest fire occurrence had been created for a location in Oregon, USA [Citation5]. Both the studies had enough number of forest fire data for statistical analyses, and the hazard maps showed the probability of forest fire occurrence, however, did not include information of a forest fire intensity, e.g. reaction intensity. In the previous study [Citation5], a probability of a forest fire occurring and becoming a large fire was separately considered by evaluating a product of a frequency map of occurrence which varies with seasons and a conditional probability of forest fire spread which varies with forest fire fighting actions and weather conditions. An occurrence frequency of a forest fire in Japan was analyzed in the previous study [Citation6] on the data recorded during 1989–2000. The study showed a power law relation between the burnt area to a frequency of a forest fire occurrence and pointed out an areal difference of the frequency in Japan, however the study did not include an evaluation on frequency–intensity combination. Region-by-region analysis on a forest fire occurrence frequency in Japan has not been really investigated so far except for a limited number of regions [Citation7].
This study provides a new method to evaluate a hazard curve of a forest fire where a combination of frequency and intensity is incorporated. The previous studies indicate that a regional and temporal variety of forest fire occurrence frequency and a weather condition variety on a probability of forest fire spread are necessary to be accounted in the hazard curve evaluation. Hazard curves of a forest fire intensity, i.e. “reaction intensity” and “fireline intensity”, are evaluated in this paper for a location around a sodium-cooled fast reactor as a typical regional conditions around an NPP.
2. Framework of forest fire hazard curve evaluation method
2.1. Overall scheme of forest fire risk assessment methodology
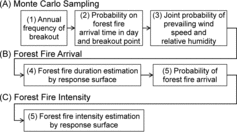
A methodology for assessing a forest fire risk on an NPP is being developed in which there are two parts to evaluate a core damage frequency as a final result as shown in . The first part is to obtain a “hazard curve” of an intensity to represent strength of a forest fire and the second part is to evaluate “conditional core damage probability” by challenges raised by a forest fire. In an overall scheme of the methodology, intensity parameters obtained by the hazard curve evaluation in the first part should be consistent with the challenge parameters in the second part.
Figure 1. Framework of a forest fire risk assessment methodology.
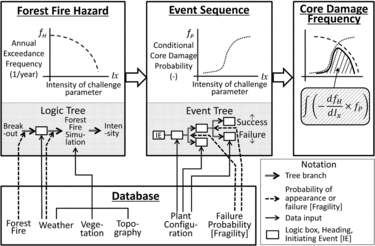
Phenomena during a forest fire [Citation8] are raised by heat, flame, smoke, and fire sparks in general. Challenges due to “heat” rise when a forest fire is adjacent to an NPP by heat transfer to structures, e.g. a reactor building, an exterior fuel tank, and an air cooler. The intensity parameters related to the challenges by “heat” are “reaction intensity” (unit in kW/m2) and “fireline intensity” (unit in kW/m) which can be quantitatively evaluated by a forest fire numerical simulation by FARSITE [Citation9,Citation10]. “Reaction intensity” represents a heat release rate per unit area by a combustion of forest fuel which includes radiation heat and convection heat. The reaction intensity mainly depends on vegetation data, e.g. weight of fuel bed per unit area and heat yield of fuel bed. “Fireline intensity” represents a rush of a forest fire, and it is a product of the reaction intensity and a rate of spread of a forest fire front which depends on weather conditions, e.g. PWS and RH. In the second part of the risk assessment, the “reaction intensity” is utilized to evaluate e.g. a failure probability (i.e. fragility) of the structures [Citation11] in an event tree, and the “fireline intensity” is utilized to estimate a breach probability of a firebreak [Citation12].
This paper specifically deals with an evaluation method of a hazard curve which represents a quantitative relation between frequency and intensity, in relation to the challenge by “heat” on an NPP, as the first part of the methodology for a forest fire risk assessment. The other studies deal with the effects by “flame” [Citation10], “smoke” [Citation13], and “flying sparks.”
2.2. Scheme of forest fire hazard curve evaluation
A method to obtain a hazard curve of an intensity of a forest fire was developed in this study. The method has four steps as shown in (1) a logic tree formulation by setting categorized domains and logic boxes with identifying parameter status (i.e. static value or frequency/probability variable), (2) a response surface evaluation of a forest fire intensity by interpolating the intensity outputs from forest fire simulations, (3) a Monte Carlo simulation to obtain a number of intensity estimations by the response surface for the given sample set of the frequency/probability variables, and (4) an annual exceedance frequency (AEF) calculation for obtaining the hazard curve from the outputs of the Monte Carlo simulation.
Figure 2. Procedure of a forest fire hazard curve evaluation.
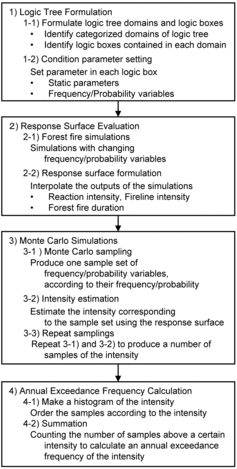
A logic tree contains a sequential connection of several logic boxes, and each logic box represents initial, boundary, or state condition which changes the forest fire intensity. The logic tree starts with a forest fire breakout and ends with a forest fire intensity. Each logic box has a representative parameter to which a static value or a frequency/probability is given. The response surfaces of the intensity for different combinations of logic box parameters are obtained by interpolating the intensity outputs of a number of forest fire simulations. A Monte Carlo simulation is performed where one sample set of logic box parameters gives a unique corresponding intensity by the estimation using the response surface. The hazard curve, i.e. an AEF of the intensity, was therefore calculated from the histogram of a number of the intensity obtained by the Monte Carlo simulation.
2.3. Formulation of logic tree and characterization of logic box
The logic tree developed in this study consists of, as shown in , categorized domains of “forest fire breakout and spread conditions”, “weather conditions”, “vegetation conditions”, and “forest fire simulation conditions.” Each domain contains several logic boxes to represent particular conditions having influences on the intensity. In each logic box, a parameter representing its condition or state is necessary to be given. If the parameter is constant during a forest fire duration (e.g. some hours to days) or has a low sensitivity for the forest fire intensity, a static value to represent a typical state, or to result in a conservative intensity, is set to the parameter. Non-static parameter is dealt with as variable, and frequency/probability is needed to be prepared from a database, if exist, or by some evaluation.
Figure 3. Logic tree for a forest fire hazard curve evaluation.
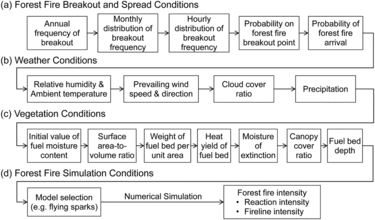
For the forest fire breakout and spread conditions, the logic boxes are annual frequency of breakout, monthly distribution of breakout frequency, hourly distribution of breakout frequency, probability on forest fire breakout point, and probability of forest fire arrival at an NPP. The breakout frequency is prepared based on a regional forest fire data (e.g. a database of a prefecture) in order to take into account for a regional and temporal variety of forest fire occurrence frequency. Several forest fire breakout points are to be selected with accounting land utilization and potential causes of a forest fire. For the probability of forest fire arrival at an NPP, a forest fire fighting action for extinguishment is needed to be taken into account. It is known that most of forest fires in Japan are extinguished in a few hours [Citation8] by fire departments and fire companies. Then a probability of forest fire arrival at an NPP can be evaluated as a complementary probability of extinguishment of a forest fire during a grace period before the forest fire arrival at an NPP after the breakout. A weather condition variety on a probability of forest fire spread can be considered in a conservative manner when assuming that a forest fire is not quenched by a rainfall or snowfall during a forest fire. For weather conditions, joint appearance frequency of RH and ambient temperature, joint appearance frequency of PWS and prevailing wind direction, cloud cover ratio, and precipitation are set to the logic boxes. These parameters are determined from a weather database. For vegetation conditions, the logic boxes are initial value of fuel moisture content, surface area-to-volume ratio, weight of the fuel bed per unit area, heat yield of fuel bed, moisture of extinction, canopy cover ratio, and fuel bed depth. Most of these vegetation parameters do not vary during a forest fire duration, and static values are set to these parameters according to forest tree types [Citation10]. The initial value of the fuel moisture content depends on weather conditions, especially RH and precipitation prior to the forest fire breakout [Citation8], and can be set as static values in a conservative manner. For forest fire simulation conditions, analytical model selection of FARSITE simulator can be taken into account, if necessary.
3. Evaluation of a hazard curve of forest fire
In order to confirm the applicability of the new method mentioned above, hazard curves of a reaction intensity and a fireline intensity were evaluated. A location around a typical sodium-cooled fast reactor in Japan was selected in this study where a forest fire propagation simulation had been performed in the previous study [Citation9]. Deciduous broad leaf forests cover most of the vegetation area in the location studied, and the reactor site faces the Sea of Japan. The forest fire database of the prefecture during 9 years (during 2004–2012) [Citation14] and the hourly weather database of the location studied during 23 years (during 1990–2012) [Citation15] were utilized.
3.1. Analysis on the logic boxes
3.1.1. Forest fire breakout frequency
The forest fire database contains the information of forest fire burnt area above 1×10⁻⁴ km2. The annual average breakout frequency (Fst, unit in 1/year) of the location studied is calculated from
(1)
(1) where
Sst: vegetated area in the location studied (= 196 km2),
Spref: prefecture area (= 4189 km2),
Npref: total number of forest fire in the prefecture (= 69), and
Y: statistical target duration (= 9 years).
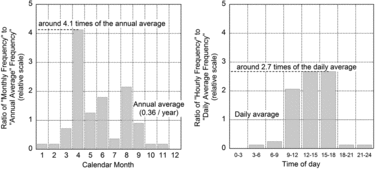
As a characteristic of forest fires in Japan, the most dominant causes are intentional or accidental human activities; for example, rubbish burns, controlled burns, arson, smoking, and playing with fire [Citation16]. The breakout frequency of a forest fire becomes high in months and hours along with human activities. Monthly and hourly distributions of a forest fire breakout frequency are shown in left- and right-hand side of , respectively. Especially in April, the variation in frequency of a forest fire breakout is around 4.1 times higher than the annual average breakout frequency. The variation in frequency of the afternoon (i.e. 12–15 and 15–18 of day in ) is around 2.7 times higher than the daily average frequency. The peak momentum frequency of a forest fire breakout, then, might become roughly one order higher (i.e. 4.1×2.7 ≅ 11) than the annual average breakout frequency. The annual average breakout frequency of 0.36 per year of EquationEquation (1)(1)
(1) is utilized for the hazard curve evaluation in below in order to obtain “annual” exceedance frequency of the forest fire intensity; however, the peak momentum frequency variation within a year would be considered in a preparatory action related to a forest fire, for example, monitoring a forest fire around an NPP.
Figure 4. Monthly and hourly forest fire breakout frequency distributions.
3.1.2. Forest fire breakout point
It is ideal to utilize an area-specific spatial map of a forest fire hazard; however, general information on a forest fire hazard map does not exist in the location studied, and the number of forest fire is not enough for the evaluation of spatial distribution of a forest fire occurrence frequency map. Therefore, three forest fire breakout points, the same as the previous study on a forest fire propagation simulation [Citation9], were selected in this study with considering the topographical features [Citation17] and land usage information [Citation18] of the location studied in reference to the guide on a forest fire assessment [Citation19]. Three points are selected from different directions from the reactor site: one forest road end 2.5 km south-south east away from the sodium-cooled fast reactor site, and two public beaches 3.5 km east and 1 km south-west away from the reactor site. All three points are in relation to human activities, i.e. controlled burns near a forest road and cook-outs on beaches, which come to be performed in spring after winter, such as in April. It was assumed that each of three points has the equal probability of the forest fire breakout (Ppnt):
(2)
(2)
3.1.3. Forest fire duration and arrival probability
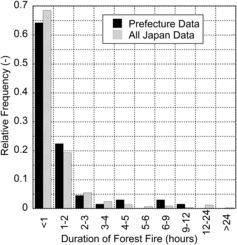
Firefighting operation by fire departments and/or self-defense fire brigade of an NPP is necessary to be modeled to obtain the probability of forest fire arrival. The forest fire duration, i.e. a duration from the breakout to the extinguishment, of the prefecture and of Japan [Citation8] (database during 1995–2003) is shown in . Both the durations show almost the same tendency that most of forest fires are extinguished in a short period of time (e.g. less than one hour) after the breakout. A regression formula for the probability of forest fire extinguishment (Pext) was evaluated using a Weibull distribution from the database of forest fire duration in Japan as follows:
(3)
(3) where
t: time after a breakout (hour),
γ: location parameter of a Weibull distribution (≡ 1 hour),
η: scale parameter of a Weibull distribution (= 0.47), and
m: shape parameter of a Weibull distribution (= 0.48).
Figure 5. Relative frequency of forest fire duration (prefecture and Japan).
Then, the probability of the forest fire arrival at an NPP (Parv) is given by
(4)
(4) where Tarv: forest fire duration until the arrival at an NPP after the breakout (hour).
3.1.4. Weather conditions
The weather conditions were analyzed to obtain a joint probability of weather appearance. The weather parameters sensitive to the forest fire intensity are PWS and RH whereas ambient temperature is not [Citation9]. The prevailing wind direction is assumed to be leeward direction from the breakout point to the reactor site in a conservative manner because this assumption leads higher intensity and shorter period of forest fire arrival. While clouds and rainfall/snowfall would depress or weaken a forest fire, cloud cover ratio and precipitation are set to be zero in a conservative manner as well. The joint appearance frequency of PWS and RH in the location studied, based on the weather database, are shown in the upper left of . PWS below around 5 m/s and RH in around 60%−90% appears with greater probability, whereas high PWS and low RH condition (e.g. PWS above 10 m/s and RH below 40%) is rare. The joint appearance probability (PPWS-RH) is formulated by categorizing the database into 5 RH ranges (i.e. 0%–20%/20%–40%/40%−60%/60%−80%/80%–100%) to utilize in the Monte Carlo simulation below. The annual exceedance probability of each RH category is depicted in the lower left of . The weather database, depicted by solid lines in , is utilized to the ranges below thresholds, i.e. 99 percentile PWS appearance frequency for the categories of 20%–40%/40%−60%/60%−80%/80%−100% RH and 0–95 percentile PWS appearance frequency for the category of 0%–20% RH. The generalized Pareto distribution (GPD) of each RH category, depicted by dotted lines in , is connected to the database at the thresholds, and the GPD is utilized to estimate an appearance probability above the threshold of the PWS range. By this formulation, using the GPD, rare appearance probability of PWS above the highest recorded one is included in the Monte Carlo simulation in below for the evaluation of hazard curve for very low-frequency and high-intensity conditions. The GPD of the exceedance probability (PPWS-RH) of the PWS (v, unit in m/s) above V (m/s) under the condition of v above U (m/s) is formulated as a function of V:
(5)
(5) where
v, V: PWS (m/s)
U: location parameter of a GPD (m/s), i.e. threshold of PWS,
ξ: scale parameter of a GPD (–), and
σ: inequality parameter of a GPD (–).
Figure 6. Joint appearance probability of prevailing wind speed and relative humidity.
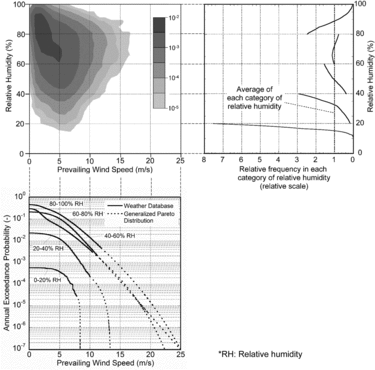
The GPD parameters for each RH category are summarized in . In each category, a relative frequency of RH was prepared based on an RH histogram within the relevant RH category as shown in the upper right of
Table 1. Generalized Pareto distribution parameters for each relative humidity category.
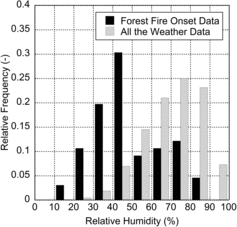
It is known that a forest fire tends to take place when RH is low. The RH distribution under a forest fire onset condition is compared with that of all the weather data in . The RH distribution leans to the lower RH, and the mode is 40%–50% RH for the forest fire onset condition. In order to take into account the dependency of forest fire breakout frequency to RH, the multiplication factor in , which is derived from the probability under forest fire onset divided by that of all the weather data, is included in the Monte Carlo simulation below.
Figure 7. Appearance probability of relative humidity (forest fire onset and all the weather data).
3.1.5. Vegetation conditions and forest fire simulation conditions
As for the vegetation, there are broad leaf forests in the location studied [Citation10] according to databases of a digital national land information [Citation18] and of a prefectural forest registry [Citation20]. The vegetation parameters do not change during a duration of a forest fire, hence these data are set static, and one unique data-set of forest tree characteristic data were utilized by referring the previous studies [Citation10,Citation21].
As for the simulation conditions, one of model selections of FARSITE is derived from the option of including/excluding flying sparks. In this study, the effect on a hazard curve by flying sparks is excluded as an assumption because flying sparks would not affect the forest fire intensity. However, flying sparks affect the local behavior of a forest fire spotting and spread, and they would affect the forest fire duration until the arrival at an NPP after the breakout and the probability of the forest fire arrival at the power plant. The sensitivity analysis on the effect of flying sparks is recognized as a future study.
3.2. Response surface evaluation
Response surfaces are needed to be prepared for the forest fire intensity (i.e. reaction intensity and fireline intensity). A response surface of a forest fire duration which will be applied to an evaluation of a forest fire arrival probability by EquationEquation (4)(4)
(4) is necessary as well. The inputs to the response surfaces are the variable parameters related to the logic boxes; i.e. PWS, RH, forest fire arrival time in day, and a forest fire breakout point.
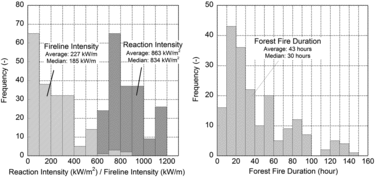
In order to prepare the response surfaces, a number of FASITE simulations to cover the variable ranges of the response surface input parameters were performed: three cases for the breakout points (i.e. one forest road end and two public beaches), four cases for the breakout time (i.e. 0/6/12/18 o'clock in day), four cases for PWS (i.e. 2/10/20/28 m/s), and four cases for RH (i.e. 2%/23%/35%/50%). The PWS of 2 and 28 m/s corresponds to the mode value and the highest recorded value, respectively. The RH of 2%, 23%, and 35% corresponds to 0.1, 1, and 10 percentiles of the RH appearance probability. The total number of the FARSITE simulation is (3×4×4×4 =) 192 cases. The histograms of extremal values along the reactor site boundary of reaction intensity and fireline intensity and the histogram of the forest fire duration (i.e. duration from the breakout to the arrival at the NPP) from 192 case outputs of the FARSITE simulation are shown in . The range of 192 case outputs for the reaction intensity is 6.67×10² to 1.18×10³ kw/m2, for the fireline intensity is 41.5 to 827 kW/m, and for the forest fire duration is 5.9 to 142.7 hours. The reaction intensity is relatively in narrow range in comparison with the fireline intensity. This is because the reaction intensity represents the heat release rate by combustion of the forest fuel per unit area, hence it falls around the level determined by the density of forest fuel, whereas the fireline intensity is related to a product of not only the reaction intensity but also the rate of spread of the forest fire that varies according to the wide range of PWS including above the highest recorded PWS.
Figure 8. Histograms of reaction intensity, fireline intensity, and forest fire duration of the FARSITE simulation outputs.
The evaluation of the response surface of a target output parameter (y) is based on the Gaussian process interpolation (GPI):
(6)
(6)
(7)
(7) where
xi; input vector (xi1, xi2, xi3); xi1 = PWS, xi2 = RH, xi3 = arrival time in day,
μ: average value of y from the FARSITE outputs, with the variance of σ2,
z: variance-covariance matrix, with covariance of σ2Rij, and
lk: scale parameters of the GPI.
The average values (μ) of the FARSITE outputs are 863 kW/m2 for the reaction intensity, 227 kW/m for the fireline intensity, and 42.8 hours for the forest fire duration. The scale parameters (lk) of the GPI for the reaction intensity, the fireline intensity, and the forest fire duration are summarized in , which were determined by maximum likelihood estimate method using R software [Citation22] from 192 case FARSITE outputs. Root mean squared errors for the 192 cases between the estimated values by the GPI and the output values by the FARSITE simulations are ±32 (kW/m2) for the reaction intensity, ±17 (kW/m) for the fireline intensity, and ±2.6 (hours) for the forest fire duration.
Table 2. Gaussian process interpolation parameters for response surfaces of reaction intensity, fireline intensity, and forest fire duration.
3.3. Monte Carlo simulation and annual exceedance frequency calculation
3.3.1. Logic tree simplification
Based on the analyses above, the logic tree was simplified as shown in which includes (A) Monte Carlo sampling, (B) forest fire arrival, and (C) forest fire intensity domains. For the (A), the annual average breakout frequency of a forest fire, probability on forest fire breakout point, and joint appearance probability of PWS and RH are randomly given as a Monte Carlo sample according to EquationEquations (1)(1)
(1) , (Equation2
(2)
(2) ), (Equation5
(5)
(5) ), respectively. A continuous uniform distribution is assumed for the probability density function of the forest fire arrival time in day. For the (B), forest fire duration (Tarv) is estimated to the sample condition using EquationEquations (6)
(6)
(6) and (Equation7
(7)
(7) ). Then, the probability of the forest fire arrival (Parv) is estimated from Tarv using EquationEquation (4)
(4)
(4) . For the (C), the reaction intensity and the fireline intensity of the sample condition are estimated by EquationEquations (6)
(6)
(6) and (Equation7
(7)
(7) ). The estimated Parv is utilized for weighted function in the Monte Carlo simulation.
Figure 9. Simplified logic tree for a forest fire hazard curve evaluation of the location studied.
3.3.2. Monte Carlo simulation and hazard curve evaluation
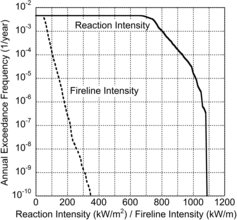
The hazard curve is therefore evaluated as shown in by summarizing a number of samples by the Monte Carlo simulation. The hazard curve of the reaction intensity is that the AEF is about 1×10⁻³ per year for 800 kW/m2 and about 1×10⁻⁶ per year for 1050 kW/m2. The hazard curve of the reaction intensity below around 600 kW/m2 is constant around 5×10⁻³ per year and the upper limit of the reaction intensity is around 1100 kW/m2; these correspond to the variable range of the reaction intensity. The hazard curve of the fireline intensity is that the AEF is about 1×10⁻⁴ per year for 100 kW/m and about 1×10⁻⁷ per year for 200 kW/m. The hazard curve of the fireline intensity for low-frequency and high-intensity range represents the situation under very high PWS and low RH conditions. Both the hazard curves become around 5×10⁻³ per year when the intensity approaches to zero. This is lower than the annual average breakout frequency (i.e. 0.36 per year) because the forest fire duration for a forest fire propagation from breakout points to the reactor site becomes some hours even under high PWS condition, and this results in a certain probability of the forest fire extinguishment by EquationEquation (3)(3)
(3) and reduces the AEF lower than the annual average breakout frequency.
Figure 10. Hazard curves of the reaction intensity and the fireline intensity of the location studied.
4. Conclusion
As a part of the development of a forest fire risk assessment methodology, the forest fire hazard curve evaluation method based on the logic tree was developed in which the frequency–intensity combination of a forest fire intensity, i.e. reaction intensity and fireline intensity, is incorporated. The developed logic tree consists of the forest fire breakout and spread conditions, the weather conditions, the vegetation conditions, and the forest fire simulation conditions.
The newly developed method was applied to evaluate hazard curves on the typical location around a sodium-cooled fast reactor in Japan. In order to estimate the intensity as a function of a set of variable parameters, the response surface was evaluated by the interpolation of 192 case outputs from the forest fire propagation simulation using FARSITE. The Monte Carlo simulation was performed for the samples which include sets of variable parameters according to each parameter frequency or probability, and the intensity corresponding to the sample is obtained from the response surface. The AEF is calculated from the histogram of the outputs from the Monte Carlo simulation to evaluate the hazard curves of the reaction intensity and the fireline intensity.
The new method for a quantitative evaluation of a hazard curve of a forest fire developed in this study can be applied on a forest fire around NPPs and related facilities other than the location studied, with taking into account their specific weather, vegetation, and topographical conditions, and the new method might contribute to a standardization of a risk assessment of a forest fire. There are several conservative assumptions in this study mainly due to lack of the data, and future work for increasing the accuracy of the hazard curves of the location studied is recognized especially on a survey and a statistical analysis of the vegetation data ranges. Sensitivity analysis on the assumed conditions on the logic boxes (e.g. effect by flying sparks) is future work as well.
Acknowledgements
The authors wish to thank Mr K. Naruto of NESI Inc. for a contribution on a forest fire data analysis, Mr T. Inoue and Mr J. Masuzawa of Mitsubishi Research Institute, Inc. on a weather data analysis and forest fire simulations, and Mr K. Yamashita of the Forest Fire Control Association and Mr Y. Goto of the Forestry and Forest Products Research Institute for general advices related to a forest fire and forestry.
This study is the result from “Research and Development of Margin Assessment Methodology of Decay Heat Removal Function against External Hazards” entrusted to Japan Atomic Energy Agency by the Ministry of Education, Sports, Science and Technology (MEXT) under Grant System/120802.
Disclosure statement
No potential conflict of interest was reported by the authors.
References
- Chikazawa Y, Enuma Y, Kisohara N, et al. Evaluation of earthquake and tsunami on JSFR. In: Proceeding of 2012 International Congress on Advances in Nuclear Power Plant; 2012 Jun 24–28; Chicago (IL). La Grange Park (IL): American Nuclear Society; 2012. Paper No. 12384. [CD-ROM].
- Nuclear Regulation Authority (NRA). Guide for assessment on external fire accidents (draft) [ in Japanese]. Tokyo: NRA; 2013.
- Finney MA. FARSITE: fire area simulator – model development and evaluation. Ogden (UT): Rocky Mountain Research Station; 2004. [ RMRS-RP-4 Revised ].
- Braun WJ, Jones BL, Lee JSW, et al.Forest fire risk assessment: an illustrative example from Ontario, Canada. J Probability Stat. 2010. Article ID 823018. Available from: http://dx.doi.org/10.1155/2010/823018.
- Preisler HK, Brillinger DR, Burgan RE, et al. Probability based models for estimation of wildfire risk. Int Wildland Fire. 2004;13:133–142.
- Song W, Wang J, Satoh K, et al.Three types of power-law distribution of forest fire in Japan. Ecological Modelling. 2006;196:527–532.
- Sano T. Forest fire danger prediction in Hiroshima prefecture and experimental investigating of fire spread danger map. In: Proceeding of the 5th International Symposium on Forest Fire Protection (5th NRIFD); 2005 Nov 30–Dec 2; Mitaka. Mitaka (Japan): National Research Institute of Fire and Disaster; 2005; p. 168–181.
- Forest fire control association. Practical guide of managements on forest and field fires [ in Japanese]. Tokyo: Rinya-Kousai-Kai (Japan Forest Foundation); 2007; p. 23–32.
- Okano Y, Yamano H. Development of margin assessment methodology of decay heat removal function against external hazards: (3) Forest fire hazard assessment methodology. In: Proceeding of the NUTHOS10; 2014 Dec 14–18, Ginowan. Ibaraki: Japan Atomic Energy Agency; 2014. Paper No. 1018. [USB memory].
- Okano Y, Yamano H. Forest fire propagation simulations for a risk assessment methodology development for a nuclear power plant. Case Stud Fire Saf. 2015;4:1–10. Available from: http://dx/doi.org/doi:10.1016/j.csfs.2015.05.001.
- Okano Y, Yamano H. Study on forest fire related challenges and development of simplified fragility evaluation method for Sodium-cooled Fast Reactor. In: Proceeding of 8th Japan Conference on Structural Safety and Reliability; 2015 Oct 14–16, Tokyo. Tokyo: Japan Society of Mechanical Engineers: 2015; p. 86–91.
- Wilson AAG. Width of firebreak that is necessary to stop grass fires: some field experiments. Can J Forest Res. 1998;18:682–687.
- Okano Y, Yamano H. Development of risk assessment methodology of decay heat removal function against external hazards for sodium-cooled fast reactors: (3) numerical simulations of forest fire spread and smoke transport as an external hazard assessment methodology development. In: Proceeding of 23rd International Conference on Nuclear Engineering; 2015 May 17–20, Chiba. Tokyo: Japan Society of Mechanical Engineers; 2015. Paper No. 1009. [CD-ROM].
- Division of Crisis Measures and Fire Protection section of Fukui prefecture. Available from: http://www.pref.fukui.lg.jp/doc/kikitaisaku/.
- Japan Meteorological Agency. Available from: http://www.jma.go.jp/jp/amedas/ [in Japanese].
- Satoh K. Human causes affecting forest fire danger rating. In: Proceedings of the 5th NRIFD; 2005 Nov 30–Dec 2; Mitaka. Mitaka: National Research Institute of Fire and Disaster; 2005; p. 91–105.
- Geospatial Information Authority of Japan. Available from: http://www.gsi.go.jp/kiban/ [in Japanese].
- National Land Numerical Information. Available from: http://nlftp.mlit.go.jp/ksj-e/index.html [in Japanese].
- Japan Nuclear Energy Safety Organization (JNES). Wild fire evaluation for Fukushima Daiichi Nuclear Power Plant. Japan: JNES; 2012; p. 44–45. JNES-RC-2012-00020.
- Forest Navigation of Fukui prefecture. Available from: http://morinavi.pref.fukui.jp/map.php.
- Goto Y, Tamai K, Miyama T, et al. Forest fire intensity in Japan: estimation of Byram's fireline intensity using Rothermel's fire spread model. J Jpn Forest Soc. 2005;87:193–201.
- R project. Available from: http://www.r-project.org/.