
 ?Mathematical formulae have been encoded as MathML and are displayed in this HTML version using MathJax in order to improve their display. Uncheck the box to turn MathJax off. This feature requires Javascript. Click on a formula to zoom.
ABSTRACT
The search for an enhanced glass medium to immobilize the sludge at the Fukushima Daiichi Nuclear Power Plant is our main purpose. The iron phosphate glass (IPG) is a potential candidate as we set about assessing it by means of theoretical and experimental investigation. Based on the results of this study, the IPG showed favorable characteristics as a vitrification medium for the sludge.
1. Introduction
The great amount of water used for cooling the stricken reactors at Fukushima Daiichi Nuclear Power Plant following the earthquake and tsunami of 11 March 2011 had resulted in the accumulation of “remaining water (contaminated water)” in some buildings. In the beginning, the decontamination process by AREVA (France) was employed as one of the treatment processes for the contaminated water.
The high-level radioactive elements, mainly caesium (Cs), strontium (Sr) and some other radioactive elements in the water, could be removed by this process. Nevertheless, this treatment has also led to the generation of vast amount of radioactive precipitates (sludge) as a secondary waste. There arises the need to develop an enhanced medium which can cope with a wider variety of substances such as chemical species of alkali metal, platinoid element, molybdenum, etc. Immobilization of the sludge is considered to be one of the measures to alleviate this problem.
For this study, the borosilicate glass (BSG) and the iron phosphate glass (IPG) were chosen as potential vitrification medium for the sludge.
The BSG is a medium commonly used for vitrification of radioactive waste but it has difficulty in loading the sulfur (S) and chlorine (Cl)-bearing substances such as BaSO4, NaCl, etc.
The IPG is a newly developed material which now possesses almost equal or even higher chemical durability than BSG, e.g. the best chemical durability of IPG occurs at an oxygen (O)/phosphorous (P) ratio of 3.6:3.7 and its dissolution rate (DR), which shows approximately 7 × 10⁻⁹ g/cm2/min after 14 days in 90 °C, is lower than that of LD6-54-12 BSG which shows approximately 1 × 10⁻⁸ g /cm2/min after 64 days in 90 °C. Here, LD6-54-12 BSG was made by Pacific Northwest National Laboratory (PNNL) in the USA [Citation1].
Furthermore, the IPG has showed a higher waste-loading capacity than BSG, e.g. the IPG could load up to 50 wt% of waste as compared to less than 30 wt% for BSG.
The IPG system, which is being studied by Fang, et al. [Citation2] and Day, et al. [Citation3], is a promising candidate due to its high-loading capacity for a variety of substances, e.g. fission products, superior chemical stability, water and radiation durability, etc.
Before commencing to evaluate the IPG as a prospective glass medium for the sludge, the appropriate composition and melting temperature should first be grasped by the means of computational method followed by observation and analysis of formed samples after trial manufacturing.
2. Method for the construction of computational phase diagrams
2.1. Calculation of Gibbs energy
2.1.1. Literature review
As the Gibbs energy of each structural element of the IPG system is necessary for constructing the computational phase diagram, literature review was first carried out to obtain the relevant data.
2.1.2. CALPHAD approach
The CALPHAD (Computer Coupling of Phase Diagrams and Thermochemistry) approach, which is also known as the computational thermodynamics, started in the 1970s and is one of the important methods to prepare the Gibbs energy and to construct the equilibrium phase diagram by computer. This approach is now widely used for the calculation and evaluation of the phase diagrams with high accuracy under the condition of the multicomponent systems, various temperatures and/or various pressures. In this approach, the Gibbs energy for each state is inductively estimated as the state variable function by the analysis of the experimental phase diagram, activity data, etc.
For some Gibbs energies which are not made available in literature, they are estimated by the CALPHAD approach.
For a start, several highly reliable experimental phase diagrams were collected. The procedure to estimate the Gibbs energy from the experimental phase diagram is shown as below:
2.1.1.1. Solid oxides
The Gibbs energy of the solid oxides at 298.15 K (G0298.15) can be obtained from EquationEquation (1)(1)
(1) .
(1)
(1) where H0298.15 is the standard molar enthalpy at 298.15 K (J/mol), T is the temperature (K), S0298.15 is the standard molar entropy at 298.15 K (J/K/mol) and
ΔfH0298.15 is the standard molar enthalpy of formation at 298.15 K (J/mol).
In addition, the molar heat capacity at constant pressure (Cp,m (J/K/mol)) of solid oxides can be estimated by Neumann-Kopp rule, i.e. the Cp,m of a solid oxide is approximately equal to the sum of the Cp,m of each constituent of solid oxide as shown in EquationEquation (2)(2)
(2) .
(2)
(2) where N is the sum of constituents of target solid oxide (-), i is the ith constituent (-), Cp,m(i) is the molar heat capacity at constant pressure of the ith (J/K/mol) and xi is the molar fraction of the ith constituent (-).
The Neumann–Kopp rule cannot be necessarily applied for all the substances; for example, some oxides. This being the case, we presented known oxide data of Cp,m which possess similar properties. Meanwhile, the estimation of ΔfH0298.15 and S0298.15 was undertaken together with the calculation of G0298.15 of molten glass (see 2.1.2(b)).
2.1.1.2. Molten glass
As the strong interaction of the interatomic attractive or repulsive force is at work in the molten glass, it can be assumed that the constituents in the molten glass would form the associated species and would be in stable condition. On such supposition, the modified associated species model [Citation4] is used as shown in EquationEquation (3)(3)
(3) which expresses the molar Gibbs energy of molten glass.
(3)
(3) where G is the molar Gibbs energy of molten glass (J/mol), i is the ith constituent (including the associated species) (-), xi is the molar fraction of ith constituent (-), R is the gas constant (8.314472 J/K/mol), G0i is the molar Gibbs energy of the ith pure phase constituent (J/mol) and exG is the molar excess Gibbs energy (J/mol).The molar excess Gibbs energy (exG) can be calculated using EquationEquation (4)
(4)
(4) .
(4)
(4)
(5)
(5) where L(v)ij expresses the term which is dependent on the temperature and can be described by EquationEquation (5)
(5)
(5) . Furthermore, A(v)ij, Bij(v), C(v)ij and D(v)ij are the necessary constants for calculation of the L(v)ij. If the appropriate value of L(v)ij is obtained, a more accurate exG, which is needed to estimate G for the construction of computational phase diagram as shown in EquationEquation (3)
(3)
(3) , can be acquired. The procedure to optimize these constants is as follows:
First of all, the virtual constants of A(v)ij, Bij(v), C(v)ij and D(v)ij as well as ΔfH0298.15 and S0298.15 for solid oxides must be set by selecting moderate values. Then, the temporary computational phase diagram will be constructed by calculating G from the above-mentioned initial constants.
Comparison is made to find the difference between the temporary computational phase diagram and the experimental phase diagram.
The dispersion between the G value of the temporary computational phase diagram and that of the experimental phase diagram must be corrected by changing some values of problematical temporal constants, ΔfH0298.15 and/or S0298.15. The correction should be repeatedly performed until the dispersion of G converges to certain value which will be regarded as the final G value of the Gibbs energy.
2.2. Tool for constructing computational phase diagram
Essentially, for the construction of the phase diagrams, multiple thermodynamic models are required, i.e. the modified associated species model as well as quasi-chemical model.
“FactSage” [Citation5], the Integrated Thermodynamic Databank System, was selected as a tool in our preparation of the diagrams as it provides a rich variety of thermodynamic properties, Gibbs energy (G) of various oxides including phosphorus, in its database. They are immensely useful for chemical equilibrium calculation of the glass systems.
2.3. Systems applied to acquire thermodynamic properties by computation
Preparation of computational phase diagrams of BSG and IPG is one of the many aspects of this research. As the essential thermodynamic properties for constructing BSG phase diagram is incorporated in FactSage as known data [Citation6,Citation7], they were used in this study. On the other hand, the CALPHAD approach was applied to estimate the insufficient Gibbs energy of some components of IPG (Fe2O3-P2O5) system [Citation8,Citation9], FeO-Fe2O3-P2O5 system [Citation9], BaO-Fe2O3-P2O5 system [Citation10], Cs2O-Fe2O3-P2O5 system [Citation11] and SrO-Fe2O3-P2O5 system [Citation12].
3. Results and discussion
3.1. Literature review
Literature survey to acquire the thermodynamic properties of Fe2O3-P2O5 system found only a few papers that showed the experimental phase diagrams [Citation13–16] but as they were mostly incomplete, it was very difficult to estimate the thermodynamic properties based on them.
However, we found Zhang et al. had published a paper [Citation8,Citation9] in 2010–2011 that presented an experimental phase diagram of Fe2O3-P2O5 system under the satisfied chemical compositions and temperatures for CALPHAD approach. We made this paper as the original source of the thermodynamic properties of Fe2O3-P2O5 system.
3.2. Borosilicate glass (BSG)
The liquidus projection ternary phase diagram of Na2O-B2O3-SiO2 system was constructed at a range of 300–2000 K as shown in . Here, Na2O, B2O3 and SiO2 are the main constituents of BSG which is currently the more popular glass medium used to immobilize high-level radioactive waste. In this estimation, various compounds are observed but only the above-mentioned three typical constituents are highlighted here. The Alkemade line was omitted for simplification of this figure.
Figure 1. Computational liquidus projection of SiO2-B2O3-Na2O system at 300–2000 K.
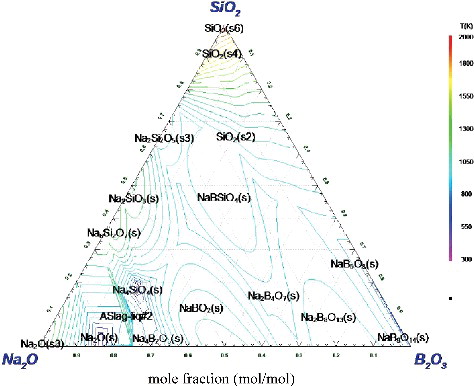
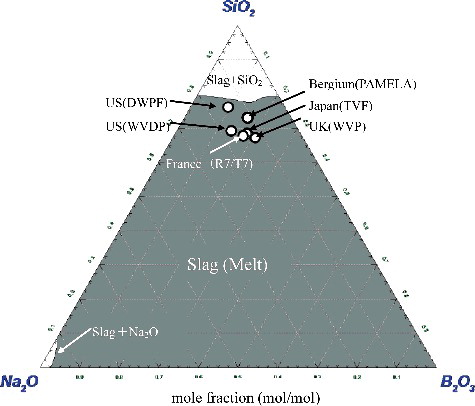
From , it seems that Na2O and B2O3 would form the double salts such as NaBO2 and /or Na2B8O13 which would melt at relatively low temperature, i.e. below 1000 K. Meanwhile, for SiO2, some would remain in solid state without melting as shown in the same figure which was theoretically constructed to observe the phenomenon occurred at 1350 K. In addition, the compositions of BSG mediums from various countries [Citation17] were calculated and results are presented in . From this figure, it is noted that the main constituent of these mediums from various countries is SiO2 whose water solubility is approximately 0.0009 mol/kg at 373 K by the equation of Rimstidt and Barnes [Citation18] and is in the range of 67–77 mol%. Furthermore, these mediums as shown in the dark grey area of can be melted at around 1350 K which can be regarded as a relatively satisfactory mixture ratio of raw materials because, in general, the melting temperature of glass is set between 1373 and 1523 K. However, an excess of 80 mol% of SiO2 would likely reduce it to infusible content.
Figure 2. Computational phase diagram of SiO2-B2O3-Na2O ternary system in air at 1350 K. The grey area refers to the melting area at 1350 K and white circles are the composition ratio of SiO2-B2O3-Na2O for glass medium from various countries.
3.3. Iron phosphate glass (IPG)
In the past, the phosphate glasses were generally known to be lower chemical durable and highly corrosive. However, the IPG, under the development of Day, Brow, et al. of Missouri University of Science and Technology, has made much progress. It now possesses good chemical durability, high waste loading ratio, etc. with at least some performances that are comparable to conventional glass medium [Citation19]. For chemical durability, the 40 mol%Fe2O3-60 mol%P2O5 of IPG shows approximately 1 × 10−09 g/cm2/min at 363 K for seven days or less as the average DR [Citation20] whilst the Japanese waste BSG (P0798) is 1.6 × 10⁻⁸ g/cm2/min (2.3 × 10⁻⁴ kg/m2/d) [Citation17] For such reasons, the IPG has the potential to be regarded as a worthy waste immobilization medium in years to come. In this paper, theoretical consideration was first undertaken to ascertain the appropriate composition of IPG, melting temperature of raw materials etc. Also, the waste loading into the IPG melt was estimated by using some oxides such as Cs2O, BaO or SrO as constituents of the waste. For BaO, the theoretical data were compared with experimental results.
3.3.1. Phase diagram of Fe2O3-P2O5 system
3.3.1.1. Comparison with experimental results
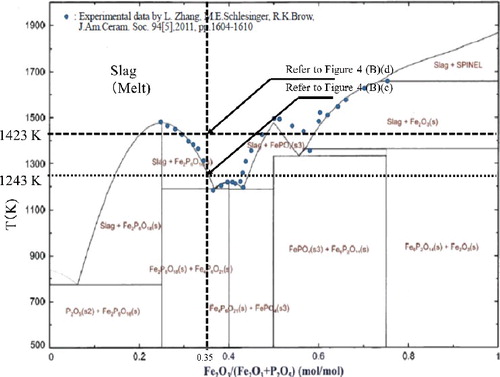
The binary phase diagram of Fe2O3-P2O5 system which was constructed with the Gibbs energy obtained from CALPHAD approach is shown in . This figure was described at an atmospheric pressure with 21.2 kPa of oxygen partial pressure (P(O2) = 21.2 kPa). The experimental results of Zhang et al. [Citation9] are used in this figure as a reference (Refer to for the circle marks). Comparison of computational diagram with experimental results showed good consistency at 25–43 mol% and at above 58 mol% of Fe2O3 ratio in the mixture of Fe2O3 and P2O5. In the case of 43 to 58 mol%, however, a difference could be observed, i.e. computational result presented a sharp peak whilst experimental presented a much broader peak. In this study, the stable Fe2O3 composition to form the IPG is between 30 and 40 mol% [Citation21]. The computational phase diagram constructed in can be used to determine the manufacturing condition of IPG under different atmosphere and/or pressure.
Figure 3. Computational phase diagram of Fe2O3-P2O5 system in air.
The hot-thermocouple (assembled by Ehime University) shown in A) was used to verify the accuracy of the computational phase diagram of Fe2O3-P2O5. The 0.2–0.5 mg of sample was placed on a self-heating thermocouple which is microscope-equipped and its temperature was gradually raised to observe the transition behavior of sample at different temperatures. For this experiment, the mixture of Fe2O3 (KISHIDA CHEMICAL Co., Ltd., Japan, Purity:98%) and NH4H2PO4 (WAKO Pure Chemical Industries, Ltd., Japan, JIS Special Grade) was used as a sample which was prepared to form the 35 mol%Fe2O3-65 mol%P2O5 glass, known to be the most chemical durable IPG composition [Citation2].
Figure 4. Schematic diagram of the hot-thermocouple cell used for observing the IPG forming process and experimental result.
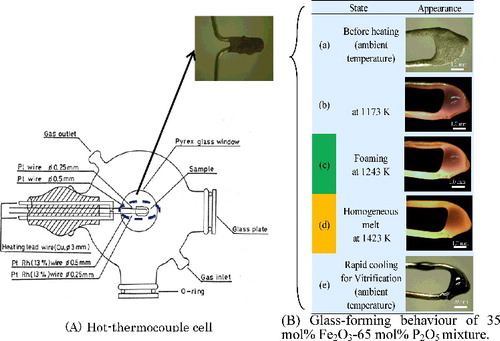
From the observing result, the sample started to foam at around 1243 K (refer to B)(c)) and formed the homogeneous melt at around 1423 K (refer to B)(d)).
The mixture of 35 mol%Fe2O3-65 mol%P2O5 began to transform from solid to liquid state at around 1243 K and it presented the liquid phase perfectly at around 1423 K as shown in (B)(c). The phenomena shown in is in good agreement with the experimental result and can be explained by the computational phase diagram shown in
3.3.1.2. Effect of oxygen potential
Two oxygen potentials i.e. P(O2) = 1.01 Pa and P(O2) = 0.101 MPa were set to estimate the effect of oxygen potential on the Fe2O3-P2O5 system and to construct the computational phase diagrams shown in (A) and 5(B). Judging from these figures and (P(O2) = 21.2 kPa), the temperature range of slag (melt) formation was shifted to higher side with a drop in the oxygen potential at above 50% of abundance ratio of Fe2O3. Meanwhile, as the formation range of mixture of iron oxides and slag is likely to expand at the above-mentioned condition, the melting condition of raw material of glass would preferably be on the lower oxygen potential side.
Figure 5. Computational phase diagrams of Fe2O3-P2O5 system at different partial pressures of oxygen. The grey area refers to the melting area.

3.3.2. Phase diagram of FeO-Fe2O3-P2O5 system
Ferric oxide (Fe2O3) and H3PO4 or NH4H2PO4 are the common raw materials of IPG. Among them, Fe2O3 is easily reduced to the FeO state by heating at the melting process.
The Moessbauer spectrometer (Laboratory Equipment Corp., Japan) was employed to determine the relative abundance of ferrous ion in the IPG. The 57Fe Moessbauer spectrometry method is to obtain information on the properties of target element through the state of atomic nucleus and to observe the recoil-free resonant absorption of 57Fe atomic nucleus by the gamma ray emitted from the standard radiation source of 57Co which is the parent nucleus of 57Fe. In this case, the 57Fe Moessbauer spectrum was measured to acquire the iron valences and their relative abundance. The curve-fitting of absorption line to the acquired spectrum was made by the Lorentzian function. Then, the relative abundance of Fe2+ as (Fe2+/(Fe2++Fe3+)) was calculated by the absorption area intensity ratio as one of the Moessbauer parameters as well as their valences by the isomeric shift and the quadrupole splitting between ferrous ion and ferric ion as other parameters. The Moessbauer measurement was carried out under the condition of ±6 mm/s of the Doppler velocity at ambient temperature and 15–20 mg-Fe/cm2 of thickness for each of the test samples.
The abundance ratio of FeO increased after melting of the raw materials is shown in . It was found that there is a correlation between the abundance ratio of ferrous ion and the manufacturing temperature of IPG from the XANES analysis. As such, the relative quantitative analysis of ferrous ion in the IPG is necessary to confirm its FP sorption effect.
Figure 6. Relative abundance of Fe2+as Fe2+/(Fe2++Fe3+) in the IPG.
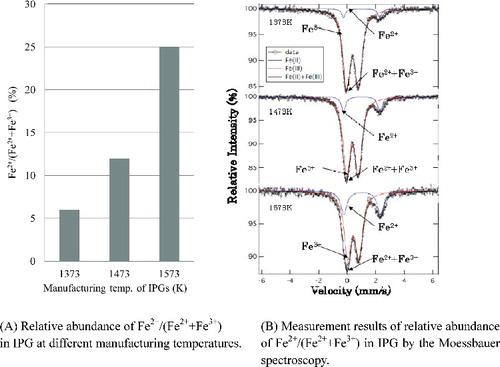
From this result, it was found that the abundance ratio of FeO increased with the rise of melting temperature. Accordingly, it is necessary to take into consideration the effect of FeO on glass formation.
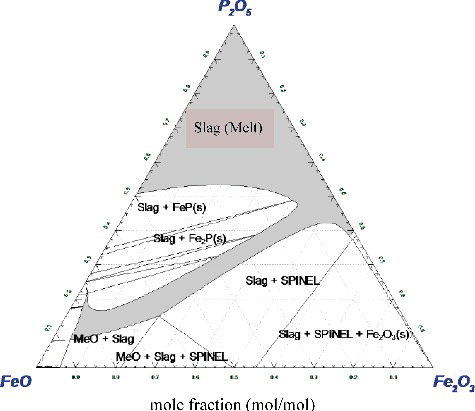
The estimated calculation result for the FeO-Fe2O3-P2O5 system at 1500 K and atmospheric pressure is shown in . From this figure, it is apparent that the raw material can be melted at 1500 K without the need for due consideration to the composition ratio of FeO or Fe2O3 when the composition ratio of P2O5 is above 50 mol%. Based on research study, the appropriate composition ratio of P2O5 would be between 60 to 70 mol%, and the homogeneous melt would likely to form within this range regardless of the abundance ratio of FeO and Fe2O3.
Figure 7. Computational phase diagram of FeO-Fe2O3-P2O5 system at 1500 K in 101 kPa. The grey area refers to the melting area.at1500 K.
3.3.3. Phase diagrams of IPG waste forms
Previous studies have shown IPG to possess a high loading capacity for a variety of waste elements and it may be possible to make it into a stable waste form [Citation22] to immobilize the radioactive sludge containing CsO, SrO, etc. from the Fukushima Daiichi Nuclear Power Plant. In our research, based on the literature review [Citation23], the main constituents of sludge are assumed to be BaSO4, SrSO4, and CsCl, etc. Appropriate mixing ratio of constituents of sludge and IPG (Fe2O3-P2O5) medium was investigated after constructing the computational phase diagram of Fe2O3-P2O5 and sludge constituent. It was assumed that all chemical forms of constituents of sludge were oxides due to the possibility of chemical conversion to oxides under high melting temperature.
3.3.3.1. BaO-Fe2O3-P2O5 system
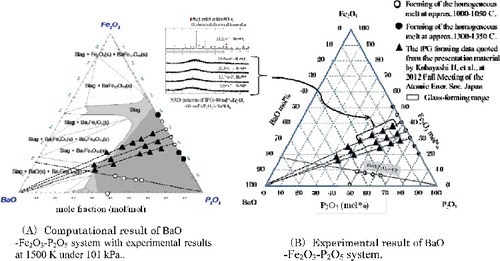
A) shows the computational result of IPG-BaO system at 1500 K in air and the observing result of melting behavior of IPG-BaO mixture in B) with the hot thermocouple as shown in “3.3.1 Phase diagram of Fe2O3-P2O5 system”. Comparison result of both figures shows a similar consistency of the glass-forming region. Furthermore, from A), the maximum BaO loading is around 40 mol% when the P2O5 composition in IPG is 50 mol% indicating a higher loading ability for BaO. According to the experimental result by Bingham PA, et al. [Citation24], 42.3 mol% of BaO was loaded in IPG and BaO-bearing IPG showed the greatest improvement of its chemical durability. Meanwhile, for Cs2O, 100 mol% can be loaded into the IPG in a wider region than BaO and SrO when the Fe2O3 is under 30 mol%. From a practical viewpoint, the appropriate composition of IPG waste form is dependent on the glass forming region of Cs2O-Fe2O3-P2O5 system. By literature of Joseph, et al. [Citation25], 36 mol% of caesium could be successfully loaded in the IPG while still retaining its good glass stability.
Figure 8. Phase diagrams of BaO-Fe2O3-P2O5 system for the comparison of experimental and calculated results.
3.3.3.2. SrO-Fe2O3-P2O5 system and Cs2O-Fe2O3-P2O5 system
An important aspect of this research is to understand the immobilization condition of Sr and Cs which are the main radioactive elements in the sludge. Based on the calculated phase diagram, SrO can be melted at almost the same region as BaO in air at 1500 K (see A) and 9(B)).
Figure 9. Calculated phase diagrams for the immobilization of radioactive substances in sludge at Fukushima Daiichi Nuclear Power Plant. The grey area refers to the melting area at 1500 K.
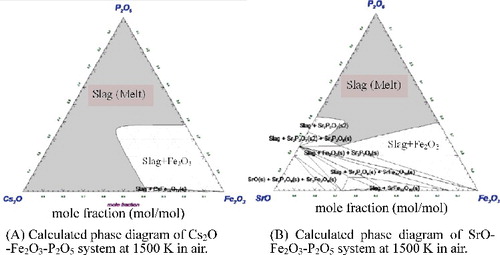
In the case of SrO-bearing phosphate glass, its DR was approximately 3.63 × 10⁻⁷ g/cm2/min at 50 mol% SrO-50 mol% P2O5 system.
4. Conclusion
The search for enhanced glass mediums to immobilize the radioactive sludge was first undertaken by computational means. The loading capacities into the glass mediums were estimated from the binary or ternary phase diagrams which were constructed from the thermodynamic viewpoint. For BSG, it was relatively easy to construct its phase diagram due to sufficient thermodynamic properties obtained from various sources. However, for the newly selected glass medium, IPG, there is still a lack of comprehensive thermodynamic data. Fortunately, some experimental phase diagrams of phosphates exist and together with the application of the CALPHAD approach, we proceeded to construct the phase diagrams of Fe2O3-P2O5 system FeO-Fe2O3-P2O5 system, Cs2O-Fe2O3- P2O5 system, SrO-Fe2O3-P2O5 system and BaO-Fe2O3-P2O5 system. The computational phase diagrams were found to be in good agreement with experimental results and they have helped to reduce the number of experiments. The information obtained from this research study will be useful in the process of selecting an appropriate glass medium for the sludge.
| Nomenclature | ||
| Cp,m: | = | the molar heat capacity at constant pressure (J/K/mol) |
| G: | = | the molar Gibbs energy of molten glass (J/mol) |
| G0i: | = | the molar Gibbs energy of the ith pure phase constituent (J/mol) |
| exG: | = | the molar excess Gibbs energy (J/mol) |
| H0298.15: | = | the standard molar enthalpy at 298.15 K (J/mol) |
| ΔfH0298.15: | = | the standard molar enthalpy of formation at 298.15 K (J/mol) |
| R: | = | the gas constant (8.314472 J/K /mol) |
| S0298.15: | = | the standard molar entropy at 298.15 K (J/K/mol) |
| T: | = | temperature (K) |
Acknowledgments
This paper includes the results of “Technical investigation on the conceptual construction of processing and disposal of radioactive waste due to accidents at nuclear power plants” entrusted to Japan Atomic Energy Agency by the Agency for Natural Resources and Energy, Japan.
Disclosure statement
No potential conflict of interest was reported by the authors.
References
- Ebert WL, Bakel AJ, Brown NR. Measurement of the glass dissolution rate in the presence of alternation phases. SPECTRUM ’96. International Conference on Nuclear and Hazardous Waste Management; 1996 Aug 18–23; Seattle (WA).
- Fang XY, Day DE, Long G, et al. Properties and structure of sodium-iron phosphate glasses. J Non Cryst Solids. 1997;215:21–31.
- Day DE, Wu Z, Ray CS, et al. Chemically durable iron phosphate glass wasteforms. J Non Cryst Solids. 1998;241:1–12.
- Besmann TM, Spear KE. Thermochemical modeling of oxide glasses. J Am Ceram Soc. 2002;85(12):2887–2894.
- Bale CW, Chartrand P, Decterov SA, et al. FactSage thermochemical software and databases. Calphad. 2002;62:189–228.
- Decterov SA, Swamy V, Jung IH. Thermodynamic modeling of the B2O3-SiO2 and B2O3-Al2O3 systems. Inter J Mat Res. 2007;98(10):987–994.
- Swamy V, Jung IH, Decterov SA. Thermodynamic modeling of the Al2O3-B2O3-SiO2 system. J Non Cryst Solids. 2009;355(34–36):1679–1686.
- Zhang L, Schlesinger ME, Brow RK. Phase equilibria in the Fe2O3-P2O5 system. J Am Ceram Soc. 2011;94(5):1605–1610.
- Zhang L. Phase equilibria in iron phosphate system [doctoral dissertation]: Missouri University of Science and Technology; 2010.
- Bingham PA, Barney ER. Structure of iron phosphate glasses modified by alkali and alkaline earth additions: neutron and x-ray diffraction studies. J Phys Condens Matter 2012;24:175403.
- Lindemer TB, Besmann TM, Johnson CE. Thermodynamic review and calculations – alkali-metal oxide systems with nuclear fuels, fission products, and structural materials. J Nucl Mater. 1981;100(1–3):178–226.
- Rakshit SK, Parida SC, Dash S, et al. Thermodynamic studies on SrFe12O19(s), SrFe2O4(s), Sr2Fe2O5(s) and Sr3Fe2O6(s). J Solid State Chem. 2007;180(2):523–532.
- Wentrup H. System 2FeO EPO-2FeO E3PO. Arch Eisenhuettenwes. 1935;9(1):57–60.
- Sridharan R, Gnanasekaran T, Mathews CK. Phase equilibrium studies in the Na-Fe-O system. J Alloys Compd. 1993;191(1):9–13.
- Oelsen W, Maetz H. System Na2O-FeO-P2O5. Arch Eisenhuettenwes. 1948;1(9):111–117.
- Troemel G, Schwerdtfeger K. System FeO-P2O5 in contact with Fe containing a small amount of P in solid solution. Content of Fe2O3 is less than 10% and decreases with increasing P2O5 and temperature. Arch Eisenhuettenwes. 1963;34(1):55–59.
- Inagaki Y, Mitsui S, Makino H, et al. [Status of studies on HLW glass performance for confirming its validity in assessment]. J Nucl Fuel Cycle Environ. 2004;10(1–2):69–84. Japanese.
- Rimstidt JD, Barnes HL. The kinetics of silica-water reactions. Geochimica et Cosmochimica Acta 1980;44:1683–1699.
- Yu X, Day DE, Long GJ, et al. Properties and structure of sodium-iron phosphate glasses. J Non Cryst Solids. 1997;215:21–31.
- Fukui T, Ishinomori T, Endo Y. Iron phosphate glass as potential waste matrix for high-level radioactive waste. WM'03 Conference; 2003 Feb. 23–27; Tucson, AZ.
- Sevingny GJ, Kimura ML, Fischer CM, et al. Ion phosphate glass-containing hanford waste simulant. Pacific Northwest National Laboratory; 2012. PNNL-20670, Rev.1.
- Day DE, Ray CS, Kim CW, et al. Iron phosphate glasses: an alternative for vitrifying certain nuclear wastes. University of Missouri-Rolla; 2003. (Annual Report for DOE DE FG07-96ER45618).
- Prevost T, Blase M. Areva's Acttiflo-Rad water treatment system for the Fukushima nuclear power plant. Inte J Nucl Power. 2012;57(5):308–301.
- Bingham PA, Barney ER. Structure of iron phosphate glasses modified by alkali and alkaline earth additions: neutron and X-ray diffraction studies. J Phys Condens Matter. 2012;24:175403( 13pp).
- Joseph K, Ghosh S, Kutty KVG, et al. Crystallization kinetics, stability and glass forming ability of iron phosphate and cesium loaded iron phosphate glasses. J Nucl Mat. 2012;426:233–239.