
 ?Mathematical formulae have been encoded as MathML and are displayed in this HTML version using MathJax in order to improve their display. Uncheck the box to turn MathJax off. This feature requires Javascript. Click on a formula to zoom.
ABSTRACT
A simple and fast method of nuclear material accountancy of pressurized water reactor (PWR) UO2 spent fuel rods for safeguards application was developed utilizing the isotope correlation between the amounts of 137Cs and total Pu. To this end, the following steps were taken: (1) as much destructive analysis (DA) data as possible for segments taken from a PWR UO2 spent fuel rod were aggregated from publicly available data sources; (2) the DA data were corrected so as to have the same cooling time (i.e., CT = 0 y) and analyzed for outliers; (3) an equation converting the 137Cs amount to the Pu amount was obtained by regression analysis with logarithmic curve fitting; and (4) the error in determining the Pu amount was evaluated for the imposition of a limit on the range of burnup (BU) or initial enrichment (IE). It was found that the averaged % error in calibration was determined to be 3.88% ± 2.68% (= mean ± 1 standard deviation) for the BU range over 30 GWd/tU and falling with increasing BU range. On the other hand, there was no benefit in applying the limit of the IE range. Lastly, the Pu-mass difference between various methods was compared and it was found that the difference can be incurred up to 11.4%, according to the choice of method. In conclusion, the proposed isotope correlation technique could be used for input material accountancy with reasonable uncertainty.
1. Introduction
Pu mass measurement for a spent fuel assembly has been of great interest in many areas such as interim storage, transportation, repository, and reprocessing. The current strategy for Pu mass estimation in an assembly heavily relies on code calculation, and is generally considered to be subject to large uncertainty. In order to overcome this limitation and verify Pu mass independently, many efforts have been devoted to the development of a direct Pu mass measurement technique that utilizes a combination of non-destructive assay (NDA) techniques [Citation1]. Direct Pu measurement requires the addressing of many scientific and practical engineering challenges, given the complex nature of a spent fuel assembly in terms of isotopic composition, burnup (BU) gradient in the axial and planar directions, and, not least, the huge amounts of radiation. Such measurement ideally should be independent of operator-declared data. Similar challenges on Pu mass measurement in a spent fuel assembly are confronted in a pyroprocessing facility [Citation2–4], i.e., input material accountancy. For a future pyroprocessing facility, one can consider the following measurement point options: (Equation1(1)
(1) ) spent fuel assembly, (Equation2
(2)
(2) ) spent fuel rod, (Equation3
(3)
(3) ) mechanically crushed fragment, or (4) homogenized powder after oxidation process. Some efforts were devoted to a spent fuel assembly in a previous study [Citation5]. In this study, a method of input material accountancy for spent fuel rods was investigated.
Many methods of nuclear material accountancy for spent fuel rods also rely on the BU code calculation (e.g., ORIGEN-ARP [Citation6]), which incurs uncertainty in isotopic composition, roughly 5% for Pu and a few tens of % for transuranic elements such as Np and Cm [Citation7–9]. Additionally to this code uncertainty, the parameters required for calculation as inputs (e.g., total BU or specific power for each cycle) also include certain degrees of uncertainty, which resulting in increased uncertainty in Pu mass analysis. It is known that the accuracy of BU for a rod determined from the absolute 137Cs activity could be from 1% to 4% [Citation10]. Also, there is a requirement to verify the operator-declared data (i.e., BU, initial enrichment (IE), and cooling time) in terms of IAEA safeguards. In order to minimize these BU code and operator-declared data dependencies in Pu mass analysis for spent fuel rods, we investigated the correlation between the isotope amounts of 137Cs and Pu using the isotope correlation technique (ICT) [Citation11,Citation12]. We concentrated our efforts on, as the first step, the determination of the correlation between the amounts of 137Cs and Pu, because plutonium is the most important element from the safeguards perspective. Notably, the same methodology can be used to determine the correlation between other elements/isotopes (e.g., 137Cs and 235U or 244Cm).
2. Isotope correlation technique (ICT)
2.1. Application of ICT to spent fuel rod
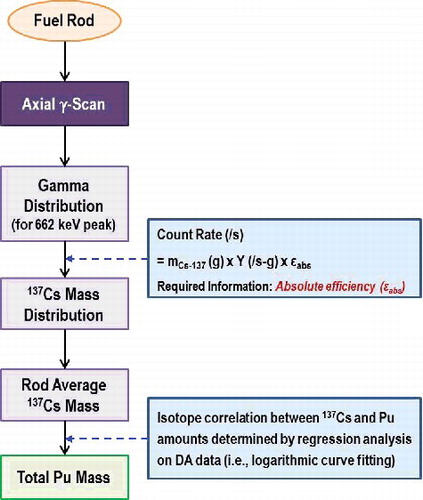
Once the isotope correlation between the amounts of 137Cs and Pu in spent fuel is found, the ICT can be applied to determine the total Pu amount using the axial gamma-scan data for the 662 keV peak. The amount of 137Cs is a good indicator of others because (Equation1(1)
(1) ) it shows excellent linearity with BU for cooling time (CT) > 1 y, (Equation2
(2)
(2) ) it is one of the major gamma emitters in spent fuel, which fact enables ready measurement of its gamma rays, (Equation3
(3)
(3) ) it has a relatively long half-life (∼30 y), which allows application to spent fuel having a long cooling time, and (4) its gamma-ray energy (662 keV), which is not too low (good signal-to-noise ratio) and not too high (moderate detection efficiency), is appropriate for measurement.
shows the ICT application procedure for a spent fuel rod. The first step is to measure the axial gamma profile for the rod [Citation13], which is important, because a spent fuel rod has a certain BU distribution due to (Equation1(1)
(1) ) the non-uniform neutron flux in the axial direction of a reactor core, (Equation2
(2)
(2) ) blanket materials (usually, natural uranium pellets) for both ends, and (Equation3
(3)
(3) ) the structural materials of an assembly (e.g., grids and supports). The second step is to convert the 662 keV gamma profile to a 137Cs mass distribution using the equation
(1)
(1) where mCs-137 is the 137Cs mass in g, Y is the gamma-ray emission yield per second and per gram of 137Cs, and ϵabs is the absolute detection efficiency of a gamma-scanning system for 662 keV gamma rays. The third step is to calculate, from the 137Cs mass distribution, the rod-average 137Cs mass, by simply averaging the mass at each location. The final step is to calculate the total Pu mass according to the pre-determined conversion equation for the 137Cs / Pu correlation.
Figure 1. Procedure for determining Pu mass using ICT and axial gamma-scan data on spent fuel rod.
This method can be extended to a spent fuel assembly under the assumption that every fuel rod has the same BU distribution in the axial direction [Citation14]. Following this assumption, a full gamma scan of the rod is not mandatory or necessary; rather, a few points of gamma-ray measurement for each rod in an assembly are sufficient to normalize the axial distribution to the measured points for the rod. In summary, the main objective of the ICT is to determine the total Pu mass (and other isotopes/elements of interest) with less uncertainty than when using the BU code.
2.2. Dependency of isotope amounts on burnup, initial enrichment, and cooling time
In this study, in order to obtain an initial idea of the dependency of isotope amounts on BU, IE and CT, ORIGEN-ARP calculations were performed. The amounts of 137Cs and Pu were calculated and compared as a function of the BU with different IE (from 2 to 5.5 wt.%) and CT (from 1 to 20 y), as shown in . The considered IE, CT, and BU ranges were determined to cover a wide range of possible conditions. The reference conditions were 4.5 wt.% of IE, 10 years of CT, 1.5 years of irradiation/cycle, 3 cycles of irradiation, 50 days of cooling time between cycles, and 17 × 17 fuel type.
Figure 2. Calculated amounts of 137Cs and Pu as functions of BU with (a) and (b) different IEs (2, 3, 4.5, and 5.5 wt.%), and (c) and (d) different cooling times (1, 5, 10, and 20 y).
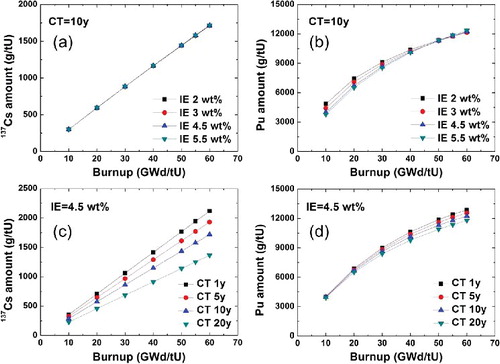
In the results, the 137Cs amount showed a good linear correlation with the BU ((a)), as expected [Citation15], and there was no dependency on the IE. The total Pu amount showed a logarithmic correlation with the BU. The correlation between each of Pu isotopes and the BU is shown in [Citation16]. In general, the dependency on the IE was reduced with increasing BU (see (b)). The Pu amount in the lower IE case was determined to be larger than that in the higher IE case for a lower range of BU (from 10 to 40 GWd/tU), which difference was decreased for the higher range of BU (>50 GWd/tU). This was due mainly to the fact that in the lower IE case, (Equation1(1)
(1) ) the mass fraction of 238U is larger, resulting in an increased probability of production of 239Pu and other Pu isotopes, and (Equation2
(2)
(2) ) the fission fraction of 239Pu and 241Pu is small compared with that of 235U which depends on the BU and IE (e.g., in the case of 2.5 wt.% IE, the fission fraction of 239Pu becomes larger than that of 235U above 15–20 GWd/tU BU [Citation17]). It is worthwhile to note that the variation of the coolant density and boron concentration along the axial direction of a fuel rod will alter the neutron energy spectrum, resulting in the axial BU variation of the fuel rod. Because the proposed ICT is based on the axial gamma scan for a fuel rod to measure the BU distribution, it is expected that these effects on the 137Cs and total Pu amounts can be mitigated.
In the different CT cases ((c) and 2(d)), the amounts of 137Cs and Pu were all decreased with increased CT. The half-life (T1/2) of 137Cs is 30.08 y. 238Pu (T1/2 = 87.7 y) and 241Pu (T1/2 = 14.35 y) are the major isotopes showing CT dependency, and the fractions of these isotopes are increased with the BU [Citation18]. As a result, with increasing BU, the dependency on the CT becomes larger ((d)). The CT information, the duration after discharge from a reactor, is relatively easy to verify compared with the BU information; hence, it can be effectively used to correct the measured data. It is worthwhile to note that the variation of irradiation histories, e.g., (Equation1(1)
(1) ) the duration of irradiation for each cycle, (Equation2
(2)
(2) ) the total number of cycles, and (Equation3
(3)
(3) ) the CT between the cycles due to the scheduled overhaul or unexpected shutdown should influence the final amounts of 137Cs and Pu; hence, it is a factor increasing the error of the ICT.
2.3. Collection of destructive analysis data
As much destructive analysis (DA) data as possible for segments taken from a pressurized water reactor (PWR) UO2 spent fuel rod were collected from publicly available data sources (i.e., research papers, reports, and the OECD/NEA database) [Citation7–9,Citation19–25]. DA data was collected only for PWR UO2 spent nuclear fuel. Some DA data from the Bugey 3, Fessenheim II, and Gravelines reactors [Citation26] and Malibu Program [Citation27] were not publicly available, and so could not be utilized in this study. There were more data available for PWR MOX fuel, BWR, and CANDU-type reactors. A total of 129 DA data-sets finally were collected, 99 of which contained results on 137Cs amounts as well as actinides and BU values. lists the information in the collected DA data. Indeed, the collected DA data-sets covered wide ranges of BU (from 7.2 to 59.7 GWd/tU), IE (from 2.453 to 4.657 wt.%) and assembly types (from 14 × 14 to 18 × 18). In general, the estimated uncertainties of the data were 0.3%–5.8% for 239Pu and 1.5%–6.4% for 137Cs, according to the analysis method and procedure (isotopic dilution mass spectrometry, inductively coupled plasma-mass spectrometry, thermal ionization mass spectrometry, or gamma spectroscopy for 137Cs) [Citation7].
Table 1. Information on collected DA data in this study.
2.4. Conversion equation for Pu mass
In order to estimate the quality of the DA data, the general trend was first investigated using all of the collected DA data. To that end, the DA data was corrected for the same cooling time (CT = 0 y) to eliminate dependency on the CT. shows the DA data distributions for the amounts of 137Cs, Pu and of each isotope/element as functions of the BU. The 137Cs amount showed a good linear correlation with the BU. The total Pu amount showed a logarithmic correlation with the BU (or 137Cs amount). From this distribution, the equation, which converts the 137Cs amount or BU into the total Pu amount, was obtained by regression analysis with logarithmic curve fitting. Then, the % error was evaluated for each data point using the equation
(2)
(2)
Figure 3. Distribution of DA data between (a) BU and 137Cs amount, (b) BU and total Pu amount, and (c) 137Cs amount and total Pu amount. The coefficients of determination (denoted by R2) showing the goodness of fit were ranged from 0.896 to 0.989.
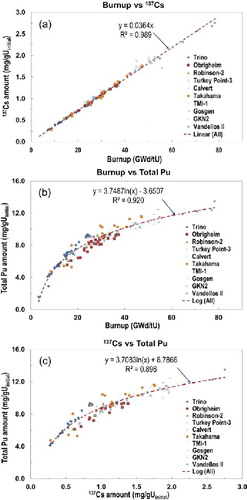
The averaged % error was determined to be 6.18% ± 6.21% and 6.13% ± 5.52% (= mean ± 1 standard deviation) when using the distribution between the BU and Pu amounts and that between the 137Cs and Pu amounts, respectively. Note that the collected DA data has own uncertainty in the 137Cs and total Pu amounts as mentioned in Section 2.3. This DA uncertainty on each data point determines the correctness of the calibration curve. As a result, the % error should be considered as a calibration error that does not include the DA uncertainty.
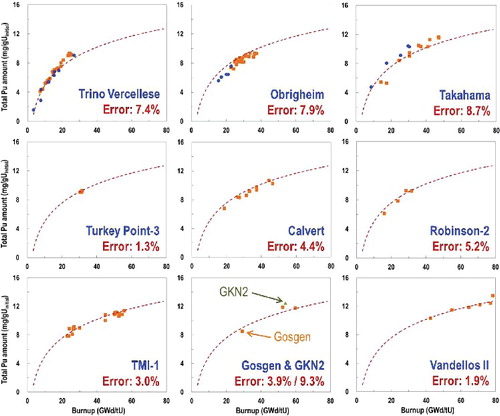
shows the DA data distribution between the BU and total Pu amounts for each reactor, with the fitted curve from which the outlier data points were identified and investigated. In the case of Trino Vercellese, some DA data taken from SFCOMPO [Citation24] showed a large error. In fact, eight DA data for segments taken from rod A1 from the 509-049 assembly, rod Q15 from the 509-032 assembly, rod A12 from the 509-104 assembly, and rod A1 from the 509-069 assembly also were not used in another study [Citation8]. No explanation was made in the reference but the possible reason could be incomplete information on the reactor operation or the DA method/procedure/uncertainty. Those eight DA data were eliminated in our analysis too. In the case of Obrigheim, the DA data for the segments taken from the P1 location (near the bottom) showed a consistent discrepancy from the cross-check data from another laboratory due to the large BU gradient [Citation8]; thus, these five data also were excluded from this study. In the case of Takahama 3, the five DA data were related to the burnable poison with the IE of 2.6 wt.% and a Gd2O3 content of 6% (SF-96 rod), and so these were excluded in order to evaluate the isotope correlation for a general UO2 fuel rod. Overall, a total of 18 DA data-sets were excluded from the present analysis.
Figure 4. Distributions of DA data between BU and total Pu amount for each reactor. The DA data excluded in this study were shown in circles for Trino Vercellese, Obrigheim, and Takahama reactors.
After the 18 DA data-sets were excluded, the conversion equation was obtained again using regression analysis with logarithmic curve fitting. summarizes the averaged % error for each reactor before and after elimination of the 18 DA data-sets. It shows that the overall % error was reduced from 6.18% to 5.07% when using the correlation between the BU and total Pu amount. In the case of the correlation between the amounts of 137Cs and Pu, the overall % error was reduced from 6.13% to 5.52%. The final conversion equation between the amounts of 137Cs and Pu was determined to be
(3)
(3)
Table 2. Averaged % error for each reactor before and after eliminating 18 DA data-set.
3. Performance evaluation
3.1. Imposition of limit on range of BU or IE
In an investigation of the dependency of the isotope correlation on the BU or IE range, the DA data were analyzed separately for each BU and IE group. plots the DA data distribution of the 137Cs versus Pu amounts for 6 BU groups (i.e., <10, 10–20, 20–30, 30–40, 40–50, and >50 GWd/tU). The averaged % error between the DA-determined total Pu amounts and the fitting equation for each BU group, along with the number of DA data-sets, is listed in . The σ represents one standard deviation of the averaged % error. In general, the lower BU group (<30 GWd/tU) showed higher averaged % error (i.e., 7.02%); this means that if the ICT is applied to a spent fuel rod with a higher BU range (>30 GWd/tU), the % error can be expected to be less than 4%. And in fact, because the BU levels of spent fuel rods discharged from modern nuclear reactors are rising, it would be expected that most such fuel rods these days could easily meet this >30 GWd/tU BU-level requirement. Indeed, in the case of the >30 GWd/tU BU group (43 DA data-sets), the averaged % error was determined to be 3.88% ± 2.68% (= mean ± 1 standard deviation) and falling with increasing BU range.
Figure 5. Distribution of DA data between amounts of 137Cs and Pu for each BU group. The coefficient of determination (denoted by R2) showing the goodness of fit was 0.909.
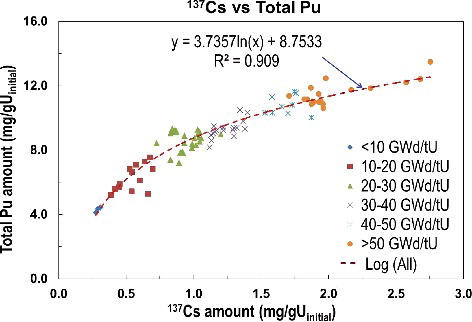
Table 3. Averaged % error in determination of total Pu amount for each BU group. The σ represents one standard deviation of the averaged % error.
Note that additional error could be incurred in determining the 137Cs amount due to (Equation1(1)
(1) ) the radial distribution of a pellet's 137Cs, caused by Cs migration from the pellet center to rim, (Equation2
(2)
(2) ) the uncertainty in determining the absolute detection efficiency of an axial gamma-scanning system for 662 keV gamma-rays, and (Equation3
(3)
(3) ) random fluctuation in gamma-ray counting. Sasahara et al. [Citation28] showed that the effect of a radial 137Cs distribution on the gamma intensity would be within 1%. This error, assuming the radial Cs distribution to be a sloping or well-type profile, could be mitigated to some extent by considering the pellet self-shielding factor.
For the next step, we investigated the effect of an IE range limit. For that purpose, the DA data was divided into three groups according to the IE (<3, 3–4, and >4 wt.%). plots the DA data distribution of the 137Cs versus Pu amounts for those three IE groups. The averaged % error between the DA-determined total Pu amounts and the fitting equation for each IE group is listed in . The σ represents 1 standard deviation of the averaged % error. In general, there was no benefit in applying the limit of the IE range. This was due mainly to the fact that a fuel rod can have a wide range of BU according to location, regardless of its IE, as shown in Section 3.2.
Figure 6. Distribution of DA data between amounts of 137Cs and Pu for each IE group. The coefficient of determination (denoted by R2) showing the goodness of fit was 0.909.
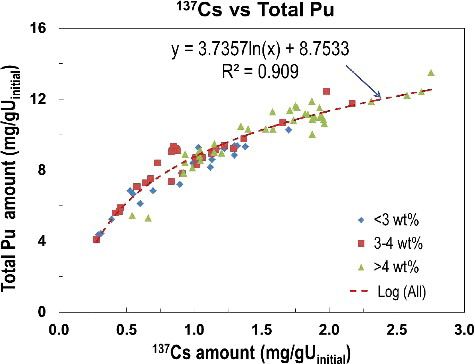
Table 4. Averaged % error in determination of total Pu amount for each IE group. The σ represents one standard deviation of the averaged % error.
3.2. Comparison of total Pu mass
One of the rods, M04, was extracted from the K23 assembly at PIEF (post-irradiation examination facility) in Korea Atomic Energy Research Institute (KAERI). The axial gamma-scan (gamma-ray spectroscopy in the energy range of 0.4–3 MeV) for this rod was performed with a step size of 2 mm and a measurement time/step of 60 s. The total number of steps was 1900. Three segment samples were taken from the rod and the post-irradiation examination (PIE) for the radial gamma-scan and DA on the Pu and U isotopics as well as the BU that was performed in 2003–2004 (CT = 2–3 y). The K23 assembly had been burnt through 3 cycles at a commercial PWR (900 MWe) between 1997 and 2001. The declared average BU of the K23 assembly and M04 rod were 52.59 and 57.85 GWd/tU, respectively. The IE of the UO2 pellets and the fuel type was 4.2 wt.% and Westinghouse 17 × 17, respectively.
Because this PIE had been performed for other purposes, the DA data was insufficient for calculation of the 137Cs and total Pu amounts. Specifically, the PIE on the M04 rod was mainly focused on the examination of mechanical properties as well as the other measurements (e.g., oxide thickness, Eddy current, axial gamma-scan, and fission gas release measurement). The DA on the relative isotopic compositions was performed only for U, Pu, and Nd; hence, the absolute amounts of such elements as well as the 137Cs amount were not available. This fact notwithstanding, analysis of these DA data was considered to be worthwhile for the purposes of a comparison of the total Pu amounts determined by each method and consideration of the extent to which results could differ.
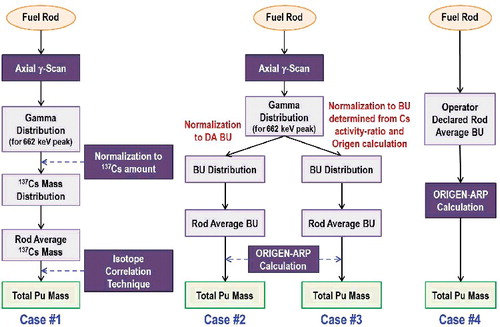
illustrates the four procedures that could be used to determine the total Pu amount in a spent fuel rod. One employs the ICT while the others rely on the ORIGEN-ARP calculation. For Case #1, the absolute detection efficiency of the axial gamma-scanning system for a rod needs to be preliminarily known in order to convert the 137Cs gamma distribution into the 137Cs mass distribution. As the absolute detection efficiency for the system used in PIEF was not available at the time of this study, ORIGEN-ARP calculations utilizing the BU determined by DA (i.e., Neodymium-148 method [Citation29]) were performed in order to calculate the 137Cs mass. Then, the gamma distribution was normalized to the 137Cs mass and the rod-average 137Cs mass was determined. Finally, total Pu mass was determined from the rod-average 137Cs mass using the ICT (EquationEquation (3(3)
(3) )). For Cases #2 and 3, the 137Cs gamma distribution obtained from gamma scan was normalized to the DA- or NDA-based BU in order to obtain the axial BU distribution from which the rod-average BU was then determined by simply averaging the BU for each point of the distribution. Finally, the total Pu amount was determined from the ORIGEN-ARP calculation with the rod-average BU. For Case #4, the simplest case, the ORIGEN-ARP calculation was performed with the operator-declared rod-average BU in order to determine the total Pu amount.
Figure 7. Procedures to determine total Pu amount.
One of the measured gamma-ray spectra at a certain rod location is shown for an explanatory purpose in . As can be seen, some of the strong peaks were identified. Due to the relatively short rod-cooling time (CT = 2.15 y), gamma-ray peaks of 134Cs (T1/2 = 2.06 y) and 106Ru-Rh (T1/2 = 366.4 d) [Citation10] were clearly identified. The axial gamma-ray distribution for 137Cs (the 662 keV peak) was normalized to the 137Cs mass (Case #1) or to the DA- (Case #2) or NDA-based (Case #3) BU, as shown in . The normalized distribution was determined once the sum of the deviation between the two sets of data was minimized. Specifically, the normalization process was to find a distribution that has the minimum sum-of-squares (i.e., least-squares fitting) between the axial gamma-ray distribution and the 137Cs mass for Case #1, the DA-based BU for Case #2, or the NDA-based BU for Case #3. The NDA-based BU was determined by the activity ratio between 134Cs and 137Cs for 13 locations. The 604.7 keV (134Cs) and 662 keV (137Cs) peaks were used to determine the BU from the activity ratio, and the 795.8 keV peak (134Cs) also was used in the calculation of the detection efficiency ratio [Citation30]. The rod-average 137Cs amount and BU were determined to be 1.949 mg/gUinitial, 53.439 GWd/tU, and 57.975 GWd/tU for Cases #1, #2, and #3, respectively. The amounts of 137Cs and total Pu as well as the BU, as determined by each method, are summarized in . Difference in the estimated total Pu amounts can be incurred up to 11.4%, according to the choice of method. Cases #3 and #4 produced almost the same amount of Pu, because the difference in the rod-average BU was only 0.2%. Note that the operator-declared BU, determined by a neutronic code calculation, sometimes showed a different number from the experimentally determined BU; hence, the operator-declared BU should be verified.
Figure 8. Gamma-ray spectrum for PWR spent fuel rod with cooling time of 2.15 y. Identified gamma-ray peak energies are 604.7, 795.8 (and 801.8), 1167.9, and 1365.1 keV for 134Cs, 662 keV for 137Cs, 1050.5 and 1128 keV for 106Rh, 1274.4 keV for 154Eu, and 1489.2 and 2185.6 keV for 144Pr.
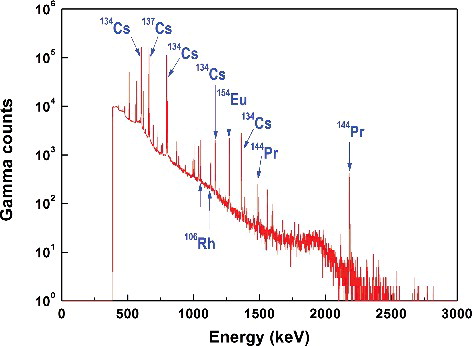
Figure 9. Normalized axial distributions for (a) 137Cs mass determined from isotope correlation, (b) BU determined from DA, and (c) BU determined from NDA.
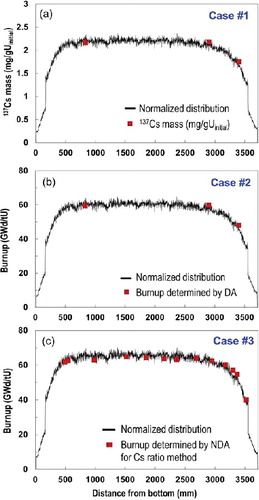
Table 5. Amounts of 137Cs and total Pu with BU determined by each method.
4. Summary
Because each of the isotopes in spent nuclear fuel has a specific mechanism for production and depletion as well as decay, its amount can be utilized as an indicator of the amount of another isotope. In this study, the isotope correlation between the amounts of 137Cs and Pu was determined as part of a simple and fast method developed for possible input material accountancy in a pyroprocessing facility. This method is based on the axial gamma-scan data of a spent fuel rod; from this information, the rod-average 137Cs amount and, in turn, the total Pu amount can be determined according to the isotope correlation.
Although the method was tested only for a rod, it can be applied to an assembly under the assumption that every rod in an assembly has the same axial distribution in terms of the BU (and thus the 137Cs amount). On this basis, if we measure a detailed axial gamma distribution for one rod (say, 2000 steps, 2 mm/step), several points of gamma-ray measurement for all of the other rods (say, 10 steps, 400 mm/step) could be enough to normalize the detailed gamma distribution to the 137Cs mass determined by gamma-ray measurement for several points. Additionally, this method can be applied to a representative sample obtainable from a mechanically crushed fragment by a representative sampling technique, or from homogenized powder obtained by the mixing process entailed in homogenization. In either case, the ICT, in contrast to typically cost-intensive and time-consuming DA, can be considered as a tool for nuclear material accountancy.
In conclusion, the ICT, which has no dependency on the BU code calculation or DA of a segment, could be used for input material accountancy with reasonable uncertainty. The isotope correlation between only the amounts of 137Cs and Pu was studied at this time; however, the same correlation technique could be used for other isotopes/elements of interest from the safeguards perspective (e.g., 235U and 244Cm), of course with different levels of uncertainty.
Acknowledgments
This work was supported by a National Research Foundation of Korea (NRF) grant funded by the Korean government through MSIP [grant number NRF-2012M2A8A5025950].
Disclosure statement
No potential conflict of interest was reported by the authors.
References
- Humphrey MA, Veal KD, Tobin SJ. The next generation safeguards initiative's spent fuel nondestructive assay project. J Nucl Mater Manag. 2012;40(3):6–11.
- Ackerman JP. Chemical basis for pyrochemical reprocessing of nuclear fuel. Ind Eng Chem Res. 1991;30:141–145.
- Simpson MF. Developments of spent nuclear fuel pyroprocessing technology at Idaho national laboratory. Idaho Falls (ID): Idaho National Laboratory; 2012. ( Report no. INL/EXT-12-25124).
- Lee H, Park GI, Lee JW, et al. Current status of pyroprocessing development at KAERI. Sci Tech Nucl Install. 2013;343492:1–11.
- Seo H, Oh JM, Shin HS, et al. Burnup measurement of spent fuel assembly by czt-based gamma-ray spectroscopy for input nuclear material accountability of pyroprocessing. IEEE Trans Nucl Sci. 2014;61(4):2169–2174.
- Gauld IC, Bowman SM, Horwedel JE. ORIGEN-ARP: automatic rapid processing for spent fuel depletion, decay, and source term analysis. Oak Ridge (TN): Oak Ridge National Laboratory; 2014. ( Report no. ORNL/NUREG/CSD-2/V1/R7).
- Gauld IC, Ilas G, Radulescu G. Uncertainties in predicted isotopic compositions for high burnup PWR spent nuclear fuel. Oak Ridge (TN): Oak Ridge National Laboratory; 2011. ( Report no. ORNL/TM-2010/41).
- Radulescu G, Gauld IC, Ilas G. SCALE 5.1 predictions of PWR spent nuclear fuel isotopic compositions. Oak Ridge (TN): Oak Ridge National Laboratory; 2010. (Report no. ORNL/TM-2010/44).
- Ilas G, Gauld IC. Analysis of experimental data for high-burnup PWR spent fuel isotopic validation – Vandellόs II reactor. Oak Ridge (TN): Oak Ridge National Laboratory; 2011. ( Report no. ORNL/TM-2009/321).
- Reilly D, Ensslin N, Smith H Jr., et al. Passive nondestructive assay of nuclear materials. Los Alamos (NM): Los Alamos National Laboratory; 1991. ( Report no. LA-UR-90-732).
- Hermann A, Berndt R. New possibilities in isotope correlation analysis of spent nuclear fuel. J Radioanal Chem. 1983;80(1–2):189–198.
- Cao Y, Gohar Y, Broeders CHM. MCNPX Monte Carlo burnup simulations of the isotope correlation experiments in the NPP Obrigheim. Ann Nucl Energy. 2010;37:1321–1328.
- Guenther RJ, Blahnik DE, Campbell TK, et al. Characterization of spent fuel approved testing material – ATM-103. Richland (WA): Pacific Northwest National Laboratory; 1988. ( Report no. PNL-5109-103).
- Seo H, Oh JM, Shin HS, et al. Measurement of gamma-ray dose distribution for spent fuel assembly using ion chamber. Fall Meeting of Korean Association of Radiation Protection; 2012 Nov 30; Jeju.
- Suyama K, Murazaki M, Ohkubo K, et al. Re-evaluation of assay data of spent nuclear fuel obtained at japan atomic energy research institute for validation of burnup calculation code systems. Ann Nucl Energy. 2011;38:930–941.
- Han B-Y, Na S-H, Park SH, et al. Measurement of homogeneity of U and Pu isotopes in PWR spent fuel powder mixture. J Nucl Sci Technol. 2014;51(10):1205–1211.
- Lin CC. Radiochemistry in nuclear power reactors. Washington (DC): National Academy Press; 1996. ( Report no. NAS-NS-3119).
- Phillips OR, Bosler GE, Halbig JK, et al. Neutron measurement techniques for the NDA of irradiated fuel assemblies. Los Alamos (NM): Los Alamos National Laboratory; 1981. (Report no. LA-9002-MS).
- Hermann OW, Bowman SM, Brady MC, et al. Validation of the SCALE System for PWR spent fuel isotopic composition analyses. Oak Ridge (TN): Oak Ridge National Laboratory; 1995. ( Report no. ORNL/TM-12667).
- DeHart MD, Hermann OW. An extension of the validation of SCALE (SAS2H) isotopic predictions for PWR spent fuel. Oak Ridge (TN): Oak Ridge National Laboratory; 1995. (Report no. ORNL/TM-13317).
- Ilas G, Gauld IC, Difilippo FC, et al. Analysis of experimental data for high burnup PWR spent fuel isotopic validation-calvert cliffs, Takahama, and three Mile Island reactors. Oak Ridge (TN): Oak Ridge National Laboratory; 2010. (Report no. ORNL/TM-2008/071).
- Ilas G, Gauld IC, Murphy BD. Analysis of experimental data for high burnup PWR spent fuel isotopic validation-ARIANE and REBUS programs (UO2 fuel). Oak Ridge (TN): Oak Ridge National Laboratory; 2010. (Report no. ORNL/TM-2008/072).
- Barbero P, Bidoglio G, Bresesti M, et al. Post irradiation examination of the fuel discharged from the Trino Vercellese reactor after the 2nd irradiation cycle. Luxembourg: Commission of the European Communities; 1977. (Report no. EUR 5605e).
- Spent fuel isotopic composition database [Internet]. Paris: OECD/NEA; [cited 2015 Jul 8]. Available from: http://www.oecd-nea.org/sfcompo/
- Nuclear Science Committee. Spent nuclear fuel assay data for isotopic validation. Paris: OECD/NEA; 2011. (Report no. NEA/NSC/WPNCS/DOC(2011)5).
- Roque B, Marimbeau P, Bioux P, et al. The French post irradiation examination database for the validation of depletion calculation tools. In: Japan Atomic Energy Research Institute. 7th International Conference on Nuclear Criticality Safety (ICNC2003); 2003 Oct 20–24; Tokai-mura. p. 865–870.
- Boulanger D, Lippens M, Mertens L, et al. High burnup PWR and BWR MOX fuel performance: a review of belgonucleaire recent experimental programs. In: American Nuclear Society. International Meeting on LWR Fuel Performance; 2004 Sept 19–22; Orlando (FL). p. 273–284.
- Sasahara A, Matsumura T, Nicolaou G, et al. Neutron and gamma ray source evaluation of LWR high burn-up UO2 and MOX spent fuels. J Nucl Sci Technol. 2004;41(4):448–456.
- ASTM International. Standard Test Method for Atom Percent Fission in Uranium and Plutonium Fuel (Neodymium-148 Method). Annual book of ASTM standards 12.02 (E321-79), 91; 1995.
- Tam Nguyen C, Almási I, Hlavathy Z, et al. Monitoring burn-up of spent fuel assemblies by gamma spectrometry. IEEE Trans Nucl Sci. 2013;60(2):1107–1110.