
 ?Mathematical formulae have been encoded as MathML and are displayed in this HTML version using MathJax in order to improve their display. Uncheck the box to turn MathJax off. This feature requires Javascript. Click on a formula to zoom.
ABSTRACT
In-vessel and ex-vessel mitigation strategies have been revisited to improve the severe accident management (SAM) for operating nuclear power plants. Because independent mitigation measures tend to produce positive and adverse effects simultaneously, it is necessary to investigate the efficacy of individual measures by means of proper quantification. Thus, in the present study we investigated the overall efficacy of existing SA mitigation strategies prepared for the Optimized Power Reactor 1000 MWe (OPR1000) by means of MELCOR 1.8.6 code. The numerical evaluation showed that the Mitigation-01, feeding water into the steam generators, is the most effective among the other mitigations. In addition, Mitigation-02, reactor coolant system depressurization, could not mitigate the SA sufficiently when applied individually. Among the four ex-vessel mitigation strategies, execution of containment spray was effective in removing most of the aerosol fission product but also intensified hydrogen combustion by increasing the partial hydrogen pressure owing to steam condensation. Mitigation-07, operation of passive autocatalytic recombiners (PARs), could reduce the hydrogen concentration, though the catalytic reaction was predicted to increase the containment pressure. In conclusion, this study suggests that mitigation measures should be carefully selected, and that counteracting measures should be prepared to minimize potential adverse effects.
1. Introduction
After the severe accident (SA) at the Fukushima Daiichi nuclear power plants (NPPs) in 2011, many countries operating NPPs analyzed the details of Fukushima accident [Citation1–3]. Not only the Fukushima accident in 2011 but also the TMI-2 accident in 1979 have demonstrated that the possibility of SAs cannot be ruled out any longer. This philosophical change toward the perception of SA in NPP has been reflected as the form of legal demand in Korea. As well, IAEA declared that new NPPs are to be designed, sited, and constructed with mitigating release of large amounts of radionuclides when an SA occurs [Citation4]. In Korea, a new Nuclear Safety Act was passed in June 2015, where improvement of current severe accident management (SAM) capability has been enforced as a regulatory item for both new and presently operating NPPs. Thus considering the regulatory stance around the world towards SAs, it is imperative to perform thorough SA analysis and to identify potential regulatory issues of the current severe accident management guidance (SAMG).
To meet the imminent need of improving the SAMG, the current study focuses on SA analysis using SA analysis code. Various SA analysis codes are available worldwide, and representative and reliable SA codes need to be employed as a best practice. Due to the complex nature of the SA sequence and its progression, integral and lumped parameter codes are utilized. Such a code enables analysis of the overall thermal-hydraulic and radioactive material behavior of the NPP system. SCDAP/RELAP5, MAAP4, MELCOR, and ASTEC are representative examples of code used to analyze progression during hypothetical SAs [Citation5–7]. Park et al. investigated the SAMG strategy of reactor coolant system (RCS) depressurization and coolant injection using SCDAP/RELAP5 code [Citation8,Citation9]. Lee et al. confirmed the effects of multiple SAMG mitigation measures using MAAP4 code [Citation10]. Recently, Seo et al. examined the effectiveness and adverse effects of the RCS depressurization strategy under various SAMG entry conditions using MELCOR code [Citation11]. Lee et al. also showed that the RCS coolant injection strategy could be influenced strongly by the use of the RCS depressurization strategy [Citation12]. In Europe, Stefanova et al. investigated the effects of SAMG in-vessel mitigation strategies using ASTEC code [Citation13]. These studies focused on the integrity of the reactor pressure vessel (RPV), and accordingly the calculations were continued until RPV failure. However, an SA adversely affects not only the RPV but also the containment, as observed in the Fukushima NPP accident. The containment is the last barrier, ensuring ultimate safety of the NPP by retaining fission products (FPs). Therefore systematic analysis including ex-vessel mitigation measures should be performed to investigate the efficacy of an overall mitigation strategy.
In this study, adverse and beneficial effects of individual SAMG mitigation measures were evaluated for a hypothetical SA in an OPR1000 reactor. As of this writing, 13 out of 20 operating pressurized water reactors (PWR) in the Republic of Korea are of the OPR1000 design, and are operating within a 3-year grace period to meet the requirements of the new Nuclear Safety Act. The present evaluation was performed based on a five-step SA evaluation methodology, and numerical calculations were performed using MELCOR 1.8.6 code.
2. Numerical methodologies
2.1. Evaluation methodology for severe accident
shows the five-step methodology used herein for evaluation of SAM strategies. The first step is to select an appropriate and representative NPP; herein we selected the OPR1000. The OPR1000 is a 1000 MWe PWR that is designed to include four cold legs and two hot legs with a large dry containment.
Figure 1. Evaluation methodology for SAM strategies.
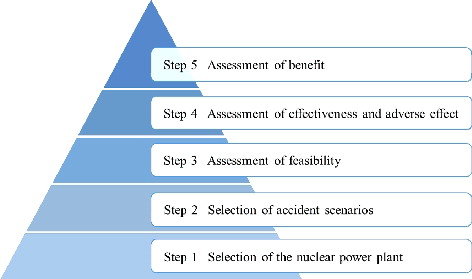
The second step is to select the most probable SA scenarios and to perform steady-state analysis and transient analysis of these scenarios without the application of any mitigation measures. Herein we selected the small-break loss-of-coolant accident (SBLOCA) without safety injection (SI), the station blackout (SBO), and the total loss of feedwater (TLOFW) as the postulated SA scenarios. lists the probabilities of transition from initiating events to severe accidents for the OPR1000. The aforementioned SA scenarios carry the highest probability of transitioning into SAs [Citation14]. In fact, SBLOCA w/o SI, SBO, and TLOFW are representative severe accidents showing high pressure accident sequences. Also they bear the highest SA probability among others, which provides rationale to perform the SA analysis rather immediately. On the contrary, SGTR accident having the same SA probability with the TLOFW accident involves accident sequences of RCS depressurization and potential bypass of the FPs to the environment directly. Thus thorough analysis of the SGTR accident is of great importance in the SA research community and its detailed analysis is underway in our research group. Thus, up-to-date result regarding the SGTR accident will be reported as a separate work soon.
Table 1. Probability of transition from initiating events to severe accidents for OPR1000.
The third step is to determine feasible mitigation measures for the individual mitigation strategy. shows a schematic flowchart of SAMG strategies developed for the OPR1000 [Citation15]. When the core exit temperature (CET) reaches 923 K, which is the entry point for the SAM, the technical support center (TSC) initiates execution of the SAMG. The mitigation strategies are carefully selected using several measurable parameters such as steam generator (SG) level, RCS pressure, CET, containment water level, radiation level, containment pressure, and hydrogen concentration, as well as many in-vessel and ex-vessel instrumentation signals. The mitigation strategies are later terminated if safety parameters meet criteria. lists various mitigation strategies in the SAMG, including their objectives and the measures available to carry them out. To fulfill the objective of a mitigation strategy, various mitigation measures can be applied. As a base case, it was assumed that the mitigation measures were unavailable; the results of base cases for the three investigated SA scenarios were used as reference data for comparison with the results of applying mitigation measures. For these mitigated cases, the mitigation measures available for the OPR1000 are selected and corresponding results are analyzed. shows the mitigation measures selected. The mitigation measures were activated when the safety parameters prescribed in the current SAMG shown in were not satisfied. For example, SG water level, RCS pressure, CET, CNMT level, radiation level, CNMT pressure, and H2 concentration are the safety parameters corresponding to Mitigation-01 to 07, respectively. The monitoring of in-vessel and ex-vessel instrumentation signals is impossible for on- and off-site station black out. However, since the OPR1000 includes batteries and emergency diesel generator (EDG) in preparation for SBO, use of these countermeasures was assumed to work to supply the instrumentation signals for eight hours.
Figure 2. Flowchart of OPR1000 SAMG.
Table 2. Severe accident mitigation strategies of SAMG.
Table 3. Selection of mitigation measures.
The fourth step is to quantify the effectiveness and the adverse effects of individual mitigation measures. Effectiveness of individual mitigation measures included delays in the melting of cladding, RPV failure, and leakage of FPs from the containment. Adverse effects can be numerated as containment overpressurization and the acceleration of possibilities of FP leakage corresponding to the containment overpressurization. Increased hydrogen concentration can also be included as the adverse effect. The quantification of aforementioned effectiveness and adverse effect can be used as the basis to judge whether any benefit can be expected.
The last step is to assess the overall efficacy of an SA mitigation measure and to identify any possibilities for improving the SAMG. This was carried out by analyzing the comprehensive data from the fourth step. Separate assessments were carried out for the different accident scenarios.
2.2. MELCOR code
In this study, MELCOR version 1.8.6 was used to fulfill the addressed objectives. MELCOR code is an SA simulation code developed since 1982 at the Sandia National Laboratories for use in plant risk assessment and source term analysis. This code is an integral code and includes various subpackage codes. Thus, integral system analysis is possible in the SA case, although this code inherently includes some uncertainty owing to its embedded empirical models. The entire spectrum of SA phenomena is treated by the code, such as thermal-hydraulic response; core degradation following the candling model; hydrogen transport, ignition, and mitigation; and FP release and transport. Especially, modeling of various SA mitigation measures is feasible using this code. MELCOR code is mostly used by regulatory bodies and academic researchers to evaluate strategies for SA mitigation and to simulate detailed features of SA sequences [Citation16–18].
2.3. MELCOR input model of OPR1000
As a reference NPP, OPR1000 was modeled in MELCOR. The MELCOR nodalization consists of three major parts: the primary system, the secondary system, and the containment (). The lower plenum (control volume (CV) 150), the reactor core (CV 170), the upper plenum (CV 260), two hot legs (CV 310 and 410), and four cold legs (CV 380, 390, 480, and 490) were modeled as the primary system. Two steam generators (CV 600 and 700) and a turbine (CV 740) were modeled as the secondary system. The containment was modeled as four major control volumes: the cavity (CV 810), the inner shell (CV 820), the annulus (CV 830), and the dome (CV 840). The dome occupies the most volume in the containment. The modeled safety measures for SA mitigation were auxiliary feed water (AFW), the safety depressurization system (SDS), high-pressure safety injection (HPSI), containment spray, and the passive autocatalytic recombiner (PAR).
Figure 3. MELCOR nodalization for OPR1000.
The core nodalization for MELCOR calculation included 7 radial rings and 14 axial levels (). The lower plenum extended from the first to the third axial level, the active fuel region extended from the fourth to thirteenth axial levels, and the fourteenth axial level of the core cell represented the upper region of the fuel assembly, from which the CET information was extracted.
Figure 4. MELCOR nodalization for reactor core of OPR1000.
3. Results and discussions
Three different accident scenarios were simulated using MELCOR. To establish a basis, 3 base cases of SBLOCA without SI, SBO, and TLOFW were simulated without any mitigation measures. A small break of 1.35″ in the cold leg was assumed for the base case of SBLOCA without SI. For the SBO base case, the off-site power was assumed to be lost. For the TLOFW base case, main feed water (MFW) and AFW were considered to be unavailable. In addition, emergency core cooling by means of active safety injection was assumed to be unavailable in all cases. MELCOR simulations continued for 72 h, which is the new scoping time for accident management.
3.1. Steady-state result
A steady-state calculation was performed before the accident was initiated. This process is of importance to verify the suitability of the nodalization. compares the OPR1000 design values with the results of MELCOR steady-state calculation. The OPR1000 design values listed in the Final Safety Analysis Report (FSAR) are the most reliable reference data for the steady-state calculation. The parameters obtained from the MELCOR calculation were in very good agreement with the FSAR values. Thus the constructed input model was judged to be sufficiently reliable for use in the accident modeling.
Table 4. OPR1000 operating conditions: design values per FSAR and steady-state MELCOR modeling results.
3.2. Base cases
The scenarios of SBLOCA without SI, SBO, and TLOFW were analyzed in the base cases of no operator action. summarizes the MELCOR results for the three base cases. After the accident started at time 0, the reactor tripped at 0.04, 0, and 0.01 h in the respective base cases of SBLOCA without SI, SBO, and TLOFW. Following the reactor trip, the decay heat generated in the core was transported to the secondary side, which caused vaporization, reducing the water level of the SG. As a result, the SG dried out, the temperature of the primary coolant increased, and the coolant was transformed into hot steam. Then the core became uncovered and heated up owing to continuous vaporization of the core inventory. Following the uncovering of the core, oxidation of the cladding, molten pool relocation, and RPV failure occurred in sequence owing to the core decay heat and the significant oxidation heat. In the case of SBLOCA without SI, the RCS pressure decreased owing to the ruptured cold leg, but this tendency was opposite in the SBO and TLOFW cases. In the case of the SBLOCA, some coolant was discharged from the safety injection tank (SIT) to the core, thereby delaying RPV failure by about 2 h compared to the base case. In all cases, the containment pressure increased owing to the release of high-enthalpy steam prior to RPV failure. During the SBLOCA, this occurred because high-enthalpy liquid was discharged into the containment; during the SBO and TLOFW, this occurred because a significant amount of steam was discharged through the pressurizer safety relief valve (PSRV). RPV failure was accompanied by release of the heated molten core into the containment. The containment pressure increased because of the heat and noncondensable gas generated by means of molten corium–concrete interaction (MCCI). As a result, a significant amount of FPs was released into the containment, and eventual leakage from the containment into the environment was predicted to start when the containment pressure reached the designed leak pressure, at 30.9, 39.5, and 34.6 h for the SBLOCA, SBO, and TLOFW cases, respectively. However, complete containment failure was not foreseen within 72 h in any of the three cases.
Table 5. Major accident sequences in the base cases.
3.3. Effectiveness and adverse effects from mitigation strategies
AFW, opening of SDS, HPSI, containment spray, and PAR were selected as critical mitigation measures, and these measures were applied in the model to evaluate their effectiveness and adverse effects. – show the major accident sequences for each mitigation case. The effectiveness and adverse effects of the applied mitigation strategies were analyzed by comparing the times to cladding melting, RPV failure, and leakage of FPs into the environment.
Table 6. Major accident sequences for SBLOCA without SI in base and mitigation cases.
Table 7. Major accident sequences for SBO in base and mitigation cases.
Table 8. Major accident sequences for TLOFW in base and mitigation cases.
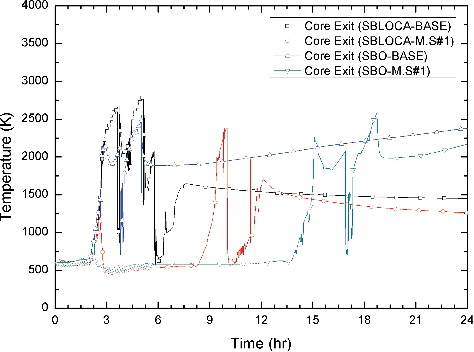
The turbine-driven AFW injection was selected as a feasible measure for the mitigation strategy Mitigation-01. compares the CET with and without application of Mitigation-01. For the SBLOCA with mitigation applied, some amount of heat in the primary circuit was transported to the SGs by means of secondary side cooling (SSC). As the heat was removed from the primary coolant system, the CET decreased rapidly and the state of core was mitigated for 5.4 h. However, the core overheated in the long run despite the SSC. The primary coolant being cooled by the SSC was released continuously through the break. Thus, no primary coolant became available to cool the core. As a result, the coolant was transformed into vapor, rapid oxidation occurred, and finally the CET increased sharply. Fuel melting was accelerated by the oxidation reaction and the molten fuel was relocated into the lower head. Owing to the substantial heat of the molten fuel, the RPV failed through the penetration in the lower head. In the case of SBO, the turbine-driven AFW injection was assumed to work for 8 h with the assistance of diesel generators and emergency batteries. Like in the SBLOCA, the primary coolant was cooled by the SSC and the stability of the core was preserved. However, RPV failure occurred after the SG dried out. In both cases, the containment pressure increased and FPs leaked into the environment after the RPV failure. Due to the delays in RPV failure, FP leakage was delayed significantly compared to the base cases for both SBLOCA and SBO. When Mitigation-01 was applied, cladding melting, RPV failure, and FP leakage into the environment were delayed effectively. Thus Mitigation-01 is highly effective and its application should be prioritized over other strategies. If the primary coolant and the SSC are maintained, the stability of the core will be recovered successfully. However, RPV failure could not be avoided in the present simulation owing to depletion of core water inventory.
Figure 5. Core exit temperature in Mitigation-01 cases.
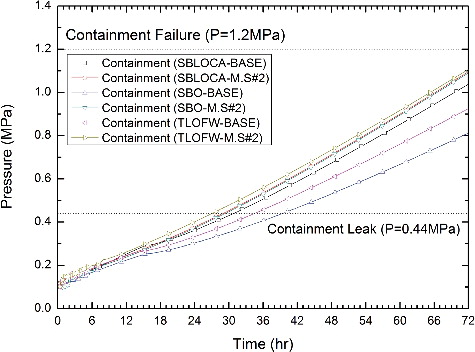
Opening the SDS was selected as a feasible measure for Mitigation-02. For the SBLOCA case, the RCS pressure decreased and coolant was injected from the SIT when the mitigation strategy was applied. Because the injected coolant cooled the core before the oxidation reaction began, cladding melting and RPV failure could be delayed by 4.11 h and 6.32 h compared to the base case. In the cases of SBO and TLOFW, the core was cooled by the injected coolant, similar to the SBLOCA case; cladding melting and RPV failure were delayed as well. However, the magnitude of the delay in cladding melting and RPV failure was not as great as that achieved by applying Mitigation-01. In addition, an adverse effect from the application of Mitigation-02 was identified. Owing to the depressurization of the primary system, containment pressure increased more rapidly when Mitigation-02 was applied. Also, because of the earlier RPV failure compared to the Mitigation-01 case, additional heat and hydrogen were generated from the MCCI, which produced an exothermic reaction between molten corium and steam. shows the containment pressures for the three accident scenarios with the application of Mitigation-02. As an adverse effect of the application of Mitigation-02, the containment pressure increased owing to the coolant discharge from the SDS and immediate expansion of coolant volume in the containment. Because of this discharge, therefore, FPs were more rapidly released than in the base cases.
Figure 6. Containment pressure in Mitigation-02 cases.
Application of the HPSI was selected as the measure for Mitigation-03. shows the HPSI total flow rate for the Mitigation-03 case. In SBLOCA, the RCS pressure decreased owing to the break flow through the cold leg. When the RCS pressure was lowered to 11 MPa, the HPSI could be actuated and the injected coolant cooled the overheated core. Until the reactor water storage tank (RWST) dried out, RPV failure was delayed compared to the base case. In the cases of SBO and TLOFW, the HPSI could not be operated prior to RPV failure because the RCS pressure remained higher than the HPSI actuation set point of 11 MPa. Thus the coolant was injected into the cavity only after RPV failure, and cooled the molten core.
Figure 7. HPSI total flow rate in Mitigation-03 cases.
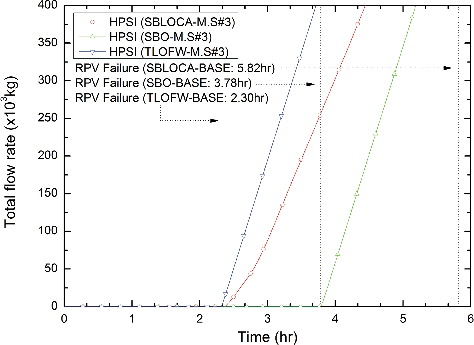
Figure 8. Cavity water level in Mitigation-04 cases.
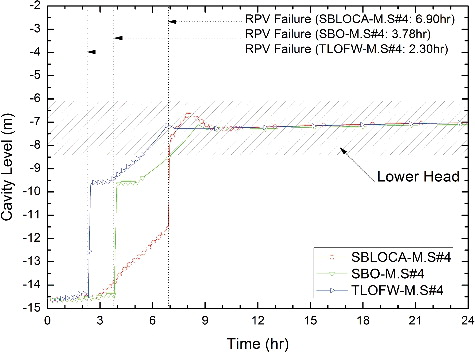
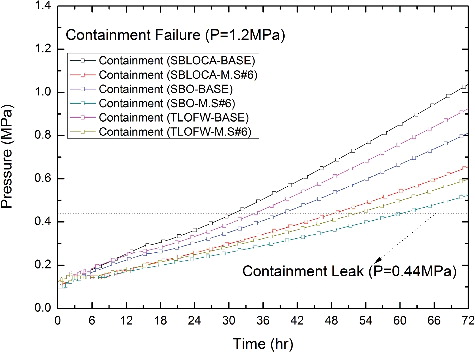
Containment spray was selected as the effective measure for Mitigation-04, -05, and -06. CitationFigure 8 shows the water level of the cavity for the Mitigation-04 case. The water level of the containment cavity increased very slowly when the mitigation measure was applied. However, when RPV failure occurred and the containment spray was applied, the levels of the containment cavity reached −11.34, −14.51, and −14.37 m, respectively, for SBLOCA without SI, SBO, and TLOFW. The water level could not reach the elevation of the lower head and had no physical effect upon the ex-vessel core cooling before RPV failure. After RPV failure, the molten core was relocated to the cavity space and became submerged in the cavity water. The cavity water cooled the overheated molten core and removed the generated aerosol FPs from the molten core. and show the mass of radioactive FPs in the form of aerosols for the Mitigation-05 cases. The aerosol FPs in the containment were removed by the water of the containment spray. The maximum aerosol FP removal rates were 80%–85% for the three cases. shows the containment pressure for the Mitigation-06 cases, in which the steam in the containment was condensed by the containment spray. Containment pressure decreased and the release time of FPs was delayed 152%–157% due to the decrease of the steam mole fraction compared to the base case. However, the possibility of hydrogen combustion increased because of the lack of inerting steam and an increase in the hydrogen mole fraction.
Figure 9. Mass of radioactive fission product in Mitigation-05 case (SBLOCA).
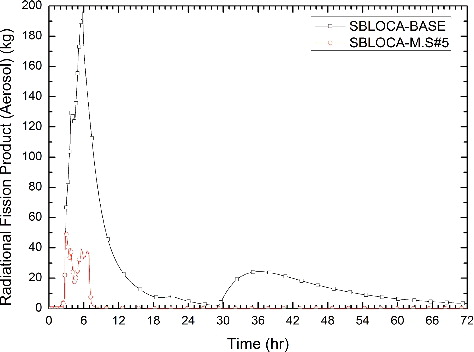
Figure 10. Mass of radioactive fission product in Mitigation-05 cases (SBO and TLOFW).
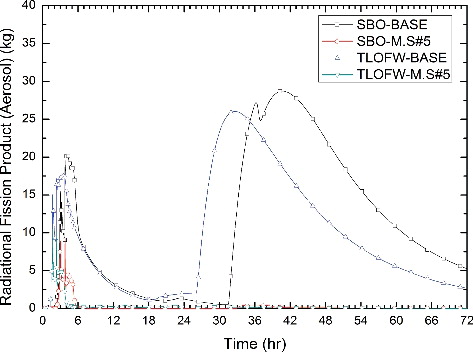
Figure 11. Containment pressure in Mitigation-06 cases.
PAR was selected as the Mitigation-07 measure. shows the hydrogen mole fraction in the containment for Mitigation-07. The hydrogen mole fraction remained below 0.05 in the Mitigation-07 case owing to the hydrogen reduction by the PAR. As a result, the possibility of hydrogen combustion decreased compared to the base cases. The hydrogen recombination reaction is shown as
(1)
(1)
Figure 12. Hydrogen mole fraction in the containment in Mitigation-07 cases.
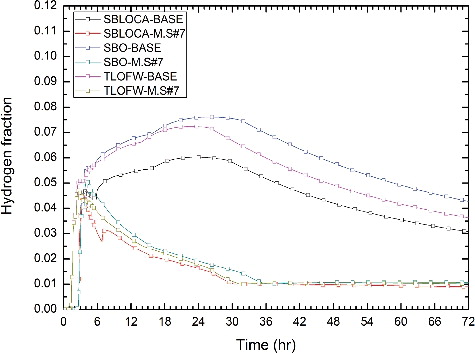
As a result of the recombination of hydrogen and oxygen, steam and exothermic heat were generated, which could potentially pressurize the containment and induce FP leakage.
3.4. Detailed analysis of containment integrity
Containment integrity is the most important objective of SAM. In judging the containment integrity, pressure plays a critical role because the occurrence of FP leakage or containment failure depends sensitively upon the containment pressure. Containment pressure increases owing to the discharge of steam into the containment as well as possible ignition and explosion of combustible gases such as hydrogen and carbon monoxide. To investigate in detail the adverse effects of the latter phenomena, hydrogen risk from the Mitigation-06 and -07 strategies are discussed in this section.
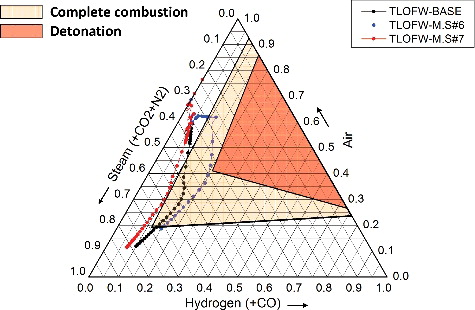
When the containment spray (Mitigation-06) was applied, the containment pressure decreased owing to condensation of the steam; this measure was thus predicted to be effective in maintaining the containment integrity. However, this measure raised the partial pressure of hydrogen and thus rapidly increased the risk of hydrogen combustion. – show Shapiro diagrams for the base cases and the Mitigation-06 and -07 cases of the three SA scenarios. The Shapiro diagram maps the boundaries for ignition (or complete combustion) and detonation in terms of the mole fractions of the combustible gases, inert gases, and air. The Shapiro diagram was developed by Z. M. Shapiro et al. [Citation19] and is used by the United States Nuclear Regulatory Commission (NRC) and Organization for Economic Co-operation and Development (OECD) Nuclear Energy Agency to manage hydrogen [Citation20,Citation21]. For the base cases of the three SA scenarios, hydrogen increased as the SA progressed and the combustion condition entered the complete combustion region of the diagram. When Mitigation-07 (PAR) was applied, entrance into the complete combustion region was avoided and thus no substantial hydrogen risk was expected. However, when Mitigation-06 was applied, owing to the steam condensation fraction, the steam fraction increased but the partial pressure of hydrogen rose quickly. Thus, combustion conditions entered well into the complete combustion region of the Shapiro diagram and closely approached the detonation region, which is the most hazardous. If large amounts of hydrogen combustion and detonation occur, the containment pressure will sharply increase, accelerating FP leakage and severe containment failure.
Figure 13. Shapiro diagram for SBLOCA without SI.

Figure 14. Shapiro diagram for SBO.
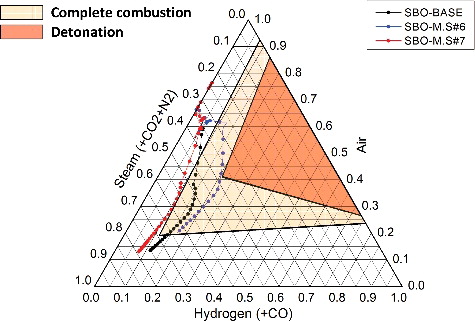
Figure 15. Shapiro diagram for TLOFW.
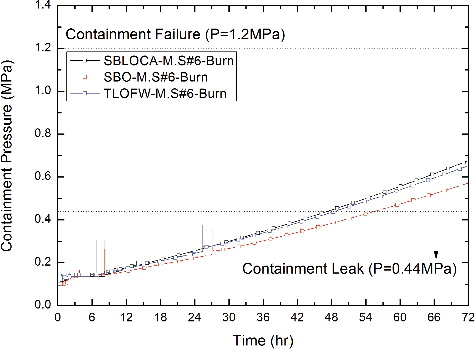
shows the pressure of containment for the Mitigation-06 case in which hydrogen ignition is permitted. Hydrogen ignition in the containment was simulated using HECTR 1.5 code embedded in MELCOR. The ignition of combustible gases occurred after RPV failure. Owing to the large release of hydrogen and the execution of spray, substantial hydrogen risk was predicted. The maximum containment pressure spike was calculated to be 0.16 MPa; this did not immediately threaten the containment integrity because the containment leak pressure is about 0.44 MPa. However, once hydrogen ignition occurs, significant safety features in the containment would be damaged, likely worsening the SAM.
Figure 16. Containment pressure for Mitigation-06 cases, including hydrogen ignition.
As such, the use of containment spray shows both positive and adverse effects, and the question of whether to use it should be considered carefully to avoid hydrogen risk.
4. Overall efficacy of the mitigation strategies
4.1. Efficacy of in-vessel mitigation strategies
SA sequences and progressions differ significantly among the SBLOCA, SBO, and TLOFW. Thus, in-vessel mitigation strategies need to be selected carefully based upon consideration of the characteristics of the relevant accident scenario. As discussed previously, Mitigation-01 was identified as the best strategy to mitigate SBLOCA and SBO. However, TLOFW is triggered by the loss of the AFW and MFW used in Mitigation-01, so Mitigation-01 is inherently not applicable in this scenario. Therefore, prompt recovery action needs to be considered in the current SAMG. In addition, opening the SDS in Mitigation-02 is needed to depressurize the RCS, but has the consequence of releasing coolant inventory; this has the adverse effects of a lack of core cooling water, acceleration of hydrogen release, and containment pressurization. Therefore unless the SI system is available, the use of SDS may not give the best mitigation result. Finally, in the case of Mitigation-03, the HPSI cannot be actuated in the SBO and TLOFW scenarios owing to the high RCS pressure, but is effective for SBLOCA owing to its natural depressurization. Therefore, actuation of HPSI is only effective under conditions of RCS depressurization.
Overall, Mitigation-01 was identified as the highest-priority in-vessel mitigation measure. Use of AFW and MFW is expected to impose the least adverse effects on the system, and therefore the reliability of AFW and MFW needs to be guaranteed to improve SAM.
4.2. Efficacy of ex-vessel mitigation strategies
Actuation of spray and PAR has been discussed herein as the major ex-vessel mitigation measures. Other ex-vessel mitigation measures exist such as fan coolers, cavity flooding by fire protection system, and igniters, but these are not commonly installed in all 13 operating OPR1000 units, and thus were not analyzed herein.
As discussed in Section 3.4, actuation of spray was predicted to have the substantial adverse effect of increasing hydrogen risk. A worse situation can be hypothesized: if cold water pours into the containment environment of massive steam and hydrogen at a high injection rate, dramatic steam condensation will occur and subsequently hydrogen combustion cannot be avoided. Thus, the technical method of spray injection should be developed to minimize the adverse effect of steam condensation. More innovatively, a hybrid spray system may be introduced to counteract the steam condensation. Removal of steam contributes to reduction of the inerting medium in the containment. Thus it is expected that the current spraying system could be improved by adding the injection of inerting gas to compensate for this loss.
The use of PAR was shown to reduce the hydrogen concentration effectively, but with the adverse effect of containment pressurization owing to release of the exothermic heat of the catalytic reaction. This pressurization can accelerate containment leakage unless a counteracting measure is introduced. Also, within the SA scoping time of 72 h, there may be an aging issue in the PAR because of the release of high-temperature steam. Thus, some protective techniques need to be secured to guarantee the designed PAR performance. Most of all, actuation of PAR cannot be initiated by operator because it is a passive device. Since passive devices have inherently poor reliability, the positive effect expected in theory may not be fully achieved.
In conclusion, installation of PAR and actuation of spray are essential to cope with hydrogen risk and to ensure containment integrity and FP control. However, because both mitigation measures have inherent adverse effects, some counteracting measures should also be considered and implemented in the SAMG.
5. Conclusions
The effectiveness and adverse effects of independent SA measures were analyzed. Several adverse effects were verified to occur when SA measures were operated independently. Major findings and future work can be summarized as follows:
A five-step numerical methodology to assess the overall efficacy of the SAM strategies was established: (1) selection of the nuclear power plant, (2) selection of accident scenarios, (3) assessment of feasibility, (4) assessment of effectiveness and adverse effects, and (5) assessment of benefits.
To establish base cases, SA analysis was performed for SBLOCA without SI, SBO, and TLOFW of OPR1000 assuming that all SA mitigation measures were unavailable. The SA analysis was extended to include the effect of the mitigation strategies prescribed in the SAMG.
By comparing the results from the base cases and the mitigated cases, the effectiveness and adverse effects from the application of the mitigation strategies were quantitatively analyzed, and the mitigation strategies’ overall efficacies were judged.
Application of mitigation measures should be considered carefully because certain measures are inapplicable in specific accident scenarios, and cannot be performed for example due to limited thermal-hydraulic conditions. This provides a rationale for the necessity of SAM based on specific accident scenarios rather than fully relying on the symptoms of the NPP.
Application of ex-vessel mitigation measures should be selected carefully, including consideration of the effectiveness and adverse effects. Operation of PAR effectively mitigated hydrogen risk but also increased containment pressure. Actuation of spray could control the thermal-hydraulic state of the containment, but potentially increased hydrogen concentration and thus led to predicted hydrogen combustion. These two adverse effects could be threats for FP leakage into the environment and release of FPs into the environment.
In future work, practical combinations of individual mitigation measures need to be evaluated in detail. In the long run, innovative countermeasures need to be developed to minimize adverse effects inducing hydrogen risk, FP leakage into the environment, and rupture.
| Nomenclature | ||
| Acronym | = | Description |
| AFW | = | Auxiliary feedwater |
| ADV | = | Atmospheric dump valve |
| CDV | = | Containment dump valve |
| CET | = | Core exit temperature |
| CNMT | = | Containment |
| CV | = | Control volume |
| FP | = | Fission product |
| FSAR | = | Final Safety Analysis Report |
| HPSI | = | High-pressure safety injection |
| MCCI | = | Molten core–concrete interaction |
| MFW | = | Main feedwater |
| NPP | = | Nuclear power plant |
| NRC | = | United States Nuclear Regulatory Commission |
| OECD | = | Organization for Economic Co-operation and Development |
| OPR1000 | = | Optimized Power Reactor 1000 MWe |
| PAR | = | Passive autocatalytic recombiner |
| PSRV | = | Pressurizer safety relief valve |
| PWR | = | Pressurizer water reactor |
| RCS | = | Reactor coolant system |
| RPV | = | Reactor pressure valve |
| RWST | = | Reactor water storage tank |
| SA | = | Severe accident |
| SAM | = | Severe accident management |
| SAMG | = | Severe accident management guidance |
| SBLOCA | = | Small-break loss-of-coolant accident |
| SBO | = | Station blackout |
| SDS | = | Safety depressurization system |
| SG | = | Steam generator |
| SGTR | = | Steam generator tube rupture |
| SI | = | Safety injection |
| SIT | = | Safety injection tank |
| SSC | = | Secondary side cooling |
| TLOFW | = | Total loss of feedwater |
| TSC | = | Technical support center |
Acknowledgments
This work was supported by the research fund of Hanyang University [grant number HY-2013-G].
Disclosure statement
No potential conflict of interest was reported by the authors.
Additional information
Funding
References
- National Diet of Japan Fukushima Nuclear Accident Independent Investigation Commission. The official report of the Fukushima nuclear accident independent investigation commission.: National Diet of Japan Fukushima Nuclear Accident Independent Investigation Commission; 2012.
- Korea Nuclear Society. Analysis of Fukushima nuclear power plant accident. Daejeon: Korea Nuclear Society; 2013.
- American Nuclear Society. Fukushima Daiichi: ANS Committee report. La Grange Park (IL): American Nuclear Society; 2012.
- International Atomic Energy Agency. Vienna ceclaration on nuclear safety. Vienna: International Atomic Energy Agency; 2015.
- Gauntt RO, Cole R, Hodge S, et al. MELCOR computer code manual version 1.8.6. Washington (DC): Nuclear Regulatory Commission; 2005. ( Report No. NUREG/CR-6119)
- Idaho National Engineering and Environmental Laboratory. SCDAP/RELAP5-3D code manual bolume3: user's guide and input manual. Idaho Falls: Idaho National Engineering and Environmental Laboratory; 2003.
- Electric Power Research Institute. MAAP4 applications guidance desktop reference for using MAAP4 software. Palo Alto: Electric Power Research Institute; 2010.
- Park R-J, Kim S-B, Kim H-D. Evaluation of the RCS depressurization strategy for the high pressure sequences by using SCDAP/RELAP5. Ann Nucl Energy. 2008;35:150–157.
- Park R-J, Kim S-B, Hong S-W, et al. Detailed evaluation of coolant injection into the reactor vessel with RCS depressurization for high pressure sequences. Nucl Eng Des. 2009; 239:2484–2490.
- Lee BC, Jeong JH, Na MG. Effects of accident management strategy on the severe accident environmental conditions. Ann Nucl Energy. 2006;33:13–21.
- Seo S, Lee Y, Lee S, et al. Effectiveness and adverse effects of reactor coolant system depressurization strategy with various severe accident management guidance entry conditions for OPR1000. J Nucl Sci Technol. 2015;52:695–708.
- Lee Y, Choi W, Seo S, et al. Development of safety injection flow map associated with target depressurization for effective severe accident management of OPR1000. J Nucl Sci Technol. 2016;53:1–11.
- Stefanova AE, Gencheva RV, Groudev PP. Analytical validation of operator actions based on SAMG for VVER 1000 with ASTECv2r3 computer code. Nucl Eng Des. 2015;281:131–141.
- Park R-J, Kang K-H, Ha KS, et al. Detailed analysis of a severe accident progression for an evaluation of in-vessel corium retention estimation in KSNP. Daejeon: Korea Atomic Energy Research Institute; 2005.
- Korea Atomic Energy Research Institute. Development of accident management guidance for Korean standard nuclear power plant. Daejeon: Korea Atomic Energy Research Institute; 2000.
- Lee S, Ha KS, Kim H-Y, Kim SJ. Validation of RCS depressurization strategy and core coolability map for independent scenarios of SBLOCA, SBO, and TLOFW. J Nucl Sci Technol. 2014;51:181–195.
- Ahn K-I, Park S-Y. Development of a risk-informed accident diagnosis and prognosis system to support severe accident management. Nucl Eng Des. 2009; 239:2119–2133.
- Huh C, Suh N, Park G-C. Optimum RCS depressurization strategy for effective severe accident management of station black out accident. Nucl Eng Des. 2009;239:2521–2529.
- Shapiro ZM, Moffette TR. Hydrogen flammability data and applications to PWR LOCA. Pittsburgh: Westinghouse Electric Corporation; 1957. ( Report No.WAPD-SC-545)
- OECD/NEA. Status report on hydrogen management and related computer codes. Paris: OECD/NEA; 2014. ( Report No. NEA/CSNI/R(2014)8)
- Billy W, Marchall J. Hydrogen:air: steam flammability limits and combustion characteristics in the FITS Vessel. Washington (DC): Nuclear Regulatory Committee; 1986. ( Report No. NUREG/CR-3468)