
 ?Mathematical formulae have been encoded as MathML and are displayed in this HTML version using MathJax in order to improve their display. Uncheck the box to turn MathJax off. This feature requires Javascript. Click on a formula to zoom.
ABSTRACT
Measured isotopic compositions of UO2 and MOX fuel samples taken from irradiated light water reactor fuel assemblies were analyzed by CASMO5 coupled with a JENDL-4.0 base library to assess the uncertainties in the calculated isotopic compositions on heavy and fission product nuclides. The burnup calculations for the analysis were performed based on a single-assembly model taking into account the detail fuel assembly specifications and irradiation histories. For the MOX fuel samples, a multiple-assembly model was also adopted taking into account the effect of the surrounding UO2 fuel assemblies. The average and standard deviation of the biases (C/E − 1's (here C and E are calculated and measured results, respectively)) were calculated for each nuclide separately on the PWR and BWR UO2 fuel samples. The averaged biases for 235U, 236U, 239Pu, 240Pu, 241Pu and 242Pu were 2.7%, −0.9%, 0.3%, 0.7%, −2.4% and −1.7% for PWR UO2 samples, and 6.7%, −1.5%, 2.5%, −0.6%, 0.4% and −0.1% for BWR UO2 samples, respectively. The biases with the single-assembly model on the MOX fuel samples showed large positive values of 239Pu, and application of the multiple-assembly model reduced the biases as reported in our previous studies.
1. Introduction
The lattice physics code CASMO5 [Citation1] has been developed by Studsvik Scandpower for various analyses on light water reactor fuel including preparing nuclear libraries for core-analysis nodal codes such as SIMULATE-5 [Citation2]. An important function of CASMO5 is burnup calculation to estimate isotopic compositions in nuclear fuel during irradiation. The calculations are performed using the burnup chains consisting of heavy, fission product and burnable absorber nuclides. The burnup chains used by CASMO5 include 45 heavy nuclides and 200 fission product nuclides. For these nuclides, the neutron cross-sections in 586 energy groups are prepared for the nuclear library which includes the fission yield data for about 30 heavy nuclides.
JENDL-4.0 [Citation3] is the latest evaluated nuclear data library that has been developed by the Japan Atomic Energy Agency under the collaboration with some of Japanese research institutes and has been widely used in various nuclear fields. In this study, therefore, a CASMO5 nuclear library based on JENDL-4.0 was selected from some alternative libraries which had been provided by Studsvik Scandpower. The JENDL-4.0 base library has been demonstrated on the validity of the neutron cross-section library based on typical critical experiments [Citation4].
Constants in nuclear libraries used in core-analysis nodal codes are basically described by macroscopic cross-sections which are defined by the products of atomic number densities and effective microscopic cross-sections for nuclides composing irradiated fuel and structure materials in a reactor core. Uncertainties in atomic number densities calculated by a lattice physics code propagate through nuclear libraries of core-analysis nodal codes to those in core characteristics such as reactivity, a power distribution, reactivity coefficients, kinetic parameters and others. When a lattice physics code is used to calculate atomic number densities of spent nuclear fuel for the analysis of criticality of nuclear facilities such as spent nuclear fuel pools, transportation systems and so on, uncertainties in calculated isotopic compositions are directly related to those in the calculated reactivity of these facilities. The isotopic compositions of spent nuclear fuel are also used as the source terms in the radiation shielding and thermal analysis of those facilities.
It is important to assess uncertainties in isotopic compositions calculated by lattice physics codes for their application in core analysis, criticality analysis of nuclear facilities and other fields. For this purpose, the comparison of calculated isotopic compositions with measured results is necessary. Consequently, extensive efforts have been dedicated to obtain reliable measurement data of isotopic compositions of irradiated fuel in international and domestic experimental programs. Some of them are overviewed in Ref. [Citation5]. There are uncertainties in measured isotopic compositions, specifications of irradiated fuel, irradiation histories, and modeling of the fuel and irradiation histories in burnup calculations, the physics models and nuclear libraries of lattice physics codes and so on. It is, therefore, necessary to accumulate comparison results between the measured and calculated results and statistically obtain the reliable estimations of the biases and their uncertainties in the calculated isotopic compositions. Such studies have been performed by Gauld et al. [Citation6] for PWR UO2 fuel and Yamamoto [Citation7] for PWR and BWR UO2 fuel.
The purpose of this study is to analyze the comprehensive measured isotopic compositions of UO2 and MOX fuel samples taken from irradiate fuel assemblies of light water reactors by using CASMO5 coupled with the JENDL-4.0 base library, and to obtain the biases (C/E − 1's) and their uncertainties. Section 2 describes the measurement data, Section 3 the calculation models and conditions, and Section 4 the calculated results and discussions. Section 5 mentions the conclusions.
2. Measured isotopic compositions of irradiated fuels
In this study, measured isotopic compositions of irradiated fuels were taken from the references which were published after 2000, considering the advancement of measurement technology. They have been already analyzed by using detail analysis codes such as two dimensional lattice physics codes with multi-neutron-energy group libraries and the quality of the measurement data has been already characterized. lists the data sets analyzed in this study. It shows the data set IDs, the plant names, assembly types, fuel types, fuel enrichments, sample burnups, numbers of fuel samples including information on radial locations of fuel rods in fuel assemblies from which the fuel samples were taken, and the references. The total numbers of samples are 33 for PWR UO2 fuel, 29 for BWR UO2 fuel, 1 for PWR MOX fuel and 4 for BWR MOX fuel. The measured nuclides are isotopes of U, Np, Pu, Am and Cm for heavy nuclides and Sr, Mo, Tc, Ru, Rh, Ag, Sb, I, Cs, La, Ce, Nd, Pm, Sm and Gd for fission product nuclides. Typical analytical methods applied to the measurements are outlined in [Citation5]. The measurement results are given in a unit of g/TIHM (grams per ton of initial heavy metal) for the samples relevant to Takahama-3, Ohi-1, Ohi-2, Vandelos and Fukushima-daini-2, a unit of mg/gfuel (milligrams per gram of fuel) for those Gösgen and GKN II, and a unit of at/totU (atoms per total U atoms) for those Fukushima-daini-1.
Table 1. Measurement data sets on UO2 and MOX fuels of light water reactors.
Table 2. Typical analytical methods applied in the isotopic compositions [Citation5].
The samples of the Takahama-3 data set were taken from various axial heights of three different fuel rods, two of which were taken from a two-cycle irradiated 17×17 fuel assembly and one of which from a three-cycle irradiated17×17 fuel assembly. The range of burnups of those samples covers lower-to-middle burnups for typical PWR fuel in this study. Among the samples, SF96-1 and SF97-1 were not analyzed in this study since the samples were close to the top end of the effective fuel and the authors [Citation8] did not recommend using them for code validation.
3. Calculation model and condition
3.1. UO2 fuel
In the burnup calculations for the UO2 fuel samples, a two-dimensional single-assembly model (hereafter referred to as the ‘single-assembly model’) with a reflective boundary condition was adopted. This geometrical model of lattice physics code analysis has been generally used in preparing nuclear libraries of core-analysis nodal codes for light water reactor core analysis. The geometrical and material specifications of the assemblies and the temperatures of materials composing the assemblies were taken from the relevant references.
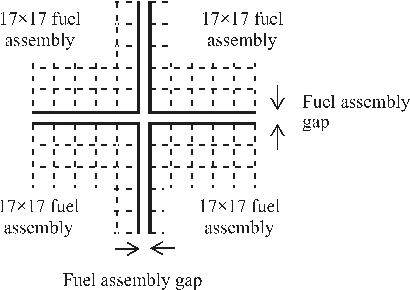
It is known that there exists a small gap between PWR fuel assemblies, which is illustrated in , and taking it into account in burnup calculations influences the moderation ratio for the fuel rods especially close to the peripheral of the fuel assembly and then their isotopic compositions of major U and Pu isotopes. Though it was not available in Refs [Citation8,Citation9] for the 17×17 assemblies in Takahama-3, Ohi-1 and Ohi-2, their gaps were assumed to be 0.084 cm referring to the specifications of the 17×17 assemblies of Vandellos [Citation13]. The effect of the gap between assemblies on the analysis of fuel samples of Takahama-3 will be discussed in the later section.
Figure 1. Illustration of fuel assembly gaps between 17×17 fuel assemblies. The cells in the assemblies show the locations of fuel rods and guide tubes for control rods and instruments.
Most of fuel rods from which fuel samples were taken were irradiated in the same fuel assemblies except the following two data sets [Citation12,Citation13]. One (GU1) of the PWR UO2 samples of the GU data set [Citation12] which was irradiated in Gösgen was taken from one fuel rod in a four-cycle irradiated 15×15 fuel assembly with 3.5 wt% initial enrichment. The location of the fuel rod in the assembly is shown in . In the third and fourth cycles, some of fuel rods adjacent to the relevant fuel rod were replaced by those which had been irradiated in the other fuel assembly and had higher burnups. The other two of samples (GU3 and GU4) with 4.1 wt% initial enrichment of the GU data set were taken from different axial positions of one fuel rod in a three-cycle-irradiated 15×15 fuel assembly. In the first and second cycles, the fuel rod was irradiated in a fuel assembly with 4.1 wt% initial enrichment, and in the third cycle, it were inserted in the other one-cycle-irradiation fuel assembly with 4.3 wt% initial enrichment at a positon different from that in the previous fuel assembly. The locations of the fuel rod in the assemblies are shown in . In the burnup calculations of this study, the relevant fuel rods were assumed to be irradiated in the same fuel assemblies where their irradiation started due to the limitation in applying the calculation code.
Figure 2. Locations of the fuel rods from which the fuel samples of the GU data set (GU1, GU2 and GU3 fuel samples) in the 15×15 fuel assemblies irradiated in Gösgen [Citation12]. ‘A’ shows the location of the fuel rod for GU1. ‘B’ shows the location of the fuel rod for GU2 and GU3 in the first and second cycles and ‘C’ that in the third cycle.
![Figure 2. Locations of the fuel rods from which the fuel samples of the GU data set (GU1, GU2 and GU3 fuel samples) in the 15×15 fuel assemblies irradiated in Gösgen [Citation12]. ‘A’ shows the location of the fuel rod for GU1. ‘B’ shows the location of the fuel rod for GU2 and GU3 in the first and second cycles and ‘C’ that in the third cycle.](/cms/asset/7981e5c1-f32f-4a0b-8de3-1fb82b9c2f25/tnst_a_1273802_f0002_oc.jpg)
The PWR UO2 samples of the Vandellos data set [Citation13] were taken from three fuel rods which were irradiated for five cycles. In the first four cycles, two of the fuel rods were irradiated at side positons in one fuel assembly and the other rod at a side position in the other fuel assembly as shown in . In the fifth cycle, the three fuel rods were inserted in a different assembly, where the positions of the fuel rods were inside of the assembly and adjacent to guide tubes. In the burnup calculations of this study, the relevant fuel rods were assumed to be irradiated in the same fuel assemblies where their irradiation started.
Figure 3. Locations of the fuel rods from which the fuel samples of the Vandellos data set. ‘A,’ ‘B’ and ‘C’ shows the locations in the first four cycles and ‘D,’ ‘E’ and ‘F’ those in the fifth cycle [Citation13].
![Figure 3. Locations of the fuel rods from which the fuel samples of the Vandellos data set. ‘A,’ ‘B’ and ‘C’ shows the locations in the first four cycles and ‘D,’ ‘E’ and ‘F’ those in the fifth cycle [Citation13].](/cms/asset/222c530c-3154-453f-a444-633da56b3de1/tnst_a_1273802_f0003_oc.jpg)
As mentioned above, the burnup calculations of the fuel samples of the GU and Vandellos data sets were performed under the conditions partly different from the actual irradiation conditions. Especially, the positions of fuel rods from which the fuel samples GU3 and GU4 of the GU data set and all samples of the Vandellos data set were changed in the fuel assemblies and the moderation ratios around the fuel rods were modified. In order to quantify the influence of the differences in the irradiation conditions on the calculated isotopic compositions, further detail analysis is necessary. It is noted that the calculation results of the isotopic compositions relevant to those data sets in this study include the biases due to the differences in the irradiation conditions.
The irradiation histories of boron concentration in a moderator for PWR assemblies, and those of in-channel void fractions for BWR assemblies were also taken from the relevant references. In burnup calculation of a fuel assembly, an assembly average power history is a necessary input. In most cases, the references gave the power histories of the fuel samples. They were regarded as the assembly average power histories for the initial guesses in the preliminary burnup calculations, and then those histories were modified by multiplying constants so that the burnup of the fuel rod relevant to the fuel samples equaled to those measured burnups. In the most data sets, this process gave good agreement between the calculated and measured isotopic compositions in 148Nd since the evaluation of the sample burnups were performed using the 148Nd method [Citation18]. However, for two samples of the data sets of KLU [Citation16], the calculated compositions of 148Nd were smaller by 4 - 6 % than those of measurements after adjusting the sample burnups. These differences were prominent compared with the other data sets. Therefore, relying on the measured isotopic compositions of 148Nd as a burnup indicator nuclide rather than the reported sample burnup, burnup calculations were performed so that the calculated isotopic compositions of 148Nd equaled to those measured for these samples and the comparison results of C/E − 1 for 148Nd were excluded for the statistical process for the uncertainty analysis.
3.2. MOX fuel
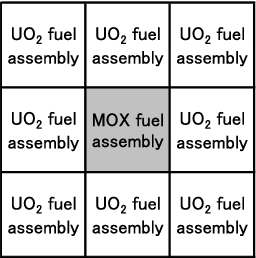
The previous studies [Citation10,Citation17] have indicated that MOX assemblies, from which the MOX fuel samples were taken, were irradiated in MOX-fuel-assembly partially loaded cores and the compositions of some of nuclides in the MOX fuel are significantly influenced by UO2 fuel assemblies adjacent to the MOX assemblies since the neuron energy spectra in the MOX assemblies under such condition are different from those in infinite MOX assembly calculations. Therefore, in addition to the single-assembly model, a two-dimensional 3×3 assembly model (hereafter referred to as the ‘multiple-assembly model’) was applied to the burnup calculations. It consists of one MOX assembly at the center position and eight UO2 fuel assemblies at the other surrounding positions as shown in , and the boundary condition was assumed to be reflective. While the atomic densities in the surrounding UO2 fuel assemblies were fixed during irradiation in the previous studies [Citation10,Citation17], in this study the burnup calculations were also applied to the surrounding UO2 assemblies in addition to the MOX assembly which made possible simulation of burnup of UO2 fuel assemblies adjoining the MOX fuel assembly. The irradiation reports for the PWR-GGM and BWR-GRM data sets [Citation10,Citation17] gave the fuel assembly types, assembly average initial enrichments and assembly average burnups at the beginning and end of each irradiation cycle.
Figure 4. Illustration of the assembly configuration in the multiple-assembly model.
4. Calculated results and discussions
It was expected that the biases (C/E − 1's) and their uncertainties in the isotopic compositions calculated by CASMO5 were different for UO2 or MOX fuel samples and also for PWR or BWR fuel samples. They were, therefore, classified into those of PWR UO2, BWR UO2, PWR MOX and BWR MOX fuel. The following sections described the results and discussions on the results in the order of PWR and BWR UO2 fuel, and PWR and BWR MOX fuel. After these sections, discussions on the effect of a gap between PWR fuel assemblies, the sample burnups of the data sets of SF-95 and SF-96 of Takahama-3 and the trends of C/E − 1's in axial and radial directions of fuel assemblies are mentioned.
4.1. UO2 fuel
For each sample, the C/E − 1's in percent were calculated for the measured nuclides. For each nuclide, the average value and standard deviation of C/E − 1's were calculated separately for the PWR and BWR UO2 samples.
They are summarized in for heavy nuclides and for fission product nuclides with the number of samples.
Table 3. Numbers of samples, averages and standard deviations (%) of C/E − 1's for actinide nuclides on the UO2 samples.
Table 4. Numbers of samples, averages and standard deviations (%) of C/E − 1's for fission product nuclides on UO2 samples.
For each nuclide, all the C/E − 1's were plotted in a figure with a horizontal axis of the sample burnups separately for the PWR and BWR UO2 samples. They are shown in Figure S1 on actinide nuclides and Figure S2 on fission product nuclides in the online supplemental material accompanying this manuscript. The left side shows the results for the PWR UO2 fuel samples and the right side the BWR UO2 fuel samples. In the figures, the error bars on the C/E − 1's shows an uncertainties propagated from the measurement uncertainties and were obtained bywhere ΔE/E is the measurement uncertainty (one σ) in percent. The following shows observations and discussions on the C/E − 1's and their uncertainties for each nuclide.
4.1.1. U and Np isotopes
The deviations of C/E − 1's are relatively larger for 234U among U isotopes and the averages are positive for both PWR and BWR fuel samples. The atomic density of 234U decreases during irradiation by neutron capture. The atomic density of 234U is about a half of the initial one at 60 GWd/t for light water reactor UO2 fuel. The deviations of C/E − 1's is, therefore, caused by the uncertainties in the neutron capture cross-sections and the initial compositions which is very small compared with 235U and 238U. The difficulty in measurements of such small density isotopes may be one of causes of the deviations. The relatively large deviations for some samples of the 9×9-9Ac data are also observed in our previous studies [Citation14,Citation15].
The deviations of C/E − 1's are relatively small for 235U for the low burnup samples in the PWR and BWR fuel samples, and they look like increasing with the burnups especially for the BWR fuel samples. The averages of C/E − 1's are about 3% for the PWR fuel samples and 6% for the BWR fuel samples. The positive value for the PWR fuel samples may be correlated to underestimation of 148Nd, which is discussed in the later section. The relatively large deviation is seen with the sample of 61 GWd/t in the 9×9-9Ac data set of BWR fuel, which was taken from a corner rod of the assembly. This deviation is also seen in the previous studies [Citation15] and will be discussed in the later section.
The atoms of 236U are created by neutron capture of 235U during irradiation and decrease of them is relatively small because of the small neutron capture cross-sections. The relatively small deviations of C/E − 1's reflect the well-known initial enrichment and the capture cross-sections of 235U. The atomic density of 238U decreases during irradiation by neutron capture. The atomic density of 238U is about 96% of the initial one at 60 GWd/t for light water reactor UO2 fuel. The small change in the atomic density is the reason for the small deviations of C/E − 1's.
The deviations of C/E − 1's of 237Np are relatively large and the averages of C/E − 1's are −7% and −4% for the PWR and BWR fuel samples, respectively. The deviations of the four samples of the SF96 (Gd2O3) data set of PWR fuel [Citation8] ranged from 25% to 42% at burnups of 16 to 29 GWd/t and distantly located from the others which scattered around −10% to 0%. This was also observed in the previous studies [Citation6, Citation7]. The measured results may have systematic uncertainties larger than the reported value of 10%. The C/E − 1's for those samples are not shown in Figure S1 and not taken into account in this study.
4.1.2. Pu isotopes
The averages and standard deviations of C/E − 1's are relatively small for Pu isotopes except 238Pu. The atoms of 239Pu and higher Pu isotopes are produced by neutron capture of the initial atoms of 238U and eliminated by fission and neutron capture. The smaller deviations means that the transformation in this chain were well calculated by CASMO5. On the other hand, the major part of 238Pu atoms are produced by the chain 235U(n, γ)236U(n, γ)237U(β−decay)237Np(n, γ)238Np(β−decay)238Pu and eliminated by neutron capture and β− decay of itself. The fact that the measurements with the mass spectrometry has difficulty due to the interference of atoms of 238U as an isobar of 238Pu would be one of the causes of the relative large deviations.
4.1.3. Am and Cm isotopes
The isotopes of Am and Cm are created from 238U through the long burnup chains and, therefore, their amounts are generally small. The large deviations of C/E − 1's would be due to difficulties in the burnup calculations which include many minor actinide isotopes in the burnup chains. There would be also difficulties in the measurements which treat small amount of isotopes.
In our previous studies [Citation10,Citation11], the calculated results of 241Am showed the C/E − 1's larger than 20% for the measurement results of SCK-CEN in the GGU and GKN II data sets [Citation10,Citation11]. The measurements were performed after four to five years since the fuel assemblies were discharged. The major part of 241Am atoms at the measurement has been created by the decay of 241Pu (half-life: 14.29 y). The measured isotopic compositions of 241Pu were estimated by the calculations with 2%–4% of C/E − 1's. The large C/E − 1's of 241Am was inconsistent with those of 241Pu. Furthermore, the measurement results of CEA in the GGU data set did not showed such discrepancy with the calculated results. Therefore the measured results of 241Am reported by SCK-CEN for one sample in the GGU data set and the GKN II data set were not adopted in this study.
4.1.4. Isotopes from Sr to I
Among Sr to I isotopes, 90Sr, 106Ru, 125Sb and 129I are radioactive fission product nuclides of medium to long half-lives. The number of samples for 106Ru and 125Sb is relatively large; however, the deviations of C/E − 1's are large. Some of results of 106Ru and 125Sb for the PWR and BWR fuel samples in the data sets reported by Nakahara et al. [Citation8] show large values than those of the other data sets. They commented that the reported results of 106Ru and 125Sb showed smaller values compared with those of the nondestructive measurement because of their lack of solubility in the dissolution of the fuel [Citation8] in the preparation of the sample for the gamma spectrometry. The averages and standard deviations of C/E − 1's, therefore, include the systematic uncertainties due to these measurement results, which are also as discussed by Gauld et al. [Citation6]. The number of measurements of 129I is small due to its volatility which causes difficulty in the measurement.
The isotopes 95Mo, 99Tc, 101Ru, 103Rh and 109Ag are stable or long half-life nuclides. They belong to the burnup credit fission product nuclides which have relatively large negative reactivity in light water reactor spent fuel because of their relatively large thermal capture cross-sections and fission yields. The number of data is small and the deviations of C/E − 1's are large. They belong to metallic fission product elements and have difficulty in dissolution of the fuel in acid solution in the measurement procedure. This may be one of the causes of the deviation of the C/E − 1's.
4.1.5. Isotopes from Cs to Ce
Cesium-133 is a stable isotope and one of the burnup credit fission product nuclides. The deviation of C/E − 1's are relatively small. Cesium-134 and -137 are important radioactive nuclides. The number of data is large and the deviations of C/E − 1's are also small. Lantanide-139, Cerium-140 and -142 are stable nuclides and have relatively small neutron capture cross-section; therefore, their atomic densities are almost proportional to the number of fissions in the fuel, and they are regarded as burnup indicators. The relatively large deviations of C/E − 1's for 144Ce may be caused by the difficulty in the measurements in terms of its small atomic density due to its relatively short half-live (284.9 d).
4.1.6. Nd isotopes
Among Nd isotopes, 145Nd, 146Nd, 148Nd and 150Nd are typical burnup indicators so that the deviations of C/E − 1's are relatively small since the burnup calculations were carried out to reproduce the measured sample burnups shown in the references. Neodymium-143 and -145 are the burnup credit fission product nuclides since they have relatively large neutron capture cross-sections. The measurement technique for these isotopes is most reliable among fission product nuclides which reflects to small standard deviations of C/E − 1's.
4.1.7. Pm and Sm isotopes
Promethium-147 is radioactive fission product nuclide with a relatively small half-live (2.6234 y) which makes the atomic density small at the measurements. Among Sm isotopes, 147Sm, 149Sm, 150Sm 151Sm and 152Sm are the burnup credit fission product nuclides since they have relatively large neutron capture cross-sections. The standard deviations of C/E − 1's are almost less than 10% for Sm isotopes.
4.1.8. Eu and Gd isotopes
Among Eu isotopes, 154Eu and 155Eu are radioactive fission product nuclides. Europium-153 and Gadolinium-155 are stable and the burnup credit fission product nuclides. Among the BWR fuel samples, one of the 9×9-9FP data set (at the sample burnup of 28 GWd/t) and one of the 9×9-9Ac data set (at the sample burnup of 54 GWd/t) are the measurement results of UO2 fuel loaded with Gd2O3. For those samples, the number densities of 154Gd, 156Gd, 158Gd and 160Gd at the measurements are larger than the other Gd isotopes and the deviations of the C/E − 1's are less than 10%. Except those samples, the dispersions of C/E − 1's of Gd isotopes are generally large for the PWR and BWR fuel samples, and one of the reasons would be the difficulty in the measurements of the small isotopic densities due to the small fission yields.
4.2. MOX fuel
The numbers of samples of MOX fuels analyzed in this study were one for PWR fuel and four for BWR fuel. and show the C/E − 1's of the single-assembly and multiple-assembly models for the GGM sample of the Gösgen PWR MOX fuel [Citation10] and the averages and their uncertainties of C/E − 1's of the four GRM samples of the Gundremmingen BWR MOX fuel [Citation17].
Table 5. C/E − 1's and uncertainties (%) in C/E − 1's for the PWR GGM MOX sample, and averages and standard deviations (%) of C/E − 1's for the BWR GRM MOX samples on actinide nuclides for the single-assembly (Single A) and multiple-assembly models (Multi. A).
Table 6. C/E − 1's and uncertainties (%) in C/E − 1's for the PWR GGM MOX sample, and averages and standard deviations (%) of C/E − 1's for the BWR GRM MOX samples on fission product nuclides for the single-assembly (Single A) and multiple-assembly (Multi. A) models.
The figures of C/E − 1's with a horizontal axis of sample burnups are shown in Figure S3 on actinide and fission product nuclides in the online supplemental material accompanying this manuscript.
Generally speaking, the deviations of C/E − 1's looks smaller than those for the UO2 samples as seen in and , and Figure S3. This would be because the measured results of the MOX samples were taken from the experimental program recently implemented and the measurement technology had been advanced. The advantage of the multiple-assembly model over the single-assembly model was similar to those reported by the previous studies [Citation10,Citation17].
4.2.1. U and Np isotopes
The deviations of C/E − 1's among one PWR and four BWR MOX fuel samples for Uranium isotopes are relatively small. The values of C/E − 1's are positive for 235U and negative for 236U for both PWR and BWR MOX fuel samples. Applying the multiple-assembly model to 237Np reduce C/E − 1's by about 10% and improve the agreement between the calculated and measured results. The neuron energy spectrum in the MOX assembly was softened by the surrounding UO2 assemblies, which enhanced the elimination of 237Np by neutron capture.
4.2.2. Pu isotopes
In contrast to UO2 fuel, the major change in the atomic compositions of 238Pu during irradiation consists of the elimination by neutron capture and β− decay of itself, and the production in the chain 241Am(n, γ)242mAm(β−decay)242Cm(α-decay)238Pu. Since the atoms of 238Pu and 241Am exist in the initial MOX fuel, the number density of 238Pu is considerably larger than that in irradiated UO2 fuel. It may make the measurement of 238Pu more reliable and the deviations of C/E − 1's relatively smaller than those of the UO2 fuel samples.
The calculated results with the single-assembly model generally shows significant large C/E − 1's for 239Pu. Applying the multiple-assembly model reduces C/E − 1's by about 10%. The major change in the atomic compositions of 239Pu is due to decrease by fission and neutron capture, and the production from 238U by neutron capture. The softened neuron energy spectrum causes an increase in the elimination and a decrease in the production. The influence on the calculated results of 240Pu, 241Pu and 242Pu by the multiple-assembly model was relatively small. Their number densities increase by neutron capture of 239Pu, 240Pu and 241Pu, respectively, while they decrease by neutron capture or fission of themselves. The softened neutron energy spectrum affects both sides and compensates each other. The average of C/E − 1's of 239Pu for the BWR samples was about 10% with the multiple-assembly model.
As seen in Figure S3 there are two measurement results at 69.9 GWd/t and 70.1 GWd/t around 70 GWd/t of the sample burnup. Even though the samples were taken from different fuel rods which located at symmetry positions in the radial Pu enrichment distribution of fuel rods, the initial Pu enrichment was same and the axial positions were close to each other. The both measurement data were also taken at the same institute for two different experimental programs, REBUS and MALIBU [Citation10]. It was expected that the C/E − 1's were almost same for the both sample; however, the differences of about 10% were observed for the results of 239Pu for both calculation models. The similar differences were also observed for 237Np 242mAm, 249Cm, 149Sm and 151Sm in this study and also the previous study [Citation10]. Closely looking at the C/E − 1's of Nd isotopes in Figures S3, those of the 69.9 GWd/t-sample shows a few percent lower than those of the 70.1 GWd/t sample. When the burnup of the 69.9 GWd/t sample was increased for the C/E − 1 of 148Nd to be equal to that of the 70.1 GWd/t-sample, the C/E − 1 of 239Pu decreased by a few percent according to a sensitivity analysis. This indicates inconsistency in the burnup determination for the two samples. The other source of the differences would be systematic measurement errors other than the reported ones. Even after applying the multi-assembly model, the calculated results of 239Pu for the BWR MOX fuel samples overestimate the measurements.
4.2.3. Am and Cm isotopes
The values of C/E − 1's of 241Am, 242Am and 243Am show relatively large values for the PWR and BWR MOX fuel samples. This was also observed in the previous study [Citation10,Citation17]. Possible systematic uncertainties in the measurement results, which were unique to the measurements of SCK-CEN, were also discussed in the previous section. In the analysis of the UO2 fuel samples, some of the C/E − 1's with the SCK-CEN measurements for Am isotopes were excluded in the figures and the statistics shown in the tables since they showed considerable large values; however, all the values are shown in the figures and tables for the MOX fuel samples as the references. Applying the multi-assembly model improves the agreement between the calculated and measured results for Am isotopes with some exceptions; however, it is not clear for Cm isotopes.
4.2.4. Fission product isotopes
Among fission product nuclides, the number densities of 149Sm, 151Sm and 154Eu are influenced by applying the multiple assembly model since they have large thermal neutron capture cross-sections, 40.54×10³ b, 15.16×10³ b and 1.353×10³ b, respectively, and the softened neutron energy spectrum enhance their elimination. The effect reduces their C/E − 1's. Those of 144Ce and 147Pm increase by applying the multiple-assembly model. These isotopes have the half-lives of 284.91 d and 2.6234 y, respectively. Their atomic densities are saturated during irradiation, and their equilibrium densities may be influenced by the softened neutron energy spectrum.
4.3. Other discussions
4.3.1. Effect of a gap between PWR fuel assemblies
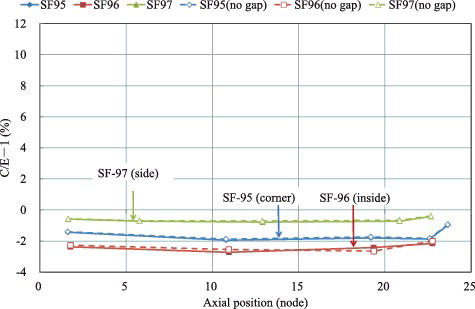
As mentioned in the previous section, the gap of 0.084 cm between fuel assemblies were applied for the analysis of the 17×17 UO2 assemblies of Takahama-3 [Citation8], Ohi-1 and Ohi-2 [Citation9]. In order to confirm the validity of this treatment, the analysis results were compared with those calculated with no gap. The comparison of C/E − 1's between the burnup calculations with the gap and those with no gap was performed for the results of 235U, 239Pu and 148Nd. The first two of them are important nuclides in terms of reactivity calculations, and their compositions are strongly influenced by the neutron energy spectrum. The third is a typical burnup indicator nuclide, which was reviewed for the confirmation of the integrity of the calculations. , and show the comparison results for 235U, 239Pu and 148Nd, respectively, for the data sets of SF-95, SF-97 and SF-96 of Takahama-3. The samples of SF-95 were taken from a corner rod, those of SF-97 from a side rod at the middle of the side, and those of SF-96 from a three-layer inside rod and also a Gd2O3-loaded rod. The horizontal axis of the figures shows the axial position of the sample in the fuel rod. The unit of the axial position is shown in a unit of node defined by a 24th of the effective fuel length. As shown in the figures, significant effect of the gap appears in the samples of the corner rod (SF-95) for 239Pu and 235U and it improves the trend in C/E − 1's. As expected, the results of 148Nd are not influenced since the sample burnups were reproduced by both calculations with the gap existing and no gap. The obtained results were consisted with those in the previous study [Citation5].
Figure 5. Effect of a gap between PWR fuel assemblies on C/E−1's of 235U for the data sets of Takahama-3 (PWR).
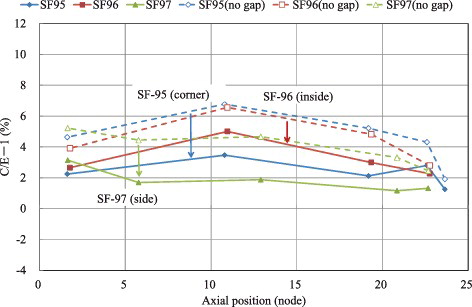
Figure 6. Effect of a gap between PWR fuel assemblies on C/E−1's of 239Pu for the data sets of Takahama-3 (PWR).
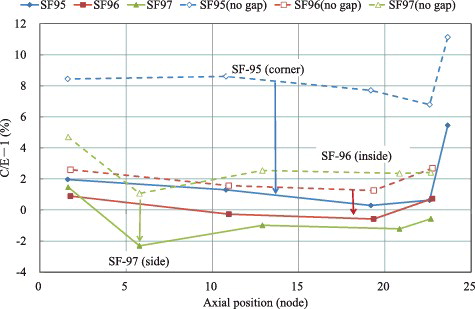
Figure 7. Effect of a gap between PWR fuel assemblies on C/E−1's of 148Nd for the data sets of Takahama-3 (PWR).
4.3.2. Sample burnups of the data sets of SF-95 and SF-96 of Takahama-3
Among the PWR fuel samples, one thing noticed in the analysis results for the samples of SF-95 and SF-96 data sets is systematic underestimation of 148Nd by 2 to 3% as seen in . This trend is also seen in the analysis results of 145Nd, 146Nd and 150Nd of the other burnup indicator nuclides as shown in Figure S2. In the 148Nd method [Citation18], which was applied to the determination of sample burnups of the SF-95, SF-96 and SF-97, the measured isotopic compositions of 148Nd and heavy isotopes, and the calculated effective fission yield of 148Nd were used to obtain the sample burnup in a unit of FIMA (fission per initial metal atom) [Citation8]. For converting FIMA to burnup in a unit of energy per initial metal weight, the calculated energy release per fission was also used. Even though the burnup calculations reproduce the measured sample burnups, the C/E − 1's of 148Nd are not always zero when there are differences in the effective fission yield of 148Nd and the energy release per fission between those used in the determination of measured sample burnup and those used in the burnup calculations with CASMO5.
The C/E − 1's of 148Nd and 235U are correlated as seen in and . If the burnup is increase so that the C/E − 1's of 148Nd reach to zero, those of 235U will decrease toward to zero. Under the condition that 235U atoms were eliminated only by fission, relative deviation of the number density of 235U after irradiation, ΔN235/N235, can be connected to that of 148Nd, ΔN148/N148, as
where N0235 and N235 are the initial number density of 235U and that after the irradiation, respectively. This correlation indicates that the increase in the C/E − 1's of 148Nd makes decrease in the C/E − 1's of 235U. It turned out that increasing the C/E − 1's of 148Nd to be zero makes the C/E − 1's of 235U decrease to−2 to 1% from 1% to 5% for the fuel samples of SF-95, SF-96 and SF-97. As a further work, re-determination of the sample burnups for those samples would be recommended.
4.3.3. Trends of C/E − 1's in axial and radial directions of fuel assemblies
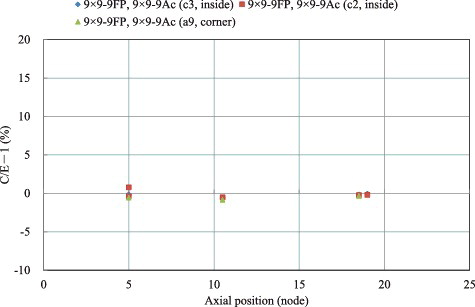
As seen in –, significant trend were not observed in the data sets of Takahama-3 except the axially highest sample of the SF-95 data set. The measurement data at this sample may have systematic uncertainties. Trends of C/E − 1's for 235U, 239Pu and 148Nd in axial and radial direction of fuel assembly were reviewed for the BWR fuel samples using the data sets, 9×9-9FP and 9×9-9Ac [Citation14,Citation15]. For these data sets, the fuel samples were taken from three fuel rods different in the radial locations of the fuel assemblies as shown in [Citation14]. – show the C/E − 1's vs. axial positions of the fuel samples for 235U, 239Pu and 148Nd, respectively. It is noticed that the deviations of 235U in the radial direction is relatively large especially for the samples taken from the corner rod a9. The similar trends were observed in the results obtained by the burnup calculations with the continuous-energy Monte Carlo calculation code MVP and the collision probability module of the analytical calculation code system SRAC2006 [Citation14,Citation15]. The BWR assemblies have relatively large heterogeneity in the radial direction due to the differences in moderation ratios of the inside and outside of a fuel channel. The axial distribution of void fraction inside of the fuel channel is another cause of the heterogeneity in the axial direction for the BWR assemblies. Those generally make deviations of C/E − 1's larger than those of the PWR fuel samples for major U and Pu isotopes as seen in .
Figure 8. Radial positions of the fuel rods from which fuel samples were taken for the 9×9-9FP and 9×9-9Ac data sets of Fukushima-daini-1 (BWR) [Citation14].
![Figure 8. Radial positions of the fuel rods from which fuel samples were taken for the 9×9-9FP and 9×9-9Ac data sets of Fukushima-daini-1 (BWR) [Citation14].](/cms/asset/8bacfb74-395d-4fa5-8593-5d589a08b8c4/tnst_a_1273802_f0008_b.gif)
Figure 9. C/E − 1's of 235U vs. the axial positions of the fuel samples for the 9×9-9FP and 9×9-9Ac data sets of Fukushima-daini-1 (BWR).
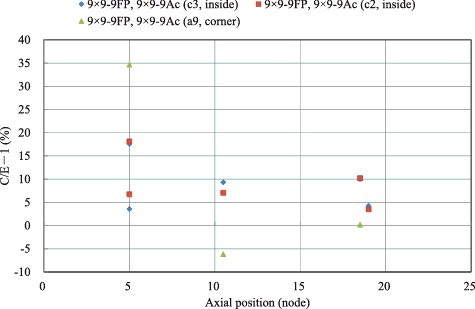
Figure 10. C/E − 1's of 239Pu vs. the axial positions of the fuel samples for the 9×9-9FP and 9×9-9Ac data sets of Fukushima-daini-1 (BWR).
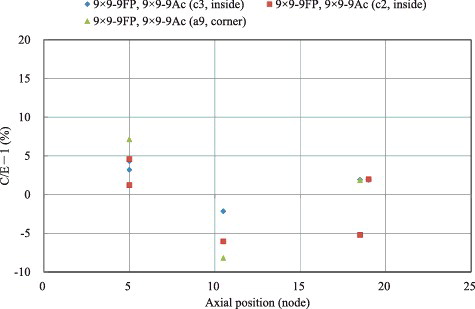
Figure 11. C/E − 1's of 148Nd vs. the axial positions of the fuel sampl es for the 9×9-9FP and 9×9-9Ac data sets.
5. Conclusions
The measured isotopic compositions on the 67 UO2 and MOX fuel samples taken from the irradiated light water reactor fuel assemblies were analyzed by CASMO5 with the JENDL-4.0 base library to assess the uncertainties in the calculated isotopic compositions on 19 heavy and 41 fission product nuclides. The numbers of the fuel samples were 33 for PWR UO2 fuel, 29 for BWR UO2 fuel, 1 for PWR MOX fuel and 4 for BWR MOX fuel. Applying the single-assembly model to the analysis of the UO2 fuel samples, the average and standard deviation of biases (C/E − 1's) were obtained for each nuclide separately for the PWR and BWR UO2 fuel samples. The burnups ranged from 14 GWd/t to 78 GWd/t. Burnup dependency in the biases was not observed for the most nuclides. The degree of deviation of the biases varied depending on the nuclides. The standard deviations of the biases for the BWR fuel samples were generally larger than those for the PWR samples for those nuclides. The averaged biases for 235U, 236U, 239Pu, 240Pu, 241Pu and 242Pu, which were important in terms of reactivity, were 2.7%, −0.9%, 0.3%, 0.7%, −2.4% and −1.7% for PWR UO2 samples, and 6.7%, −1.5%, 2.5%, −0.6%, 0.4% and −0.1% for BWR UO2 samples, respectively.
For the MOX fuel samples, the calculated results with the single-assembly model generally showed large positive biases for 239Pu. Applying the multiple-assembly model reduced the biases by about 10%. The effect of the multiple-assembly model on the calculated isotopic compositions was similar to those reported by the previous studies [Citation10,Citation17].
The effect of the gap between PWR UO2 fuel assemblies on the fuel compositions of 235U, 239Pu and 148Nd was analyzed for the data sets of Takahama-3 and the obtained results showed that the degree of the effect for 235U and 239Pu was large in the order of the corner, side and inside rods. The results were consistent with the previous study [Citation5]. This indicates that, when the assembly gap is not given in the experimental reports, it should be properly assumed and also the sensitivity study on the assembly gap should be performed in order to obtain reliable biases. For the same data sets, the correlation between the biases of 235U and 148Nd were observed and it turned out that the biases of 235U decreases by reducing those of 148Nd. In addition, the trends of the biases of these nuclides in the axial and radial directions of fuel assemblies were investigated for some of PWR and BWR UO2 fuel data sets and the degree of deviation of the biases were large in the BWR UO2 fuel samples.
Supplementary_Data.pdf
Download PDF (5.1 MB)Disclosure statement
No potential conflict of interest was reported by the authors.
Related Research Data
References
- Rhodes J, Smith K, Lee D. CASMO-5 development and application. Proc. PHYSOR-2006, ANS Topical Meeting on Reactor Physics; 2006 Sep 10–14; Vancouber (Canada). [ CD-ROM].
- Bahadir T, Lindahl S. Studsvik's next generation nodal code SIMULATE-5. Proc. Advances in Nuclear Fuel Management IV (ANFM 2009); 2009 April 12–15; Hilton Head Island (USA). [ CD-ROM].
- Shibata K, Iwamoto O, Nakagawa T, et al. JENDL-4.0: a new library for nuclear science and engineering. J. Nucl. Sci. Technol. 2011 Jan;48:1–30.
- Rhodes J, Gheorghiu N, Ferrer R. CASMO5 JENDL-4.0 and ENDF/B-VII.1beta4 libraries. Proc. PHYSOR 2012-Advancees in Reactor Physics, Industry and Education; 2012 April 15–20; Knoxville (USA). [ CD-ROM].
- Spent nuclear fuel assay data for isotopic validation. Nuclear Science. Nuclear Energy Agency, OECD; 2011; NEA/NSC/WPNCS/DOC(2011)5.
- Gauld IC, Ilas G, and Radulescu G. Uncertainties in predicted isotopic compositions for high burnup PWR spent nuclear fuel. Tennessee: Oak Ridge National Laboratory; 2011, Report no. NUREG/CR-7012, ORNL/TM-2010/41.
- Yamamoto T. Validation of ORIGEN2 coupled with JENDL-4.0 base libraries for isotopic compositions of irradiated light water reactor fuels. Proc. PHYSOR 2014- The Role of Reactor Physics Toward a Sustainable Future; 2014 September 20–October 3; Kyoto (Japan). [ CD-ROM].
- Nakahara Y, Suyama K, Inagawa J, et al. Nuclide composition benchmark data set for verifying burnup codes on spent light water reactor fuel. Nucl. Technol. 2002;137:111–126.
- Suyama K, Murazaki M, Ohkubo K, et al. Re-evaluation of assay data of spent nuclear fuel obtained at Japan Atomic Energy Research Institute for validation of burnup calculation code systems.Ann Nucl Energy. 2001;38:930–941.
- Yamamoto T, Suzuki M, Ando Y et al. Analysis of measured isotopic compositions of high-burnup PWR MOX and UO2 fuels in the MALIBU program. J Nucl Sci Technol. 2012;49:910–925.
- Yamamoto T, Ando Y, Hayashi Y et al. Analysis of core physics experiments on fresh and irradiated PWR UO2 fuels in the REBUS program. J Nucl Sci Technol. 2011;48:1025–1045.
- Primm III R.T. ARIANE international programme final report. Tennessee: Oak Ridge National Laboratory; 2003, Report no. ORNL/SUB/97-XSV750-1.
- Ilas G, Gauld IC Analysis of experimental data for high-burnup PWR spent fuel isotopic Validation-Vandelos II reactor. Tennessee: Oak Ridge National Laboratory; 2011, Report no. NUREG/CR-7013, ORNL/TM-2009/321.
- Suzuki M, Yamamoto T, Fukaya H, et al. Lattice physics analysis of measured isotopic compositions of irradiated BWR 9 × 9 UO2 fuel. J Nucl Sci Technol. 2013;50:1161–1176.
- Yamamoto T, Kanayama Y. Lattice physics analysis of burnups and isotope inventories of U, Pu, and Nd of irradiated BWR 9×9-9 UO2 fuel assemblies. J. Nucl. Sci. Technol. 2008; 45: 547–566.
- Smith HJ, Gauld IC, Mertyrek U. Analysis of experimental data for high burnup BWR spent fuel isotopic validation – SVEA-96 and GE14 assembly designs. Tennessee: Oak Ridge National Laboratory; 2013, Report no. NUREG/CR-7162, ORNL/TM-2013.
- Ando Y, Yamamoto T, Sugou Y. Analysis of measured isotopic compositions of high-burnup BWR MOX fuel. J Nucl Sci Technol. 2011;48:384–397.
- Standard test method for atom percent fission in uranium and plutonium fuel (neodymium-148 method). PA: ASTM international; 2005, Report no. ASTM E321-96.