
 ?Mathematical formulae have been encoded as MathML and are displayed in this HTML version using MathJax in order to improve their display. Uncheck the box to turn MathJax off. This feature requires Javascript. Click on a formula to zoom.
ABSTRACT
To investigate the applicability of the pulsed neutron source method using a pulsed spallation neutron source for an on-line subcriticality monitoring system of an accelerator-driven system, a subcritical experiment is conducted using the Kyoto University Critical Assembly in combination with the fixed-field alternating gradient accelerator. Reactivity values obtained from different traditional techniques, the area-ratio method and the α-fitting method, are discussed with respect to the applicability to on-line subcriticality monitoring. The results show that the area-ratio method robustly and accurately monitors subcriticality in shallow subcritical states with negative reactivity of up to a few dollars; however, this method faces problems with temporal fluctuations, spatial dispersion, and sensitivity to the proton-beam current with increasing depth of subcriticality. On the other hand, it is shown that the α-fitting method alleviates such problems in deep subcritical states. Moreover, a proposed fitting technique using the maximum-likelihood estimation method based on the Poisson distribution is robust enough to be applicable to on-line subcriticality monitoring for negative reactivity levels of up to roughly nine dollars.
1. Introduction
In the research and development of accelerator-driven subcritical systems (ADSs) [Citation1–6], development of a subcriticality monitoring system is a key issue for ensuring safety in operating and building a subcritical core. To monitor or measure subcriticality on-line, determining the subcriticality values requires swiftness, robustness, and accuracy. Among the various methods for measuring subcriticality [Citation7], the pulsed neutron source (PNS) method is considered to be one of the most promising techniques for meeting these requirements because of its analytical simplicity and capability of measuring a wide subcriticality range [Citation8]. Because an ADS is a subcritical assembly combined with a high-energy proton accelerator, the PNS method using a pulsed spallation neutron source (PSNS) would be the preferred option for a subcriticality monitoring system for an ADS.
In the PNS method, there are two different techniques: the Sjöstrand method [Citation9], also known as the area-ratio method, and the so-called α-fitting method [Citation10]. Both techniques have a long history of use of over half a century and their advantages and disadvantages are well known. However, subcritical experiments with the PNS method have been performed exclusively using a pulsed mono-energetic T(d, n)4He or D(d, n)3He neutron source that differs from the spallation neutrons, a broad range of peak energies on the order of a few MeV. Additionally, although much effort has been devoted to a methodology for on-line monitoring using the PNS with high accuracy and robustness, for example, in experimental projects such as the MUSE [Citation11], GUINEVERE [Citation12], and FREYA [Citation13] projects within the European programs, few studies have focused on monitoring swiftly.
The Kyoto University Critical Assembly (KUCA) at the Kyoto University Reactor Research Institute has been recently upgraded to conduct subcritical experiments with a PSNS by coupling with a fixed-field alternating gradient (FFAG) accelerator [Citation14,Citation15], and the PSNS is just beginning to be applied to subcritical experiments. Although it is important to understand the difference in measured reactor physics parameters between the PSNS and the conventional PNSs as reported in Yamanaka et al. [Citation16], there remains a need for an efficient technique that can determine the subcriticality swiftly. This study therefore investigates the applicability of techniques using PSNS to the on-line subcriticality monitoring system for an ADS; this is accomplished by measuring the subcriticality of several subcritical states of KUCA for short-time durations (i.e. 2 or 3 s). Although various sophisticated methods have been proposed for accurately determining the subcriticality [Citation17–22], we employ traditional, simple techniques to identify the issues affecting on-line subcriticality measurement.
The rest of this paper is organized as follows. First, the experimental conditions and the data processing method are described in Section 2. In Section 3, we present the experimental results for the area-ratio method and the α-fitting method, and discuss their results. Finally, we conclude this study in Section 4.
2. Experiment
2.1. Experimental conditions
The experiment was conducted using a 93% highly enriched uranium critical assembly moderated and reflected by polyethylene encased in aluminum sheaths. In this experiment, the subcriticality was determined using temporal responses of neutron detectors (hereafter detector responses) to the PSNS while six control and safety (C/S) rods were at steady positions (hereafter steady states) and while they were being inserted one by one at a controlled speed (hereafter transient states) for two core configurations: Core A and Core B. The configurations of Core A and Core B are illustrated in and , respectively, and a schematic of the fuel and polyethylene assemblies and the C/S rods is presented in . More details on their geometry and nuclide densities are provided in Pyeon et al. [Citation23]. As summarized in , , and , the steady states in Core A are hereafter referred to as AU, AV, AW, AX, AY, and AZ, and those in Core B as BU, BV, BW, BX, and BY. The transient states are indicated by an arrow mark between steady states, e.g. ‘AU→AV.’ For each steady state, the tables include the values of reactivity ρ, effective delayed neutron fraction βeff, effective multiplication factor keff, neutron generation time Λ, and prompt neutron lifetime ℓp estimated by the continuous-energy Monte Carlo code MCNP6.1.1 [Citation24] with the JENDL-4.0 nuclear data library [Citation25] for detailed geometric models. The superscript ‘c’ on the symbols ρ, βeff, keff, Λ, and ℓp indicates calculated values. The values of ρ and keff in were evaluated by the rod-drop and positive-period methods, where βeff of the Core A critical state was calculated as 789 pcm by the adjoint weighting method [Citation26]. Because ρ cannot be determined experimentally in Core B, the values in were deduced from the eigenvalue calculation using MCNP6.1.1, where ρc was obtained from
(1)
(1)
Figure 1. Horizontal cross-section of Core A.
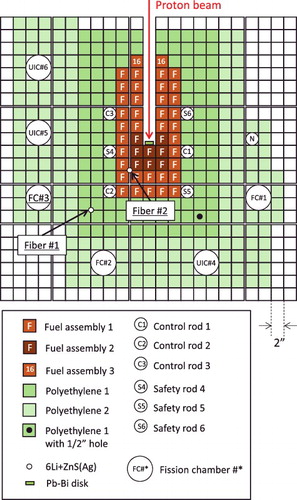
Figure 2. Horizontal cross-section of Core B.
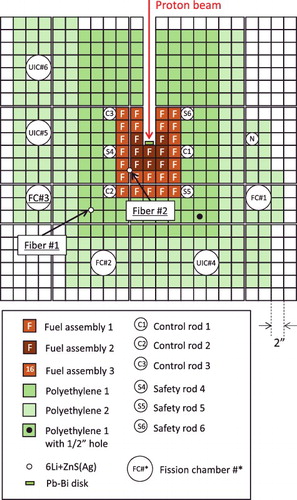
Figure 3. Schematic of fuel and polyethylene assemblies and C/S rods.
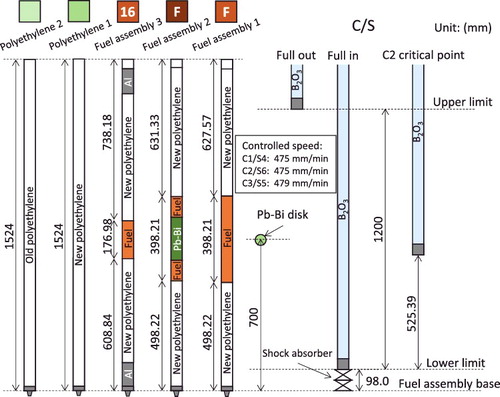
Table 1. Conditions of Core A configuration and the reactivity values estimated from rod-drop and positive-period methods compared to the calculated values of keff.
Table 2. Calculated values of βeff, ρ, Λ, and ℓp.
Table 3. Conditions of Core B configuration and keff, βeff, ρ, Λ, and ℓp values deduced from the calculation.
As shown in and , the pulsed proton beams were injected into a spallation target (solid lead-bismuth) attached to the core center. lists the conditions of the proton accelerator and spallation target. Neutrons were simultaneously detected by two scintillation fiber neutron detectors [Citation27] (Fibers #1 and #2) placed in the gaps between the aluminum sheaths and a 235U fission chamber (FC#3) (see and ). The proton-beam current was set at 20 μA at the beginning of the measurement and then increased at certain intervals of the core states shifting to maintain the neutron count rate.
Table 4. Proton beam and spallation target.
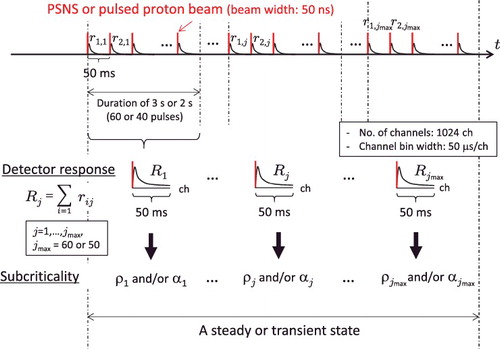
summarizes a temporal relationship of the parameters used in this measurement. The detected neutrons were counted by multi-channel scalers triggered by each proton-beam injection at a pulse period of 50 ms, and the detector responses were obtained by storing the neutron counts in 50-μs-width bins with 1024 channels for a short-time duration. Note that, in measuring the subcriticality, there is a trade-off between shortening the time duration and reducing the statistical fluctuations. From the viewpoint of swiftness, it is preferable that the time duration should be as short as possible and, as an ideal goal, the on-line measurement would be achieved by a single pulse. However, we were concerned that such a low number of pulses might be insufficient for determining the subcriticality because of low count rates. In this experiment, therefore, the time duration was set to 2 or 2 s (2 s for AV only and 3 s for the others), specifically 40 or 60 pulses, which would be an acceptable compromise for the time resolution of the on-line monitoring. For each neutron detector, the detector responses were continuously generated 60 times for each state but only 50 times for Core BY.
Figure 4. Schematic of the temporal relationship of the measurement parameters.
The count rate of the background neutrons measured in Fiber #2 with the subcritical configuration, which was considered to be the highest rate, yielded 0.0048 counts/s. Namely, the contribution of the background neutrons was negligibly small.
2.2. Data analysis
The subcriticality was obtained from the detector-response data. Here, the background and dead-time corrections were not taken into account. illustrates an example of a typical detector response to the pulsed proton-beam injection obtained from Fiber #1 in Core AX for a duration of 3 s. The neutrons were divided into two components: prompt and delayed neutrons. By counting these components, the area-ratio method determines the reactivity in units of dollars, which is expressed as
(2)
(2) where Ap and Ad represent areas of the prompt and delayed neutron components, respectively. These values were calculated from
(3)
(3)
(4)
(4) and
(5)
(5) where kj denotes the number of counts at channel j (j = 1, 2,… , jmax; jmax = 1024).
Figure 5. Typical detector response to pulsed proton-beam injection obtained from Fiber #1 with the Core AX for a duration of 3 s.
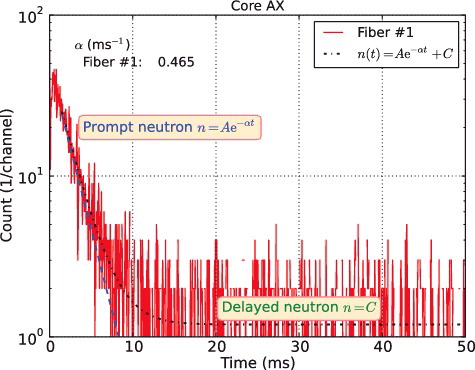
The α-fitting method determines the fundamental-mode prompt neutron decay constant α by fitting the neutron counts in the bins with the function
(6)
(6) where C denotes the delayed neutron component, which can be regarded as constant compared to the pulse period of 50 ms.
To eliminate higher harmonics from the prompt component, the first 30 channels following injection from the PSNS (i.e. 0 to 1.5 ms) were masked for all cases. If the time duration is long enough for the neutron count in each channel to be large, the counts are conventionally fitted by the least-squares method. The decay constant α as well as A and C in Equation (Equation6(6)
(6) ) can be obtained by solving the following minimization problem:
(7)
(7) where kj is the number of counts at channel j( = 31, 32, …, jmax), λj(x) is a nonlinear function of the three variables, which is given by
(8)
(8) σj is the measurement error of kj or
, and tj denotes the time at channel j. If kj = 0, then Equation (Equation7
(7)
(7) ) cannot be solved due to division by zero; therefore the value of σj is set to an arbitrary constant (non-zero) for all channels.
If the measurement time is very short, this method could be invalid because the neutron counts would not be normally distributed. As described later, the neutron counts for such cases practically conform to the Poisson distribution, although it is theoretically known that they do not follow the Poisson statistics as described in Pázsit et al. [Citation28]. Therefore, this paper proposes a modified fitting technique based on the Poisson distribution, and investigates the applicability of the conventional and modified fitting techniques. Here, as in the conventional technique, the neutron counts were fitted by the Levenberg–Marquardt algorithm [Citation29,Citation30], a common fitting technique based on the nonlinear least-squares method. In the modified technique, they were fitted by the maximum-likelihood estimation method based on the Poisson distribution, for which the methodology is described below.
Suppose that counts kj at channel j( = 31, 32, …, jmax) are independent and identically distributed, and conform to the Poisson distribution; the log likelihood function can be written as
(9)
(9)
(10)
(10) The maximum-likelihood estimation method solves the maximization (optimization) problem with respect to x in the equation below
(11)
(11) By negating Equation (Equation11
(11)
(11) ) and omitting the third, constant term in the curly brackets, it can be rewritten as
(12)
(12) This minimization problem can be solved by several numerical algorithms [Citation31]. In this study, we adopted the Nelder–Mead simplex algorithm [Citation32].
3. Results and discussion
3.1. Area-ratio method
and show the time evolutions of ρ obtained from the area-ratio method from the detector responses in Core A and Core B, respectively. Here, the results of the individual core states are combined. The straight, black, dashed lines labeled AU to AZ shown in indicate the reactivity estimated by the experiment, and those labeled BU to BY shown in indicate the reactivity determined by the MCNP6.1.1 calculation. The bold arrows show the timing of the changes in the proton-beam current. The statistical values (i.e. mean values and relative standard deviations) of the dispersed ρ in the steady states are listed in . For values of negative reactivity of up to a few dollars, the area-ratio method computes small relative standard deviations that signify good temporal stability and includes a small variation caused by the neutron detectors, which is in good agreement with the values obtained from the rod-drop and positive-period methods. However, these figures and indicate that the measured values vary with the neutron detector position and the temporal fluctuations increase as subcriticality becomes deeper. The former is due to the influence of higher harmonics, which is a well-known inherent problem in the area-ratio method, and in this case, some spatial correction must be taken into account as discussed in Refs. [Citation17,Citation33]. The latter is attributed to the low detector counts. This problem can be solved by increasing the proton-beam current while focusing on the count-loss effect due to the dead time of the neutron detectors, which would be accomplished by introducing some correction for the count-loss effect as discussed in Kitamura and Fukushima [Citation18]. However, although the count-loss rate of Fiber #2, which was close to the spallation target, was at most 1.5% (count rate of at most 3800 counts/s, dead time of 4 μs), large jumps were observed in the measured values from Fiber #2 when the proton-beam current was increased (i.e. at t = 23 and 29 min in ). While it is premature to derive a conclusion only from the present experiment, this indicates that some neutrons would be unnecessarily counted as the delayed neutron component from Fiber #2.
Figure 6. Time evolution of ρ obtained from area-ratio method in Core A.
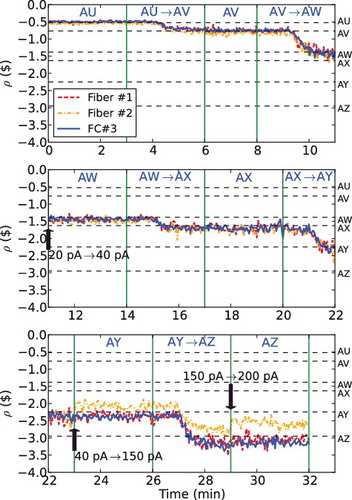
Figure 7. Time evolution of ρ obtained from area-ratio method in Core B.
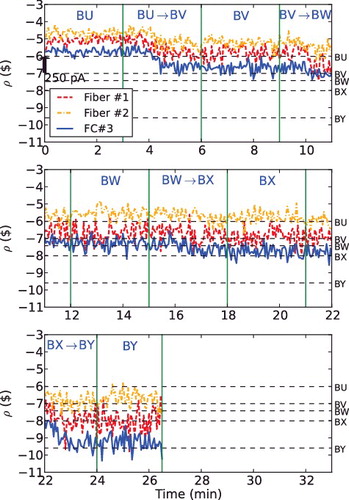
Table 5. Statistical values of ρ obtained from the area-ratio method in Core A and Core B steady states for short-time durations.
3.2. The α-fitting method
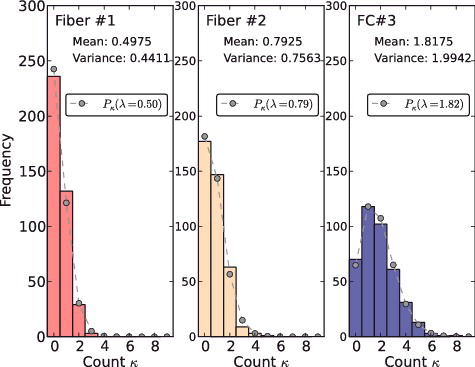
and show the time evolutions of α obtained from the α-fitting method in Core A and Core B, respectively. The fitting was conducted by the conventional least-squares technique as described above. In FC#3 in Core B, fitting failures frequently occurred as the subcriticality became deeper. An example of a failure is shown in , where the fitting failure occurred at a certain time for the BW steady state. As indicated in this figure, the failures seem to occur when the delayed-neutron counts are very low in contrast to the extremely high prompt-neutron counts, which are attributable to the unsuitability of the least-squares method to the fitting. displays histograms representing the frequency distribution of the delayed neutrons counted by the three neutron detectors from 30 to 50 ms at the time for the BW steady state. The horizontal and vertical axes represent neutron counts at a channel and their frequencies, respectively. This figure indicates that the delayed neutron components follow the Poisson distribution quite well, and it was confirmed that the same is true of all the steady and transient states.
Figure 8. Time evolution of α obtained from the conventional α-fitting method in Core A.
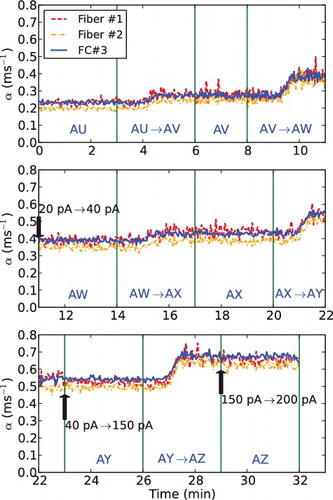
Figure 9. Time evolution of α obtained from the conventional α-fitting method in Core B.
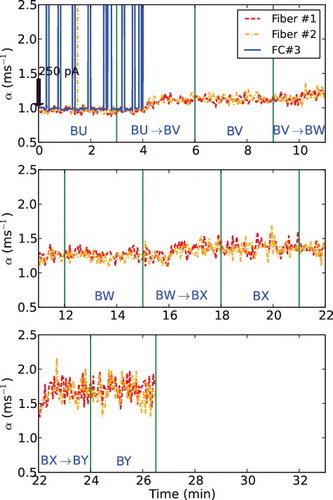
Figure 10. Example of fitting failure by the nonlinear least-squares method.
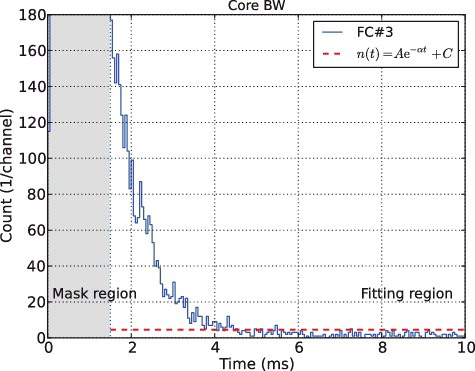
Figure 11. Histograms representing the frequency distribution of delayed neutrons (t = 30–50 ms) for the three different neutron detectors. Circles with dashed lines indicate the Poisson distributions.
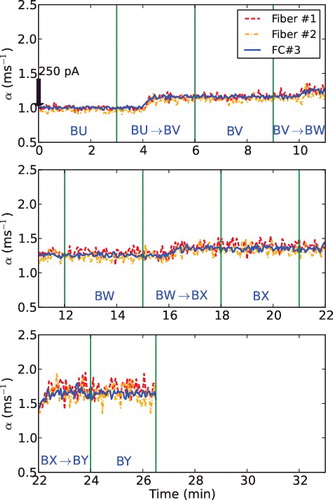
shows the time evolution of α in Core B, where the fitting was performed by the maximum-likelihood estimation method based on the Poisson distribution. It was found that the fitting using the modified technique succeeded for every detector response.
Figure 12. Time evolution of α obtained from the modified α-fitting method in Core B.
shows a comparison of the α values between the conventional and modified techniques for long time duration. It was observed that the α values obtained from the conventional technique differed slightly from those obtained from the modified technique. This difference is attributable to the fitting methodology; this indicates that, in determining the α values with the α-fitting method, uncertainty due to the fitting methodology should be taken into account.
Table 6. Comparison of α values obtained from the conventional and modified α-fitting methods for long time durations.
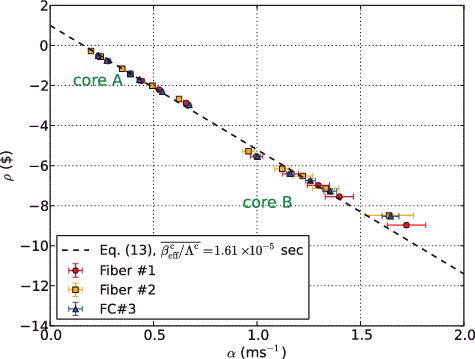
The measured α values were converted to ρ using the following relationship [Citation21]:
(13)
(13) where
is the average of βceff/Λc for each steady state, which yielded 1.61 × 10⁵ s−1. shows the relationship between the statistical values of α measured by the three neutron detectors and the converted ρ values in the Core A and Core B steady states. The dashed line represents the conversion formula given by Equation (Equation13
(13)
(13) ), and the points indicate relationships between the mean α values and ρ for each steady state and neutron detector, which are calculated using
(14)
(14) where subscripts i and j indicate the steady state and the neutron detector, respectively. The error bar indicates the 1σ dispersion of the α values. It can be seen that the relationship is almost linear and the straight line calculated using Equation (Equation13
(13)
(13) ) is in good agreement with the points with error bars.
Figure 13. Relationship between α and ρ.
and show the time evolutions of ρ, which have been converted using Equation (Equation13(13)
(13) ), in Core A and Core B, respectively. summarizes the statistical values of ρ obtained with the modified α-fitting method with the conversion formula in Core A and Core B steady states for short-time durations, in comparison with the values obtained from the rod-drop and positive-period methods ρe and those from the MCNP calculations ρcMCNP. Due to the conversion from α to ρ, temporal fluctuations increased, especially in shallow subcritical states. Nevertheless, comparing the relative standard deviations in and , the modified α-fitting method provides better temporal stability than the area-ratio method even in deep subcritical states of a negative reactivity of up to roughly nine dollars. From , the ρ values estimated by the α-fitting method with the conversion formula were partly inconsistent with those from the eigenvalue calculation and/or those from the rod-drop and positive-period methods. Although it was difficult to identify the cause of this inconsistency and to judge which values were closest to the true values, it appears that the calculated keff and the kinetic parameters βeff and Λ or the conversion formula of Equation (Equation13
(13)
(13) ) are linked to this inconsistency.
Figure 14. Time evolution of ρ obtained from the modified α-fitting method in Core A.
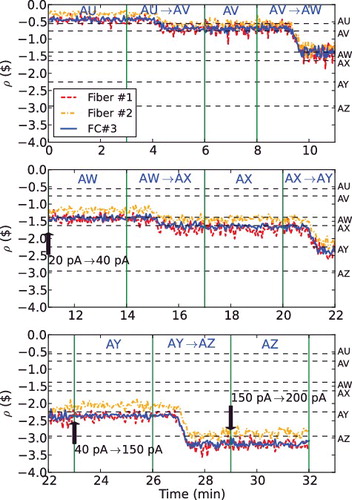
Figure 15. Time evolution of ρ obtained from the modified α-fitting method in Core B.
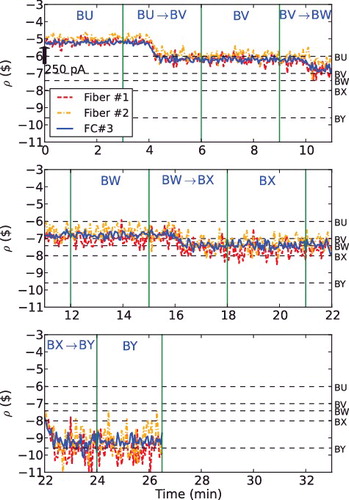
Table 7. Statistical values of ρ obtained from the modified α-fitting method with the conversion formula in Core A and Core B steady states for short-time durations.
From the results above, we confirmed that the proposed α-fitting technique using the maximum-likelihood estimation method based on the Poisson distribution provides good temporal stability. Furthermore, it suppresses a variation caused by neutron detector positions and avoids the occurrence of fitting failures even in deep subcritical states for a negative reactivity of up to roughly nine dollars.
4. Conclusions
To investigate the applicability of the PNS method using a PSNS for the on-line subcriticality monitoring system for an ADS, we have conducted a subcritical experiment using KUCA in combination with the FFAG accelerator. In the experiment, the detector responses to the PSNS were measured for several steady and transient states of KUCA with three different neutron detectors over a short duration of 2 or 3 s. The reactivity values obtained from the detector-response data using the area-ratio and α-fitting methods have been discussed with respect to the applicability of the methods to the on-line subcriticality monitoring for the ADS. The results showed that the area-ratio method robustly and accurately monitors subcriticality in shallow subcritical states of negative reactivity of up to a few dollars; however, it exhibits problems with temporal fluctuations, spatial dispersion, and sensitivity to the proton-beam current with increasing depth of subcriticality. On the other hand, the α-fitting method has been shown to alleviate such problems, especially in deep subcritical states. Moreover, we have demonstrated that the proposed fitting technique using the maximum-likelihood estimation method based on the Poisson distribution is robust enough to be applicable to on-line subcriticality monitoring for negative reactivity levels of up to roughly nine dollars.
We note that this fitting technique is promising in cases of low delayed-neutron counts, and it should be validated in deeper subcritical states and for shorter time durations. However, as noted earlier, the cause of the discrepancy between the values obtained from the experiments and those deduced by the calculations remains to be determined. Future work therefore should focus on determining subcriticality levels as accurately as possible.
Acknowledgments
The authors are grateful to Mr. M. Yamanaka of Kyoto University and the technical staff of KUCA for their assistance during the experiment. One of the authors (H.I.) would like to thank Dr. M. Fukushima of JAEA for valuable discussion on the data analysis.
Disclosure statement
No potential conflict of interest was reported by the authors.
References
- Iwamoto H, Nishihara K, Iwamoto Y, et al. Impact of PHITS spallation models on the neutronics design of an accelerator-driven system. J Nucl Sci Technol. 2016;53(10):1585–1594.
- Iwamoto H, Nishihara K, Sugawara T, et al. Sensitivity and uncertainty analysis for a minor-actinide transmuter with JENDL-4.0. Nucl Data Sheets 2014;118:519–522.
- Iwamoto H, Nishihara K, Sugawara T, et al. Sensitivity and uncertainty analysis for an accelerator-driven system with JENDL-4.0. J Nucl Sci Technol. 2013;50(8):856–862.
- Sugawara T, Nishihara K, Obayashi H, et al. Conceptual design study of beam window for accelerator-driven system. J Nucl Sci Technol. 2010;47(10):953–962.
- Nishihara K, Iwanaga K, Tsujimoto K, et al. Neutronics design of accelerator-driven system for power flattening and beam current reduction. J Nucl Sci Technol. 2008;45(8):812–822.
- Tsujimoto K, Sasa T, Nishihara K, et al. Neutronics design for lead-bismuth cooled accelerator-driven system for transmutation of minor actinide. J Nucl Sci Technol. 2004;41(1):21–36.
- Davey WG, Redman WC. Techniques in fast reactor critical experiments. New York (NY): Gordon and Breach; 1970.
- Research Committee on Reactor Physics. Activity report of working party on reactor physics of accelerator-driven system. Tokai: Japan Atomic Energy Research Institute; 2001 ( JAERI-Review 2001-047). Japanese.
- Sjöstrand NG. Measurements on a subcritical reactor using a pulsed neutron source. Ark Fys. 1956;11:13.
- Simmons BE, King S. A pulsed neutron technique for reactivity determination. Nucl Sci Eng. 1958;3:595–608.
- Mellier F. The MUSE experiments for subcritical neutronics validation. Cadarache: CEA; 2005 ( FIKW-CT-2000-0063).
- Baeten P, Aït Abderrahim H, Bergmans G, et al. The GUINEVERE Project at the VENUS Facility. Proceedings of the International Conference on the PHYSics Of Reactors (PHYSOR2008); Interlaken (Switzerland); 2008.
- Kochetkov A, Baeten P, Billebaud A, et al. Current Progress and Future Plans of the FREYA Project. Technology and Components of Accelerator-Driven Systems TCADS, Second International Workshop; 2013 May 21–23; Nantes (France).
- Pyeon CH, Misawa T, Lim JY, et al. First injection of spallation neutrons generated by high-energy protons into the Kyoto University Critical Assembly. J Nucl Sci Technol. 2009;46(12):1091–1093.
- Pyeon CH, Lim JY, Takemoto Y, et al. Preliminary study on the thorium-loaded accelerator-driven system with 100 MeV protons at the Kyoto University Critical Assembly. Ann Nucl Energy. 2011;38(10):2298–2302.
- Yamanaka M, Pyeon CH, Yagi T, et al. Accuracy of reactor physics parameters in thorium-loaded accelerator-driven system experiments at Kyoto University Critical Assembly. Nucl Sci Eng. 2016;183:96–106.
- Kulik VV, Lee JC. Space-time correction for reactivity determination in source-driven subcritical systems. Nucl Sci Eng. 2006;153:69–89.
- Kitamura Y, Fukushima M. Count-loss effect in subcriticality measurement by pulsed neutron source method, (I) investigation on count-loss effect in determination of neutron decay constant. J Nucl Sci Technol. 2014;51(6):752–765.
- Aizawa O. Reactivity analysis by spectral corrected Garelis-Russel method. J Nucl Sci Technol. 1969;6(9):498–507.
- Masters CF, Cady KB. A procedure for evaluating modified pulsed-neutron-source experiments in subcritical nuclear reactors. Nucl Sci Eng. 1967;29:272–282.
- Garelis E, Russell Jr,. JL. Theory of pulsed neutron source measurements. Nucl Sci Eng. 1963;16:263–270.
- Gozani T. A modified procedure for the evaluation of pulsed source experiments in subcritical reactors. Nukleonika. 1962;4:348.
- Pyeon CH, Yamanaka M, Takahashi Y. Experimental benchmarks on subcriticality of accelerator-driven system with 100 MeV protons at Kyoto University Critical Assembly. Proceedings of the International Conference on the Physics of Reactors, Unifying Theory and Experiments in the 21st Century (PHYSOR2016); 2016 May 1–5; Sun Valley (Idaho): American Nuclear Society.
- Goorley T. MCNP6.1.1-Beta Release Notes. Los Alamos: Los Alamos National Laboratory; 2014 ( LA-CP-14-24680).
- Shibata K, Iwamoto O, Nakagawa T, et al. JENDL-4.0: A new library for nuclear science and engineering. J Nucl Sci Technol. 2011;48(1):1–30.
- Kiedrowski BC, Brown FB, Wilson PPH. Adjoint-weighted tallies for k-eigenvalue calculations with continuous-energy Monte Carlo. Nucl Sci Eng. 2011;168:226–241.
- Yagi T, Misawa T, Pyeon CH, et al. A small high sensitivity neutron detector using a wavelength shifting fiber. App Radiat Isotop. 2011;69(1):176–179.
- Pàzsit I, Ceder M, Kuan Z. Theory and analysis of the Feynman-alpha method for deterministically and randomly pulsed neutron source. Nucl Sci Eng. 2004;148:67–78.
- Levenberg K. A method for the solution of certain non-linear problems in least squares. Quart Appl Math. 1944;2:164–168.
- Marquardt DW. An algorithm for least-squares estimation of nonlinear parameters. J Soc Indus Appl Math. 1963;11(2):431–441.
- Nocedal J, Wright SJ. Numerical optimization. New York (NY): Springer; 1999.
- Nelder JA, Mead R. A simplex method for function minimization. Comput J. 1965;7(4):308–313.
- Talamo A, Ghohar Y, Cao Y, et al. Impact of the neutron detector choice on Bell and Glasstone spatial correction factor for subcriticality measurement. Nucl Instrum Methods Phys Res A. 2012;668:71–82.