
 ?Mathematical formulae have been encoded as MathML and are displayed in this HTML version using MathJax in order to improve their display. Uncheck the box to turn MathJax off. This feature requires Javascript. Click on a formula to zoom.
ABSTRACT
Humic substances (HSs) are ubiquitous in various environments including deep underground and play an important role in the speciation and mobility of radionuclides. The binding of Eu3+, a chemical homologue of trivalent actinide ions, to HSs isolated from sedimentary groundwater at −250 m below the surface was studied by time-resolved laser fluorescence spectroscopy combined with parallel factor analysis (PARAFAC) as a function of pH and salt concentration. PARAFAC modeling reveals the presence of multiple factors that correspond to different Eu3+ species. These factors resemble those observed for Eu3+ binding to HSs from surface environments; however, detailed comparison shows that there are some particularities in Eu3+ binding to the deep groundwater HSs. The distribution coefficients (Kd) of Eu3+ binding to the HSs calculated from the PARAFAC modeling exhibits a rather strong salt effect. At 0.01 M NaClO4, the Kd values are relatively large and comparable to those to the surface HSs; they are decreaed at 0.1 M NaClO4 by more than an order of the magnitude. The Kd values are larger for the humic acid fraction of the deep underground HSs than the fulvic acid fraction over the entire range of pH and salt concentration investigated in this study.
1. Introduction
Humic substances (HSs) are natural organic matters resulting from degradation and condensation of animal, plant, and microbial residues, and play an important role in the fate of radionuclides in environments [Citation1–Citation3]. Positively charged radionuclide ions bind to the functional groups of HSs, which changes their aqueous speciation, sorption to minerals and rocks, and migration behaviors [Citation3–Citation5].
HS is a group of organic (macro)molecules with certain physicochemical properties in common [Citation6]. There is an operational classification, based on the solubility to water at different pH; humic acid (HA) is insoluble at acidic pH (pH 1 or 2); fulvic acid (FA) is soluble regardless of pH; humin is an insoluble fraction [Citation1]. HSs are ubiquitous in various environments: surface and shallow underground water, soil, and atmosphere [Citation2,Citation7]. Deep underground environment is not an exception. There are increasing evidences of the presence of HSs in deep underground environments [Citation8–Citation16], although their physicochemical and ion binding properties still remain largely unknown. According to several studies, deep underground HSs are often distinctive from their counterparts in surface environments [Citation12,Citation15,Citation16]. This is no wonder as deep underground HSs, although they may originate from the surface by groundwater recharge or deposited organic matters in rocks [Citation17], experience alternation by prolonged reactions with rocks and microbial activities, or they may even originate from remains of indigenous microorganisms. The authors have demonstrated that HA and FA extracted from groundwater at −250 m below ground level (bgl) at the Horonobe underground research laboratory (URL) of the Japan Atomic Energy Agency (JAEA) have distinctive physicochemical properties and exhibit unique proton (H+) and copper (Cu2+) binding behaviors [Citation15].
Binding of metal ions to HSs have been an active topic of research over decades [Citation3,Citation18–21]. For divalent metal ions, numerous binding data have been compiled for HSs mostly from surface and shallow underground environments. Mechanistic models have been proposed to describe ion binding to HS over a wide range of conditions [Citation18,Citation22]. Trivalent metal ions such as Fe3+ and Al3+ are also important for various environmentally relevant processes [Citation3]. Their geochemistry can be greatly modulated by HSs since these ions tend to strongly bind to HSs. In the safety assessment of geological disposal of high-level nuclear wastes, it is of great importance to understand the binding of trivalent and even tetravalent radionuclides to deep underground HSs. Nevertheless, the binding of such metal ions to HSs has been less studied [Citation3,Citation23], compared with divalent metal ions. This is partly because of a lack of reliable analytical techniques such as potentiometric titration with an ion-selective electrode that is extensively used for divalent ions such as Ca2+ and Cu2+ and that allows one to quantify the binding of the metal ions without separating HSs from the solution [Citation24].
The purpose of this study is to investigate europium (Eu3+) binding, a known chemical homologue of trivalent actinide ions such as Cm3+ and Am3+, to Horonobe HA and FA, which are collectively denoted as the HHSs (Horonobe HSs) hereafter, by time-resolved laser fluorescence spectroscopy (TRLFS). Europium is a trivalent fluorescent metal ion, whose emission spectrum and decay lifetime depend on the local chemical environment around the Eu3+ ion [Citation25–Citation27]. TRLFS enables one to directly estimate the binding amount of a fluorescent metal ion to simple ligands, mineral surfaces, and HSs and even differentiate its binding environments [Citation28–Citation32]. This is especially advantageous for the HHSs, as they have relatively small sizes [Citation15], for which classical separation techniques such as ultrafiltration may fail. The binding of Eu3+ to the HHSs are estimated from a series of the TRLFS data obtained as a function of pH and ionic strength with the help of multi-mode factor analysis called parallel factor analysis (PARAFAC) [Citation28,Citation30,Citation31,Citation33], and the obtained results are compared with those reported for HSs from surface environments to reveal the particularity of the deep underground HSs for the binding of trivalent actinide ions.
2. Material and methods
2.1. Materials
For the entire experiments, milli-Q grade pure water (18.2 MΩ) and analytical-grade chemicals purchased from Wako Pure Chemical Industries were used, unless otherwise noted.
HA and FA were extracted from groundwater collected at the experiment stages at −250 m bgl of the Horonobe URL [Citation15] and that from a surface borehole (HDB-10) at −500 m bgl. The geology and geochemistry of the site are described elsewhere [Citation34,Citation35]. The −250 m stage is located at the boundary of the Pleiocene Koetoi and the Miocene Wakkanai formations, both of which are composed of siliceous mudstones. The groundwater is weakly alkaline Na+/HCO3− type water with relatively high TOC levels (12 mg/L). The extraction and purification of HA and FA fractions from this groundwater are reported elsewhere [Citation15]. Groundwater from the HDB-10 was pumped by a packer-type groundwater sampling system from −496 to 550 m bgl, where the Wakkanai formation lies, and had circumneutral pH and 22 mg/L of TOC. The same procedure used in the extraction of HSs from the −250 m groundwater was used for this groundwater [Citation36]. By processing 1743 L of the groundwater, 615 and 12 mg of HA and FA were obtained, which corresponds to 1.6% and 0.03% of TOC. Hereafter, the Horonobe HA and FA collected at the two locations will be denoted as HHA250, HFA250, and HFA500. As the yield of HHA500 was too small, it was not used for the further study. The physicochemical properties of HHA250 and HFA250 as well as the binding of H+ and Cu2+ to them are reported elsewhere [Citation15].
The samples for TRLFS measurements were prepared according to Citation[30]. Briefly, 10 mL of 50 mg/L HS samples with 70 μM Eu3+ were prepared in 0.01 or 0.1 M NaClO4 as a function of pH. The Eu3+ concentration was set to achieve a reasonable signal to noise ratio in an acceptable measurement time for single TRLFS measurement, according to the previous research [Citation30], and may not well correspond to the ones expected for the trivalent actinide elements in real disposal situations. Sample preparation was carried out at room temperature (298 K) in an Ar-filled glove box. The pH of the samples was measured by a pH meter (ORION 5-star, Thermo Fisher Scientific) with a ROSS combined electrode (Thermo Fisher Scientific Inc., 1 M NaCl as the inner filling solution) and adjusted from 3 to 7.6 by 0.1 or 0.01M of HClO4 and NaOH. During the TRLFS measurements, we did not monitor the pH values of the samples. All samples were allowed to reach equilibrium for at least 24 hours before TRLFS and UV/Vis measurements.
2.2. TRLFS measurements
The samples were separated into two portions for TRLFS and UV-Vis absorption measurements. The absorption spectra of the samples were measured by UV/Vis spectrometer (UV-3100, Shimadzu). The obtained spectra were used to correct TRLFS data for inner filter effects [Citation37]. The TRLFS measurements were performed at constant room temperature (294 K), using the same setup reported elsewhere [Citation28,Citation30,Citation33]. The details of the setup are found in the Supplemental material and only briefly mentioned here. The excitation source was 130-fs Ti:sapphaire laser operating at 394 nm laser beam with the power of 0.1 mJ/pulse and the repetition rate of 1 kHz. The fluorescence from a sample was collected at 90°, energy-dispersed by a spectrograph, and measured by a time-dated ICCD camera. Fifty temporal scans were collected with the gate width and step of both 19 μs and initial delay of 10 μs. Two hundred measurements were accumulated for each sample.
2.3. PARAFAC modeling
Single TRLFS data that forms a matrix with wavelength × time coordinates was first corrected for its constant background, inner-filter effect and laser power variation. Finally, a series of the data collected as a function of pH were stored in 10 × 724 × 50 3D array (pH × wavelength × time) for a given HS and ionic strength and processed by PARAFAC, using the N-way toolbox for MATLAB® [Citation38]. Detailed description of PARAFAC is beyond the scope of this article and described in the literatures [Citation39–Citation41] and references therein. The application of PARAFAC for the speciation of Eu3+ with surface HSs from various origins is found in [Citation30]. Non-negativity constraint was applied on the coordinates of pH and wavelength and exponential constraint on the temporal coordinate. Estimation of appropriate number of factors in PARAFAC was performed with the aid of sum of squared residual (SSR) and core consistency (CC) [Citation40]. Errors associated with the peak ratios and the fluorescence lifetimes of the extracted factors were performed by cross validation proposed by Riu and Bro [Citation41]. The spectrum of a factor was normalized by the peak intensity of the 5D0 → 7F1 transition at 593 nm and the fluorescence decay curve by the intensity at the first point of the temporal series. The resulting normalization constants were used to calculate the fluorescence concentration profile of the factor. Note that the obtained profiles are approximations of the actual concentration profiles of relevant Eu3+ species since the quantum efficiencies are not necessarily same among them [Citation42].
3. Results and discussion
3.1. TRLFS data overview
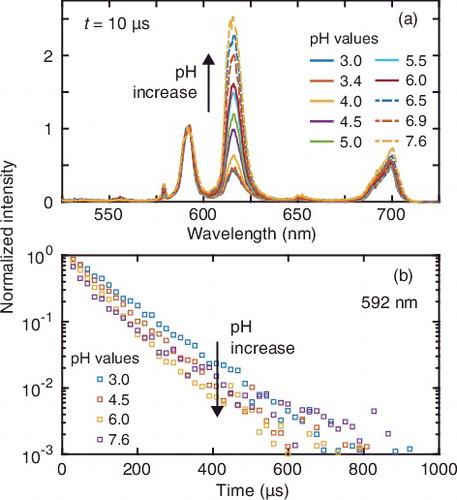
The fluorescence spectra of Eu3+ with the HHSs vary with pH and with time after laser irradiation. shows the normalized spectra of Eu3+ at t = 10 μs (the first time step) as a function of pH (a) and the decay profile of the normalized intensity at 592 nm (b) for HHA250 at 0.1 M NaClO4. Similar results are obtained for the other HSs and salt levels (data not shown). The peak at 615 nm originates from the transition from the 5D0 to 7F2 states, which is an electrical dipole allowed and hypersensitive transition, meaning that its transition probability strongly depends on the symmetry around Eu3+ [Citation43]. An increase of the intensity at 615 nm with pH indicates that the symmetry decreases due to displacement of hydration water of Eu3+ by HHA250. The decay profiles ((b)) show that the lifetime tends to decrease with pH. It is also apparent that the decay profiles do not follow simple mono-exponential decay, which suggests the presence of several species with different local environments around Eu3+ at a given pH.
Figure 1. (a) Normalized fluorescence spectra and (b) decay profiles of Eu3+ in the presence of HHA250 as a function of pH at 0.1 M NaClO4. In (b), the profiles only at selected pH (3.0, 4.5, 6.0, and 7.6) are plotted for clarity.
3.2. PARAFAC modeling
PARAFAC modeling was applied for the series TRLFS data measured as a function of pH for HHA250 and HFA250 at 0.01 and 0.1 M NaClO4. For HFA500, only the TRLFS data at 0.1 M NaClO4 were measured and processed by PARAFAC due to limited availability of the sample. Determination of the number of factors is the first and an important step in PARAFAC modeling. The SSR and CC were used as indicators for this purpose [Citation40]. Three factors are selected to describe the TRLFS data of HHA250 and HFA250 at 0.01 M NaClO4 and that of HFA500 at 0.1 M NaClO4, and two factors are turned out to be necessary for the data of HHA250 and HFA250 at 0.1 M NaClO4. The SSR and CC at the chosen numbers of factors are given in . Note that the factor 3 in HFA500 was considered to be a so-called ‘garbage’ factor [Citation30] and is not discussed hereafter, as it lacks meaningful features in its spectrum ((e)) and its decay lifetime and concentration profile show no physicochemically sound trends (data not shown). It is likely that this factor results from systematic errors in the measurements. It is also noteworthy to mention that the presence of three factors at 0.01 M NaClO4 agree with the results of the previous study with surface HSs at the same salt concentration [Citation30].
Table 1. Peak ratios and lifetimes of the factors extracted by the PARAFAC decomposition.
Figure 2. Normalized fluorescence spectra of the factors extracted by PARFAC for (a) HHA250 at 0.01 M NaClO4, (b) HHA250 at 0.1 M NaClO4, (c) HFA250 at 0.01 M NaClO4, (d) HFA250 at 0.1 M NaClO4, and (e) HFA500 at 0.1 M NaClO4.
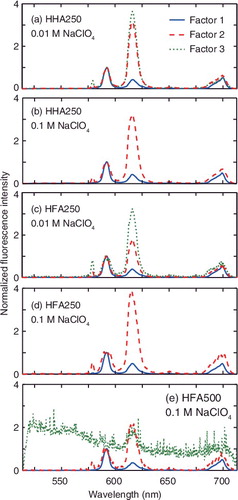
The spectra and relative concentration profiles of the extracted factors are shown in and , respectively. The fluorescence decay lifetime obtained by exponential fitting of the decay profile of each factor is presented in together with the peak ratio, the ratio of the intensity at 615 nm (the 5D0 → 7F2 transition) to that at 593 nm (the 5D0 → 7F1 transition) [Citation30]. Without energy transfer from excited Eu3+ to HS, the lifetime and peak ratio would increase with the progress of binding to HS. The factors are named Factors 1, 2, and 3 according to their similarities. Factor 1 is characterized by the smallest peak ratios and intermediate lifetimes. Its concentration decreases with pH. This factor is thought to be free Eu3+. Somewhat shorter lifetimes and larger peak ratios compared with those of Eu3+ aquo ion (113 μs and 0.3, respectively) indicate the presence of energy transfer via diffusional collision between Eu3+ and HS molecules (i.e. dynamic quenching), as is observed for surface HSs [Citation30]. In the previous study with surface HSs, it is reported that the lifetime of this factor is positively and negatively correlated with the sizes and aromaticities of the surface HSs, respectively, reflecting frequency of collision and ease of energy transfer [Citation30]. Considering relatively small sizes of the HHSs (<1 nm), the lifetimes of this factor would be much shorter. This indicates the existence of hindered energy transfer from excited Eu3+ to the HHSs likely due to the small aromaticity of the HHSs, which is in line with the elemental compositions of the HHSs and the carbon distribution by 13C-NMR [Citation15,Citation36].
Figure 3. Relative concentration profiles of the factors extracted by PARFAC for (a) HHA250 at 0.01 M NaClO4, (b) HHA250 at 0.1 M NaClO4, (c) HFA250 at 0.01 M NaClO4, (d) HFA250 at 0.1 M NaClO4, and (e) HFA500 at 0.1 M NaClO4.
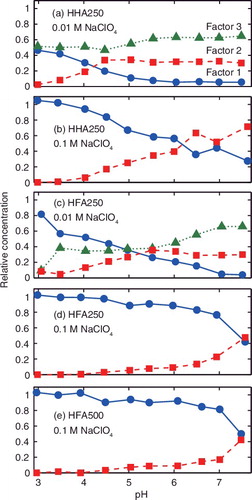
Factor 2 is characterized by the relatively large peak ratio and the shortest lifetime among the three (or two) factors. The concentration of this factor tends to increase with pH, suggesting that this factor corresponds to Eu3+ bound to the functional groups of the HHSs. Factor 3 observed only at 0.01 M NaClO4, on the other hand, has the largest peak ratio and the longest lifetime. These factors look similar to Factors C and B, respectively, in the previous study with the surface HSs [Citation30]. In this previous study Factor C is explained as Eu3+ bound to the sites of the surface HSs, being characterized by the large possibility of energy transfer and strong influences of the HS carbon backbone structures on the chemical environment around Eu3+; meanwhile, Factor B is thought to be Eu3+ bound to the functional groups of the HSs, in which detailed composition of the types of the functional groups strongly affects the local symmetry around Eu3+, that is, the peak ratio, and the abundance of this factor. Regardless of the apparent similarity, close comparison can reveal differences in these factors between the two HS groups (surface vs. deep underground). The lifetimes of Factor 2 do not follow the trends observed in the surface HSs, and its peak ratios are too small, considering the larger aliphaticities of the HHSs than those of the surface HSs, as is shown in Figures S2 and S3 in the Supplemental material. On the other hand, the peak ratios of Factor 3 of the HHSs follow the observed correlation between the compositions of the functional group types and the peak ratios of Factor B (). It is likely that underlying mechanisms characterizing these factors are similar, although the lifetimes of Factor 3 of the HHSs seem to be too short compared with those of the Factor B of the surface HSs, considering the small ash and nitrogen contents of the former. In addition, disappearance of Factor 3 at the higher salt concentration may also contradict with the similarity of this factor with Factor B in the previous study and the description on Factor B above.
Figure 4. Relationship between the peak ratios of Factor 3 (r3) of HHA250 and HFA250 or Factor B (rB) of the surface HSs in [Citation30] at 0.01 M NaClO4 and the compositions of their functional groups. The ordinate corresponds to the ratios of the amounts of the carboxylic groups of the HSs (q1) and the sum of the amounts of the phenolic (q2) and amine-type (q3) groups determined by acid-base titration. The dashed line represents the regression line between the peak ratios of Factor B and q1/(q2 + q3) established in [Citation30].
![Figure 4. Relationship between the peak ratios of Factor 3 (r3) of HHA250 and HFA250 or Factor B (rB) of the surface HSs in [Citation30] at 0.01 M NaClO4 and the compositions of their functional groups. The ordinate corresponds to the ratios of the amounts of the carboxylic groups of the HSs (q1) and the sum of the amounts of the phenolic (q2) and amine-type (q3) groups determined by acid-base titration. The dashed line represents the regression line between the peak ratios of Factor B and q1/(q2 + q3) established in [Citation30].](/cms/asset/ed2149ac-885d-40e3-b19b-0f6ed9af9809/tnst_a_1274688_f0004_oc.jpg)
Overall, the application of PARAFAC for the TRLFS data of Eu3+ binding to the HHSs reveals similar results to those of Eu3+ binding to the surface HSs; nevertheless, chemical environments surrounding Eu3+ and chemical properties of HSs that govern the fluorescence properties of bound Eu3+ are different among the two cases. This may relate to the observation that HHSs are different from surface HSs in various ways, consisting of rather small largely aliphatic organic acids that predominantly complex with metal ions with mono-dentate configuration [Citation15]. Local structures of Eu3+ bound to the HHS should be investigated, for instance, by X-ray absorption spectroscopy [Citation15,Citation44,Citation45] and compared with those of Eu3+ to surface HSs for further understanding of the difference among them. It is also of interest that Factor 3 only appears at 0.01 M NaClO4. Increased salt concentration leads to stronger screening of the electrostatic potential around HS particles and thus diminishes the binding of cations. Thus, this result suggests that the screening does not only decrease the overall binding amount of Eu3+ to the HHSs, but hinders particular types of the interactions.
3.3. Comparison of the Kd values
Once the underlying factors (i.e. species) are revealed from the TRLFS data by PARAFAC, it is easy to calculate the binding amounts or relevant parameters of Eu3+ with the HHSs by the following equation:
(1)
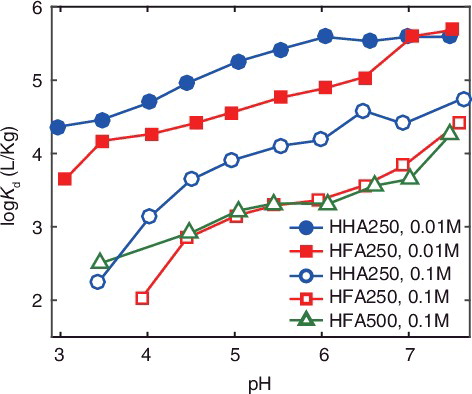
(1) where ri and cHA stand for the relative concentrations of the factors (i = 1, 2, and 3) and the concentration of HS in Kg/L. compares the distribution coefficients, Kd, of Eu3+ to the HHSs as a function of pH at 0.1 and 0.01 M NaClO4. The Kd increases with pH, as is the case for cation binding to HSs under the conditions, where the effects of any side reactions such as complexation with ligands and hydrolysis, which also increases in their magnitude with pH, are neglected. The Kd strongly depends on the salt concentration; it is decreased by more than an order of the magnitude for HHA250 and more than two orders of the magnitude for HFA250 when increasing the salt concentration from 0.01 to 0.1 M. As mentioned above, binding amounts of a metals ion to HS decreases with an increase of salt concentration; nevertheless, it seems that this effect is rather strong for Eu3+ binding to the HHSs, compared with that to surface HSs [Citation23]. Among the HHSs, HHA250 shows the larger Kd values than HFA250 at the both salt concentrations, and the Kd values of HFA500 are similar to those of the HFA250.
Figure 5. Comparison of the distribution coefficients, Kd, of Eu3+ binding to the HHSs as a function of pH at 0.1 and 0.01 M NaClO4.
The Kd values of Eu3+ to HHA and HFA250 at 0.01 M NaClO4 are compared with those to the surface HSs obtained at the same conditions in . The latter is calculated, based on the PARAFAC decomposition of the TRLFS data of Eu3+ binding to the surface HSs [Citation30]. The surface HSs in this figure include both FA and HA from terrestrial and aquatic origins. Surprisingly, the Kd values to the HHSs are similar to those to the surface HSs at this salt concentration. This is contrast to the case of Cu2+ binding to HHA250, which exhibits smaller Cu2+ binding to HHA250 than those to surface HSs [Citation15]. Terashima et al. [Citation36] investigated the binding of Eu3+ to HHA250 by fluorescence quenching and reported weak binding of Eu3+ at 0.1 M salt concentration. Such discrepancy can be explained by strong salt effects on Eu3+ binding to the HHSs. At a low salt concentration, Eu3+ binding to the HHSs is relatively large and similar to that to surface HSs due to strong electrostatic interaction. This seems to be largely diminished by screening of the electrostatic potential at a larger salt concentration.
Figure 6. Comparison of the distribution coefficients, Kd, of Eu3+ binding to the HHSs and the surface HSs at 50 mg/L HS, 70 μM Eu3+, and 0.01 M NaClO4. The surface HSs are the standard HSs from the international humic substances society (IHSS) and Japan humic substances society (JHSS). PAHA: purified Aldrich HA (commercial), BFA: Biwako FA (lake), SRHA: Suwannee river HA (river), SRFA: Suwannee rive FA (river), IHA: Inogashira HA (soil), IFA: Inogashira FA (soil), NHA: Nordic HA (lake), NFA: Nordic lake FA (lake), DHA: Dando HA (soil), EHA: Eliot HA (soil), and PHA: Pahokee HA (peat). The Kd values of the surface HSs are calculated, based on the results of the PARAFAC modeling in [Citation30] in a similar way to those of the HHSs.
![Figure 6. Comparison of the distribution coefficients, Kd, of Eu3+ binding to the HHSs and the surface HSs at 50 mg/L HS, 70 μM Eu3+, and 0.01 M NaClO4. The surface HSs are the standard HSs from the international humic substances society (IHSS) and Japan humic substances society (JHSS). PAHA: purified Aldrich HA (commercial), BFA: Biwako FA (lake), SRHA: Suwannee river HA (river), SRFA: Suwannee rive FA (river), IHA: Inogashira HA (soil), IFA: Inogashira FA (soil), NHA: Nordic HA (lake), NFA: Nordic lake FA (lake), DHA: Dando HA (soil), EHA: Eliot HA (soil), and PHA: Pahokee HA (peat). The Kd values of the surface HSs are calculated, based on the results of the PARAFAC modeling in [Citation30] in a similar way to those of the HHSs.](/cms/asset/a9e537c6-f9ee-42dc-8861-d9059ea3ba6e/tnst_a_1274688_f0006_oc.jpg)
4. Conclusion
Binding of Eu3+ to HA and FA isolated from sedimentary deep underground water was studied by TRLFS as a function of pH and salt concentration. Multivariate analysis known as PARAFAC was used to distinguish different Eu3+ in the presence of the HSs and quantify its binding amounts. PARAFAC successfully separated the contributions of different factors (i.e. different Eu3+ species) from the series of TRLFS data. Factor 1 is considered to be free Eu3+, whose lifetime is modulated by collisional quenching with the HS particles. It is likely that smaller aromaticity of the HSs hinders energy transfer from Eu3+ to the HSs, resulting in somewhat longer lifetimes of this factor, compared with those of the HSs from surface environments. Factors 2 and 3 correspond to Eu3+ bound to the functional groups of the HHSs. Close comparison of the spectra and lifetimes of these factors to those of the corresponding factors in Eu3+ binding to surface HSs reveals particularities of the former HSs. Furthermore, it turns out that Factor 3 is the Eu3+ species that is strongly affected by a change of salt concentration.
The results of the PARAFAC decomposition were used to calculate the Kd values as function of pH at 0.1 and 0.01 M NaClO4. The Kd values of the HA fraction are larger than those of the FA faction. The Kd values are decreased by more than an order of the magnitude when changing the salt concentration from 0.01 to 0.1 M. This suggests that the binding of Eu3+ to the deep underground HSs are rather sensitive to the salt concentration; at a relatively small salt concentration the Kd values of the deep underground HSs are comparable to those of surface HSs.
Supplementary_Data.pdf
Download PDF (138.9 KB)Acknowledgments
Takumi Saito thanks Mr Steven Lukman for his assistance in the TRLFS measurements. This research was partly supported by the Ministry of Economy, Trade and Industry (METI), Japan, and ‘Grant-in-Aid for Young Scientists (B)’ (Grant No. 25820446), the Japan Society for the Promotion of Science.
Disclosure statement
No potential conflict of interest was reported by the authors.
Additional information
Funding
Related Research Data
References
- Schnitzer M, Khan SU. Humic substances in the environment. New York (NY): Marcel Dekker; 1972.
- Aiken GR, McKnight DM, Wershaw RL, et al. Humic substances in soil, sediment and water. New York (NY): Wiley; 1985.
- Tipping E. Cation binding by humic substances. Cambridge: Cambridge University Press; 2002.
- Koopal LK, Saito T, Pinheiro JP, et al. Ion binding to natural organic matter: general considerations and the NICA-Donnan model. Colloids Surf A. 2005;265:40–54.
- Saito T, Koopal LK, Nagasaki S, et al. Analysis of copper binding in the ternary system Cu2+/humic acid/goethite at neutral to acidic pH. Environ Sci Technol. 2005;39:4886–4893.
- Stevenson FJ. Geochemistry of soil humic substances. In: Aiken GR, Mcknight DM, Wershaw RL, MacCarthy P, editors. Humic substances in soil, sediments and water. New York (NY): John Wily & Sons; 1985. p. 13–52.
- Baduel C, Monge ME, Voisin D, et al. Oxidation of atmospheric humic like substances by ozone: a kinetic and structural analysis approach. Environ Sci Technol. 2011;45:5238–5244.
- Artinger R, Buckau G, Geyer S, et al. Characterization of groundwater humic substances: influence of sedimentary organic carbon. Appl Geochem. 2000;15:97–116.
- Courdouan A, Christl I, Meylan S, et al. Isolation and characterization of dissolved organic matter from the Callovo–Oxfordian formation. Appl Geochem. 2007;22:1537–1548.
- Grasset L, Brevet J, Schafer T, et al. Sequential extraction and spectroscopic characterisation of organic matter from the Callovo–Oxfordian formation. Org Geochem. 2010;41:221–233.
- Gron C, Wassenaar L, Krog M. Origin and structures of groundwater humic substances from three Danish aquifers. Environ Int. 1996;22:519–534.
- Kovács K, Gáspár A, Sajgó C, et al. Comparative study on humic substances isolated in thermal groundwaters from deep aquifers below 700 m. Geochem J. 2012;46:211–224.
- Longnecker K, Kujawinski EB. Composition of dissolved organic matter in groundwater. Geochim Cosmochim Acta. 2011;75:2752–2761.
- Pettersson C, Ephraim J, Allard B. On the composition and properties of humic substances isolated from deep groundwater and surface waters. Org Geochem. 1994;21:443–451.
- Saito T, Terashima M, Aoyagi N, et al. Physicochemical and ion-binding properties of highly aliphatic humic substances extracted from deep sedimentary groundwater. Environ Sci Process Impacts. 2015;17:1386–1395.
- Schäfer T, Buckau G, Artinger R, et al. Origin and mobility of fulvic acids in the Gorleben aquifer system: implications from isotopic data and carbon/sulfur XANES. Org Geochem. 2005;36:567–582.
- Aravena R, Wassenaar LI. Dissolved organic-carbon and methane in a regional confined aquifer, Southern Ontario, Canada – carbon-isotope evidence for associated subsurface sources. Appl Geochem. 1993;8:483–493.
- Kinniburgh DG, van Riemsdijk WH, Koopal LK, et al. Ion binding to natural organic matter: competition, heterogeneity, stoichiometry and thermodynamic consistency. Colloids Surf A. 1999;151:147–166.
- Marinsky JA, Reddy MM. Proton and metal ion binding to natural organic polyelectrolyte-II. Preliminary investigations with a peat and a humic acid. Org Geochem. 1984;7:215–221.
- Saito T, Nagasaki S, Tanaka S. Evaluation of the complexation behavior between humic acid and UO22+ with fluorescence spectroscopy and its mixture analysis. Radiochim Acta. 2002;90:27–33.
- Saito T, Nagasaki S, Tanaka S, et al. Application of the NICA-Donnan model for proton, copper and uranyl binding to humic acid. Radiochim Acta. 2004;92:567–574.
- Tipping E, Lofts S, Sonke JE. Humic Ion-Binding Model VII: a revised parameterisation of cation-binding by humic substances. Environ Chem. 2011;8:225–235.
- Milne CJ, Kinniburgh DG, van Riemsdijk WH, et al. Generic NICA-Donnan model parameters for metal-ion binding by humic substances. Environ Sci Technol. 2003;37:958–971.
- Milne CJ, Kinniburgh DG, de Wit JCM, et al. Analysis of metal-ion binding by a peat humic-acid using a simple electrostatic model. J Colloid Interface Sci. 1995;175:448–460.
- Bunzli JC, Yersin JR. Fluorescence spectra and lifetime measurements of aqueous solutions of europium nitrate and perchlorate. Inorg Chem. 1979;18:605–607.
- Horrocks WD, Sudnick DR. Lanthanide ion probes of structure in biology – laser-induced luminescence decay constants provide a direct measure of the number of metal-coordinated water-molecules. J Am Chem Soc. 1979;101:334–340.
- Beeby A, Clarkson IM, Dickins RS, et al. Non-radiative deactivation of the excited states of europium, terbium and ytterbium complexes by proximate energy-matched OH, NH and CH oscillators: an improved luminescence method for establishing solution hydration states. J Chem Soc Perkin Trans. 1999;2:493–503.
- Ishida K, Saito T, Aoyagi N, et al. Surface speciation of Eu3+ adsorbed on kaolinite by time-resolved laser fluorescence spectroscopy (TRLFS) and parallel factor analysis (PARAFAC). J Colloid Interface Sci. 2012;374:258–266.
- Kouhail YZ, Benedetti MF, Reiller PE. Eu(III)-fulvic acid complexation: evidence of fulvic acid concentration dependent interactions by time-resolved luminescence spectroscopy. Environ Sci Technol. 2016;50:3706–3713.
- Lukman S, Saito T, Aoyagi N, et al. Speciation of Eu3+ bound to humic substances by time-resolved laser fluorescence spectroscopy (TRLFS) and parallel factor analysis (PARAFAC). Geochim Cosmochim Acta. 2012;88:199–215.
- Saito T, Aoyagi N, Kimura T. Time-resolved laser-induced fluorescence spectroscopy combined with parallel factor analysis: a robust speciation technique for UO22+. J Radioanal Nucl Chem. 2015;303:1129–1132.
- Sasaki T, Ueda K, Saito T, et al. Sorption of Eu3+ on Na-montmorillonite studied by time-resolved laser fluorescence spectroscopy and surface complexation modeling. J Nucl Sci Technol. 2016;53:592–601.
- Saito T, Sao H, Ishida K, et al. Application of parallel factor analysis for time-resolved laser fluorescence spectroscopy: implication for metal speciation study. Environ Sci Technol. 2010;44:5055–5060.
- Hama K, Kunimaru T, Metcalfe R, et al. The hydrogeochemistry of argillaceous rock formations at the Horonobe URL site, Japan. Phys Chem Earth. 2007;32:170–180.
- Kurikami H, Takeuchi R, Yabuuchi S. Scale effect and heterogeneity of hydraulic conductivity of sedimentary rocks at Horonobe URL site. Phys Chem Earth. 2008;33:S37–S44.
- Terashima M, Nagao S, Iwatsuki T, et al. Europium-binding abilities of dissolved humic substances isolated from deep groundwater in Horonobe area, Hokkaido, Japan. J Nucl Sci Technol. 2012;49:804–815.
- Lakowicz JR. Principles of fluorescence spectroscopy. 2nd ed. New York (NY): Kluwer Academic; 1999.
- Andersson CA, Bro R. The N-way toolbox for MATLAB. Chemometr Intell Lab. 2000;52:1–4.
- Bro R. PARAFAC. Tutorial and applications. Chemometr Intell Lab. 1997;38:149–171.
- Bro R, Kiers HAL. A new efficient method for determining the number of components in PARAFAC models. J Chemometr. 2003;17:274–286.
- Riu J, Bro R. Jack-knife technique for outlier detection and estimation of standard errors in PARAFAC models. Chemometr Intell Lab. 2003;65:35–49.
- Collins RN, Saito T, Aoyagi N, et al. Applications of time-resolved laser fluorescence spectroscopy to the environmental biogeochemistry of actinides. J Environ Qual. 2011;40:731–741.
- Cotton S. Lanthanide and actinide chemistry. Chichester: John Wiley & Sons, Ltd; 2006.
- Monsallier JM, Artinger R, Denecke MA, et al. Spectroscopic study (TRLFS and EXAFS) of the kinetics of An(III)/Ln(III) humate interaction. Radiochim Acta. 2003;91:567–574.
- Yang ST, Sheng GD, Montavon G, et al. Investigation of Eu(III) immobilization on gamma-Al2O3 surfaces by combining batch technique and EXAFS analyses: role of contact time and humic acid. Geochim Cosmochim Acta. 2013;121:84–104.