
 ?Mathematical formulae have been encoded as MathML and are displayed in this HTML version using MathJax in order to improve their display. Uncheck the box to turn MathJax off. This feature requires Javascript. Click on a formula to zoom.
ABSTRACT
In nuclear safety field, neutronic and thermalhydraulic codes performance is an important issue. New capabilities implementation, as well as models and tools improvements are a significant part of the community effort in looking for better nuclear power plants (NPP) designs. A procedure to analyze the PWR response to local deviations on neutronic or thermalhydraulic parameters is being developed. This procedure includes the simulation of Incore and Excore neutron flux detectors signals. A control rod drop real plant transient is used to validate the used codes and their new capabilities. Cross-section data are obtained by means of the SIMTAB methodology. Detailed thermalhydraulic models were developed: RELAP5 and TRACE models simulate three different azimuthal zones. Besides, TRACE model is performed with a fully three-dimensional core, thus, the cross-flow can be obtained. A Cartesian vessel represents the fuel assemblies and a cylindrical vessel the bypass and downcomer. Simulated detectors signals are obtained and compared with the real data collected during a control rod drop trial at a PWR NPP and also with data obtained with SIMULATE-3K code.
1. Introduction
A nuclear power plant (NPP) is designed not only to operate under nominal conditions, but to successfully withstand changes without undermining the reactor safety. These changes are the result of discrepancies between abnormal operating conditions and the expected normal conditions. These deviations may be global or local. It is interesting to develop tools to obtain the core local response to anticipated or postulated transients and accidents.
In this work, detailed models for RELAP5/mod3.3/PARCSv2.7 and TRACEv5.0P3/PARCSv3.0 have been developed to perform a pressurized water reactor (PWR) study through the Incore and Excore neutron detector signal analysis. For this purpose, a control rod drop transient, i.e. a transient that provokes local deviations of neutronic and thermalhydraulic parameters, has been simulated. Different versions of PARCS have been used. On one hand, PARCSv3.0 is officially distributed and coupled with TRACE. On the other hand, RELAP5 is not provided with an official neutronic coupling code; therefore, due to previous experience with RELAP5/PARCSv2.7 couple code, it has been decided to continue with it. As a precaution, the solver used in PARCS is unchanged and its formulation is invariant in both versions.
A control rod drop transient in a PWR is part of the reactivity initiated accidents (RIA) that can occur in a NPP. There is a wide literature regarding the analysis of these accidents [Citation1–3].
Specifically, a control rod drop transient consists in the inadvertent insertion of a control rod due to a malfunction of its activation mechanism. The reactor power evolution is dominated by a sudden and continuous negative reactivity insertion, and the core power distribution is modified. Due to this absorber insertion, the reactivity decreases (as the neutron population decreases) and the reactor core turns subcritical. The effect of the moderator density and the Doppler temperature on the reactivity leads the reactor again to criticality in a few seconds, to subsequently evolve into an asymptotic point.
During this process if the energy deposition is sufficiently low to avoid a departure from nucleate boiling (DNB), the thermalhydraulic evolution has little impact on the accident [Citation4]. However, it is necessary to know the specific acceptance criteria to perform a proper analysis for the proposed transient.
The acceptance criteria for Anticipated Operational Occurrences (AOOs), as defined in NUREG-0800, Chapter 15 [Citation5] by the U. S. Nuclear Regulatory Commission, are established according to the following points: (a) pressure in the reactor coolant and main steam systems should be maintained below 110% of the design values in accordance with the ASME Boiler and Pressure Vessel Code; (b) fuel cladding integrity shall be maintained by ensuring that the minimum departure from nucleate boiling ratio (DNBR) remains above 95/95 DNBR limit for PWRs; and (c) an AOO should not generate a postulated accident without other faults occurring independently or result in a consequential loss of function of the reactor coolant system (RCS) or reactor containment barriers (this third point is assured by definition, since an AOO cannot generate an accident without other incidents occurring independently or result in a consequential loss of function of the RCS or reactor containment barriers [Citation5]).
In the present study, besides the analysis of the control rod drop transient from the safety point of view, a deepest analysis can be performed thanks to the real data provided by Centrales Nucleares Almaraz-Trillo (CNAT). This data corresponds to a control rod drop test done at a facility. The test was carried out to assess a modification in the control logics that detect a control rod drop, and was not related to the NPP safety analysis, but has been very useful for the purpose of this work.
During this test, the reactor was operating at the 100% of its nominal power, and the insertion of a single rod was performed releasing it from its locks and allowing its free fall. This control rod was chosen for its position in the reactor core: it was one of the rods with greatest worth, i.e. the negative reactivity that a rod adds, and its situation in reference to the detectors was suitable to the means of the test. A considerable amount of data was registered during this test. This data includes real signals for Incore and Excore neutron detectors and the results of its simulation with SIMULATE-3K code.
Access to experimental data allows qualifying neutronic-thermalhydraulic codes and models used in NPP safety analysis. Thus, this work presents this qualification of RELAP5/mod3.3/PARCSv2.7 and TRACEv5.0P3/PARCSv3.0 coupled codes, and provides reliable tools to perform further studies in PWR NPPs.
In Section 2, thermalhydraulic models for the studied PWR reactor are introduced. Neutronic code modifications and models used to calculate the simulated signals for the detectors are also explained. The results are shown in Section 3, followed by the conclusions and future work in Section 4.
2. Neutronic and thermalhydraulic models
2.1. PARCS code: model performance and modifications
PARCS code is a three-dimensional (3D) reactor core simulator that can solve the neutron diffusion equation to predict the kinetic response of the reactor against reactivity perturbations. For example, control rod movements, changes in the fluid temperature or other conditions on the reactor core.
The neutron diffusion equation is solved using two energy groups for the rectangular or hexagonal geometry. The method chosen to solve the equation is the HYBRID method. It is an analytical nodal method/nodal expansion method (ANM/NEM), and it is the recommended method in the user's manual.
PARCS is coupled with RELAP5 and TRACE. These codes will feed PARCS with temperature and density distributions information during a transient. The protocol to couple these codes is the Parallel Virtual Machine (PVM). In order to perform the coupling, an input file for PARCS code is needed. This file, called MAPTAB, indicates the neutronic nodes assignment to each thermalhydraulic node. It is obtained automatically thanks to the tools developed by ISIRYM-UPV with a MATLAB® software [Citation6].
Radially, the neutronic model assigns a node to each fuel assembly. Moreover, the core is formed by 177 nodes for the active zone and 64 nodes for the reflector. Axially, the core is divided in 34 levels, 2 of them corresponding to the top and bottom reflectors. Geometric data were provided by CNAT [Citation7]. A MATLAB® program is used to automatically obtain PARCS input files.
The control rod insertion is defined in PARCS input file. The simulation of the transient lasts 100.0 seconds. The control drop ejection begins at 50.0 seconds lasts 2.1 seconds. The purpose of the first 50.0 seconds is to ensure the stable conditions at the beginning of the transient. Figure S1 of supplemental material shows the control rod insertion depending on the time (0 cm indicates fully inserted).
One of the aims of the collaboration between CNAT and ISIRYM-UPV was the study of neutron noise registered by Incore and Excore detectors. For this reason, the simulation of detector signals has also been introduced in the model. PARCS code has been modified to simplify data analysis. In particular, source code has been modified to search for the detector position nodes and save in separated files its principal variables, with an adequate format to optimize the analysis of the results.
2.1.1. Incore detectors
The Incore instrumentation comprehends 36 n, β-cobalt detectors in six fingers placed in selected fuel assemblies which provide continuously measurement of local neutron flux density.
To simulate the response of the Incore detectors (power density detectors, PDDs), EquationEquation (1)(1)
(1) was used. FID is a conversion factor for each detector, it corresponds to the mean power registered by the detector at the steady case, while Φ is the thermal flux calculated for each Incore detector position.
(1)
(1)
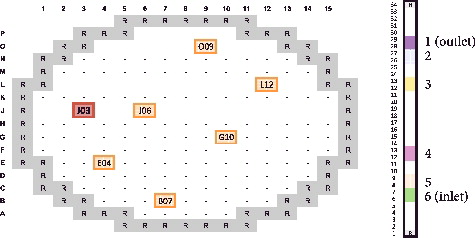
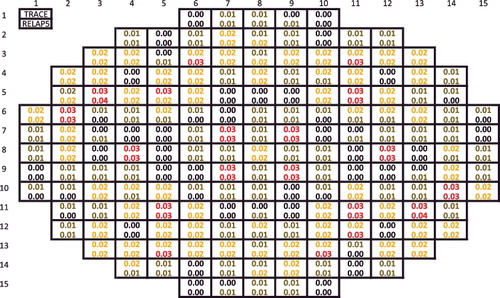
The Incore detectors position is shown in , the control rod inserted is located in position J3.
Figure 1. Incore detectors locations in the reactor core. In position J3, the control rod dropped at the test.
Each radial position corresponds to a single node. For each axial position, it is necessary to take the thermal flux of two consecutive nodes and multiply them by the proper weighting factor. These weighting factors correspond to the actual position of the detector between two axial nodes and are shown in Table S1 of the supplemental material.
2.1.2. Excore detectors
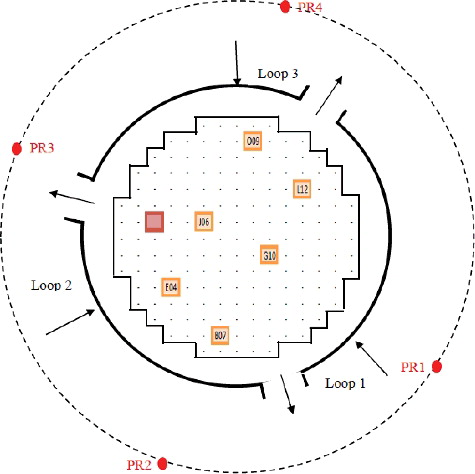
The Excore detectors (boron-lined ionization chambers) are located at the biological shield, out of the core region. For this reason, a transport model is needed to calculate its simulated signal. There are 16 chambers. In , four radial positions for the Excore detectors are shown, marked as PR1, PR2, PR3 and PR4. Each position has two channels (bottom and top).
Figure 2. Excore detectors radial locations.
The Excore detectors response is obtained by applying a simple radial transport model described in EquationEquations (2)(2)
(2) and (Equation3
(3)
(3) ):
(2)
(2)
(3)
(3)
EquationEquation (2)(2)
(2) describes the neutron transport from each fuel assembly to the outer vessel surface. EquationEquation (3)
(3)
(3) describes pure geometric transport from the vessel surface to the detectors location. The variable r is the distance, and the constant macroscopic cross section for the medium used in EquationEquation (2)
(2)
(2) is given in [Citation8], 0.115 cm−1.
This model is applied to the nodes ‘seen’ by each channel, obtaining the proper Excore weighting factors, as shown in Figure S2 of the supplemental material. It means that for each Excore location, the nearest nodes are contributing to the detector response with a different weight factor depending on the distance.
Axially, each redundancy (top and bottom) is supposed to ‘see’ (detect) a half of the core. Then, the axial weighting factor for the bottom detectors is 1 for nodes from 2 to 17, and 0 for nodes from 18 to 33. For top detectors, the axial weighting factors are switched, and the axial weighting factor for nodes 2 to 17 is 0, and for nodes from 18 to 33 is 1.
2.1.3. PARCS data processing
In this work, two different versions of PARCS code have been used. RELAP5/mod3.3 has been coupled with PARCS v2.7, since this coupled code is the workhorse of the ISIRYM-UPV research group. The last distribution of TRACEv5.0P3 includes the coupling with the new neutronic code version, PARCS v3.0. Thus, this distribution is used as is, in order to test TRACE/PARCS new model options.
In PARCS v2.7, subroutine genedits.F was modified to read from external files the information about Incore and Excore detectors, i.e. its location and proper axial and radial weighting factors. Further modifications write the thermal flux and the relative power for the nodes of interest. Then, this data is processed with a MATLAB® program for comparison purposes.
In PARCS v3.0, the nodal thermal flux and power is extracted from the regular output file and is processed with MATLAB® generating a proper format for the comparison.
2.2. RELAP5 thermalhydraulic model
RELAP5/mod3.3 is a thermalhydraulic code developed for best-estimate simulation of the core cooling system transients during design basis accidents and AOOs. This code models the behavior of the reactor and core cooling system for accidents involving loss of coolant and operational transients, for instance, transients without SCRAM, loss of power, loss of feedwater, etc. It is based on a two-fluid model for two-phase flow systems which are solved using semi-implicit methods.
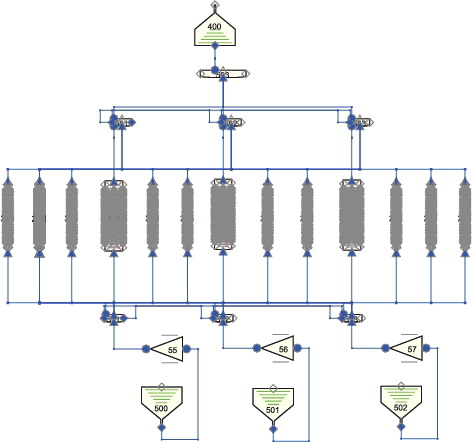
In this work, only the reactor core with boundary conditions is modeled. A sketch obtained with SNAP tool is shown in . Each fuel assembly is modeled with a pipe+heat structure component (following a one-to-one channel basis). The same set is used to model the by-pass channels. Axially, the components representing the active zone of fuel assemblies are divided in 32 levels.
Figure 3. Scheme of RELAP5 model for the reactor core.
The inlet boundary conditions are the moderator temperature and the mass flow. To model the core inlet, three time-dependent volumes + time-dependent junctions are used, corresponding to the three different coolant loops. These inlets are connected to the channels through three branch components.
The pressure and the coolant temperature are used as outlet boundary conditions. These are set in a time dependent volume component, however, they are constant for the whole transient. Details for the boundary conditions can be seen in . The thermalhydraulic channels are connected to the outlet using three additional branch components, corresponding to the three hot legs.
Table 1. Boundary conditions details.
A radial map is used (see Figure S3 (left plot) of the supplemental material) to connect each thermalhydraulic channel to its inlet branch. This radial map is based on the situation of the coolant inlet loops around the reactor. The theoretical situation of the three by-pass elements is also based on the inlet loops situation.
A similar radial map (see Figure S3 (right plot) of the supplemental material) is used to arrange the channels outlet in the three superior branch components. Therefore, a channel could be connected to a different inlet/outlet branch (their radial distribution does not spatially match at the inlet and outlet).
Even though the model presented in this study does not contain the recirculation loops, the model is capable to represent the rod drop transient, since this transient has large 3D neutron distribution implications. In a real reactor, the control system would act accordingly to maintain the average temperature. Thus, some control rod banks position could be modified. Although these are not simulated in this study, for the purpose of this paper, these simplifications are accepted.
The data used to prepare this model is obtained from CNAT [Citation9]. The model is automatically obtained, thanks to a MATLAB program developed for this purpose. The core mass flow is adjusted by changing the bypass loss coefficients.
2.3. TRACE thermalhydraulic model
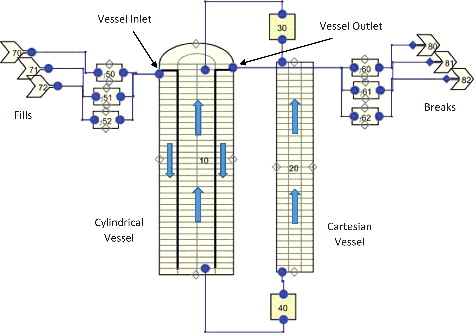
The TRACE model used in this work is based on previous studies [Citation10]. The traditional models used pipe or channel components to simulate each fuel assembly. However, as an important improvement, this new model simulates a realistic fully 3D core reactor. This is accomplished using the vessel component available in TRACE, which is a 3D component.
The fuel assemblies are simulated with a Cartesian vessel, only available in TRACE. This element provides the cross-flow between each fuel assembly node, which is an improvement over previous models. The flow area fraction for the corner cells is set to zero, thus the Cartesian vessel is shaped as the radial mapping for the studied NPP.
Furthermore, the model contains a second vessel, a cylindrical one. The cylindrical vessel is divided in two radial cells, three azimuthal cells and 36 axial cells. The inner radial cell represents the bypass and the outer radial cell represents the downcomer. The three azimuthal cells represent the three different reactor recirculation loops. The lower and the upper axial cells represent the lower and upper reactor plenums. The upper plenum has three different break components, each one connected to a different azimuthal cell. Three fill components are connected to a lower level.
Moreover, in order to connect both vessels, one-cell pipes are used in the sideward connections and single junctions are used as axial connections. One heat structure associated with each bypass azimuthal sector is used in the cylindrical vessel. Finally, one heat structure for each azimuthal sector is used to model the barrel heat transfer between the bypass and the downcomer. The other details, such as assembly heat structures components, azimuthal sector association with assemblies and bypass are simulated as it was explained for RELAP model. See for a simplified cylindrical model (5 × 5 vessel without lateral junctions), sketch using SNAP tool.
Figure 4. Scheme of TRACE5.0P3 model for the reactor core.
The core is modeled using 3D components, which are connected node to node, the bypass mass flow has a strong variation along its way through the vessel. Thus, not only the bypass friction factor must be adjusted at each node, but also among the three different azimuthal sectors. This is a hard task, even for expert users. Fortunately, an automatic iterative process was developed to adjust the bypass friction factor for each level and each azimuthal sector. It was also proved to work successfully [Citation11].
The strong effort done (almost 2600 components and over 150,000 input lines) is expected to improve the accuracy and also reflect a realistic behavior in front of some perturbations, for example different inlet temperature in each azimuthal zone.
2.4. SIMTAB methodology for cross-sections acquisition
The cross-section data are obtained from CASMO-4/SIMULATE-3 files by means of the SIMTAB [Citation12] methodology.
SIMTAB was developed at the Institute for Industrial, Radiophysical and Environmental Safety at Universitat Politècnica de València (ISIRYM-UPV) in collaboration with Iberdrola Ingeniería y Construcción (IBIC). SIMTAB was validated for both PWR and Boiling Water Reactor (BWR). This methodology simplifies the reactor core providing a set of tabulated cross-sections and kinetic parameters parameterized in terms of local and control variables (moderator density, fuel temperature, boron concentration and control rod). Thus, the reactor core can be modeled with a few number of neutronic regions and its kinetic behavior well characterized.
For this work, the beginning of cycle (BOC) configuration for fuel cycle 23 of the studied NPP is modeled. SIMTAB methodology reduces from around 5600 neutronic compositions to 1379 (1376 corresponding to active nodes and 3 corresponding to the lower, upper and radial reflectors).
Comparison between steady-state simulations (PARCS alone and coupled RELAP5 and TRACE) are shown in . and show the axial and radial power profiles, respectively. Errors for the keff are calculated against the SIMULATE-3 result, which is 1.00014. The keff obtained with TRACE is slightly bigger than that obtained with RELAP, the main reason for that is the difference in the thermal-hydraulic models between both thermalhydraulic codes.
Table 2. Results for SIMTAB cross-sections.
Figure 5. Relative power per axial plane. Comparison between PARCS stand-alone results, coupled stationary case results for RELAP5 and TRACE codes and the reference, SIMULATE-3.
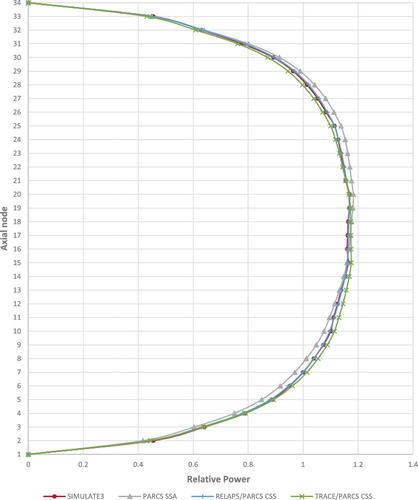
Figure 6. Relative radial errors respect to the reference, SIMULATE-3. comparison between RELAP5 and TRACE coupled stationary case results.
3. Results
compares the computational cost for each code and shows the CPU time for each simulation. It can be observed that the high definition obtained with TRACE code has an important computational cost compared to RELAP5 code performance. PARCS stand-alone simulation, for both 2.7 and 3.0 versions, is not taken into account since the CPU time required is about 90 seconds, which is considered negligible for this comparison.
Table 3. Simulation time.
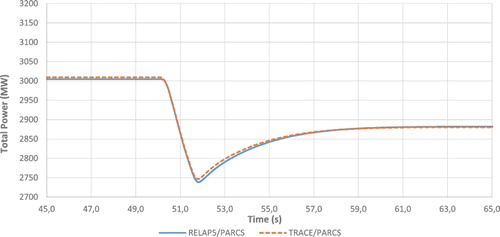
Total power evolution during the transient for both codes is shown in . The power evolution is very similar for both codes.
Figure 7. Total power evolution. Comparison between RELAP/PARCS and TRACE/PARCS results.
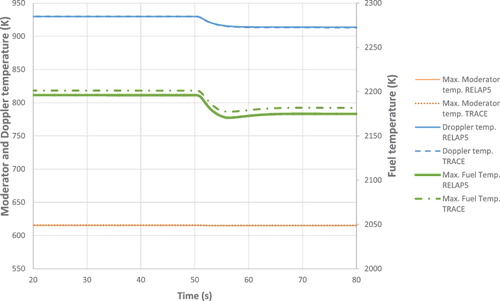
Reactivity and temperatures evolution during transient are also analyzed (see and ). Moderator temperature decreases as the nuclear power decrease (by the absorber insertion). Consequently, the moderator density grows causing an increase in the moderation of neutrons in the reactor core. This produces a growth in the reaction rate, as a result, in few seconds the fuel temperature and the power increase until a new stationary point is reached.
Figure 8. Reactivity evolution.
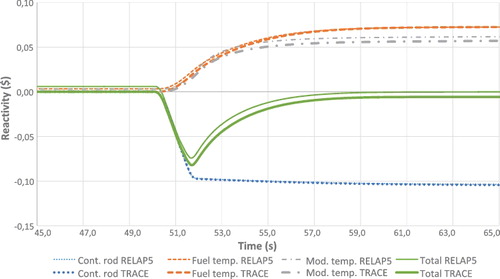
Figure 9. Temperatures evolution.
The decrease of the reactivity due to the control rod insertion is countered with the reduction of moderator and fuel temperature reactivities. This thermalhydraulic feedback effect is shown in .
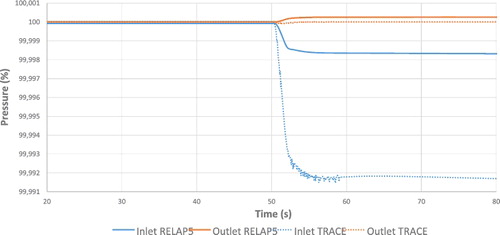
Evolution of coolant inlet and outlet pressure are presented in , it proves that the acceptance criteria mentioned in the introduction is fulfilled. The pressure at 100% corresponds to the inlet/outlet coolant pressures at initial time of the transient simulation. For both codes, the coolant inlet pressure decreases with the control rod insertion and the outlet pressure increase is lower than 0.001%. The outlet pressure is fixed as a boundary condition in the model. Thus, even if it is measured in a component previous to the outlet time dependent volume, its variation is significantly restricted. This simplification is valid since the real behavior of a KWU-SIEMENS NPP is driven by temperature and pressure programs. This ensures the stability of the outlet pressure for this kind of transients and thus, the limitation for this parameter is never reached.
Figure 10. Pressure evolution.
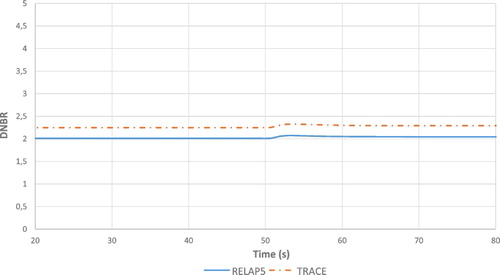
Regarding to the DNBR calculation (see ), it is observed that RELAP5 and TRACE codes use different methods to obtain de critical heat flux (CHF). RELAP5 [Citation13] uses the 1986 AECL-UO CHF Lookup Table method [Citation14]. This table is obtained for tubes with 0.008 m diameter. Up to eight multiplying factors are applied to correct the CHF values obtained from the tables. TRACE [Citation15] uses the AECL-IPPE CHF Table [Citation16], and implements only two multiplying factors to correct the CHF values obtained from the tables (previous version [Citation14]). Besides, these two factors are used in an exclusionary manner, and therefore only one correction is applied to the CHF obtained in TRACE. These factors are: the correction for tube diameter, k1, and the correction for rod bundle geometry, k2. TRACE considers that rod bundle geometry is always used (pitch to diameter ratio always greater than one). Therefore, TRACE will always apply only the k2 correction factor. However, the difference between the actual hydraulic diameter and the diameter in the tables is not negligible. Thus, TRACE code was modified to apply both factors in order to obtain the CHF final value. Despite these differences, during this transient the DNBR increases with the control rod insertion. The highest value is the initial value that corresponds to steady-state conditions at 100% of the nominal power, therefore the NRC limitations about DNBR are not exceeded.
Figure 11. Departure from nucleate boiling ratio (DNBR) evolution.
Slight differences between RELAP5 and TRACE cases can be observed for the hot leg (outlet) pressure. The reduction of these differences is left as future work. Despite of this, as it is shown in the results, it is considered that both coupled codes give an adequate result.
Incore detector J06 and Excore channels PR3 results are presented, since are the closest to the control rod dropped during the test (J03) (, , and Figures S4–S7). Comparison plots for other detectors and channels can be seen in the supplemental material. In these Figures, the comparison includes both coupled codes results, besides SIMULATE-3K results and real signals provided by CNAT [Citation17]. SIMULATE-3K is an advanced, two-group nodal code, which delivers neutronic and thermal-hydraulic analysis with licensing-grade accuracy.
Figure 12. Real and calculated signals for Incore detector J06, axial level 6 (inlet).
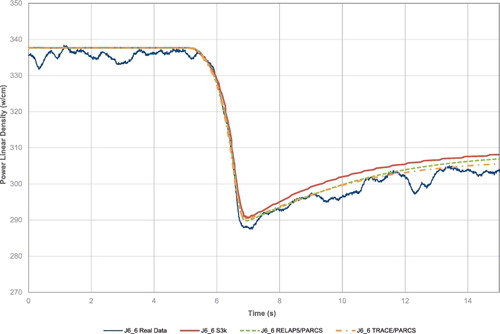
Figure 13. Real and calculated signals for Excore detector PR3, bottom.
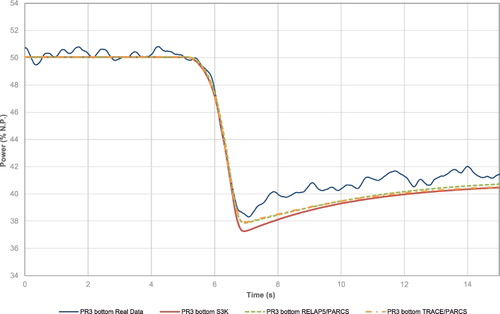
In all cases, the results are very close to the real data provided by plant, both for Incore and Excore detectors signals. Fluctuations observed on the real data signals for all detectors are due to neutronic noise. Figure S4 shows a faster power drop on calculated signals than the test results, while other signals (as in , , and Figure S5) show a good agreement for the power evolution. This is due to these fluctuations on neutronic flux, which make the real signal to apparently decrease slowly if the rod drop matches with a positive flux deviation.
A deeper fall in the power evolution is observed in and Figure S4, corresponding to the signal for Incore detector J06. That is due to the neutronic flux influencing each kind of detector. For Incore detectors, the signal corresponds to the neutronic flux present in the nodes where it is located. That is only two axial nodes in a radial location near to the control rod falling (); detector E04 shows a smaller change in the neutronic flux (Figures S6 and S7) since it is located further from the control rod than detector J06. For Excore detectors, the signal corresponds to the average of a significant number of nodes, about 60 radial positions and 16 axial positions. These are, in average, farther from the control rod than the Incore detector J06. Thus, since the detector is, indeed, out of the core (), the signal is decreased by a geometrical transport equation.
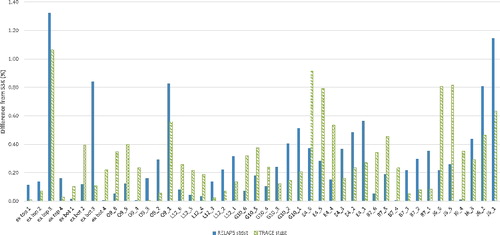
Comparison between codes shows some differences with SIMULATE-3K results (, and ). Cross-sections that feed PARCS code are obtained using SIMULATE-3K, but the collapsing methodology slightly reduces the results definition.
Comparing SIMULATE-3K with both coupled codes, similar maximum relative errors are obtained in the minimum power reached and the stationary value reached after it. For the minimum power reached, the maximum relative error for the Excore detectors obtained is about 2% (). Whereas it is about 0.5% for the Incore detectors. For the stationary state obtained after the control rod drop, the maximum error is about 1.6% for the Excore detectors and 1% for the Incore detectors ().
Figure 14. Difference, in %, between RELAP5 and TRACE codes results and SIMULATE3-K results. Minimum value of the simulated signal after the control rod drop for Incore and Excore detectors.
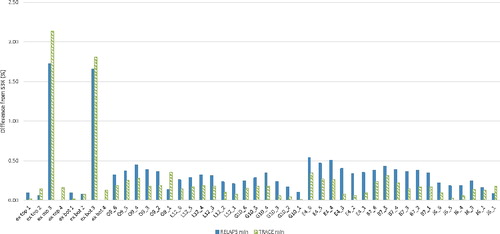
Figure 15. Difference, in %, between RELAP5 and TRACE codes results and SIMULATE3-K results. Simulated signal value once the new power level is reached for Incore and Excore detectors.
The relative errors between the thermalhydraulic-neutronic coupled codes and the real signals are also calculated. For the minimum power reached during the control rod drop, the maximum relative error is about 5% for all three codes compared (RELAP5/mod3.3/PARCSv2.7, TRACE5/PARCSv3.0 and SIMULATE-3K). For the stationary value reached after the control rod drop, the maximum relative error is around 2.5% for all three codes.
Finally, the 3D cross-flow predicted by TRACE5/PARCS is evaluated near the control rod inserted, these are sketched in . shows a scheme of the cross-flows. The shaded square is the fuel assembly where the control rod is inserted.
Figure 16. Cross-flow change during the transient in Y axis (right) and X axis (left).
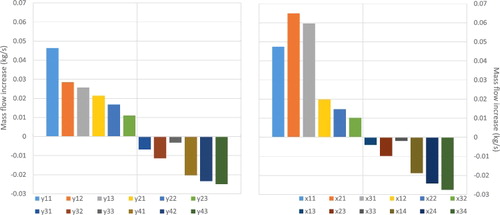
Figure 17. Scheme of the analyzed cross-flows.
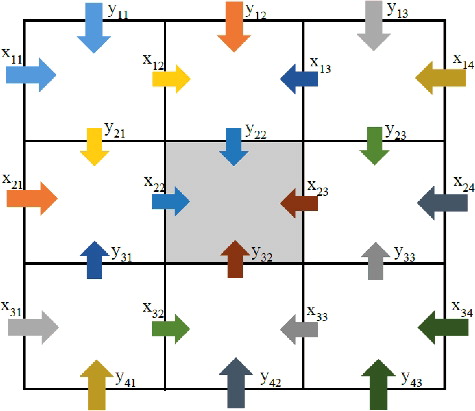
The control rod insertion causes a decrease on the moderator temperature (as in ). Thus, the moderator density increases and the pressure decreases (as can be seen in ). This change in pressure provokes increments on the cross-flows flowing from the nearer nodes towards the node where the control rod is inserted. shows the flow increment at axial level 15 just after the control rod is inserted.
4. Summary and conclusions
New models of the studied NPP are developed for 3D neutronic-thermalhydraulic codes RELAP5/mod3.3/PARCSv2.7 and TRACEv5.0P3/PARCSv3.0. These models describe three inlet loops with separated components. Therefore, the introduction of different perturbations in each loop will be easily accomplished in future works. As a new feature, TRACES5.0P3 model introduces a core fully discretized in 3D, one Cartesian vessel simulating the fuel assemblies and a cylindrical vessel that models the bypass and the downcomer.
These codes are benchmarked against a real control rod drop test carried out in a commercial PWR. For both codes, the simulated transient fulfills the acceptance criteria defined by the NRC (pressure and DNBR) as expected (the transient was a planned test). Results are compared with the real data of control rod drop test performed at the NPP and SIMULATE-3K (results obtained by CNAT). These results show a good agreement with the reference code. The relative error in the minimum power due to the control rod drop insertion is lower than 5%. Whereas the relative error for the steady state power reached after the transient is lower than 2.5%. The evolution of the transient fits with the reference data and the real plant data, with relative errors around 0.5% and 0.8%, respectively.
Obtaining cross-flows between fuel assemblies in TRACE5 code is a new capability that turns this code into a valuable tool for thermalhydraulic transient analyses. Especially if it involves asymmetric deviations of parameters.
Regarding the computational cost, while both codes have an acceptable performance, TRACE5.0p3 implies a higher simulation time. Thus, its advantages should be assessed taking this criterion into account.
Although both codes have proved to be accurate enough to recreate this type of transient, the use of the 3D model improves the performance of the simulation. The new capability to obtain the Incore and Excore neutron detectors response was validated and will be used in future neutron noise studies and other works where its capability is needed.
It is remarkable fact that this work had access to experimental data obtained during a control rod drop test. This made possible two things. First, it was possible to qualify the 3D coupled code used to simulate this type of transients. Second, new valuable tools are developed for future studies.
Future works will include the simulation of different perturbations of the thermalhydraulic inlet parameters. Furthermore, given the multiple possibilities for the cartessian vessel, TRAC5.0P3 model will be modified to improve its accuracy.
Supplementary_Data.pdf
Download PDF (1.3 MB)Acknowledgments
The authors would like to acknowledge the economic support provided by Centrales Nucleares Almaraz-Trillo (CNAT) and IBERDROLA Ingeniería y Construcción (Iberinco) for the realization of this work, and express their great appreciation to Arturo López, Juan Antonio Bermejo and Alberto Ortego for their valuable collaboration and their willingness to develop this work. This work has also been supported by the Spanish Ministerio de Economía y Competitividad, through the projects NUC-MULTPHYS (ENE2012-34585) and VALIUN-3D (ENE2011-22823), and the Generalitat Valenciana (GVA), through the project PROMETEO II/2014/008.
Disclosure statement
No potential conflict of interest was reported by the authors.
Related Research Data
References
- Miró R, Verdú G, Sánchez AM, et al. Analysis of a rod withdrawal accident in a BWR with the neutronic-thermalhydraulic coupled code TRAC-BF1/VALKIN and TRACE/PARCS. PHYSOR-2006. 2006;43:1511–1519
- Barrachina T, Garcia-Fenoll M, Ánchel F, et al. REA 3D-dynamic analysis in Almaraz NPP with RELAP5/PARCS v2.7 and SIMTAB cross-sections tables. Prog Nucl Energ. 2011;53:1167–1180.
- Ánchel F, Barrachina T, Miró R, et al. Uncertainty and sensitivity analysis in the neutronic parameters generation for BWR and PWR coupled thermalhydraulic–neutronic simulations. Nucl Eng Design. 2012;246:98–106.
- High Burnup Fuel PIRT Panel. Phenomena identification and ranking tables (PIRTs) for Rod Ejection Accidents in Pressurized Water Reactors Containing High Burnup Fuel, Los Alamos (NM): Los Alamos National Laboratory. 2001.
- U. S. NRC. Standard Review Plan. Chapter 15.0 Introduction -Transient and Accident Analysis. NUREG-0800.Washington (DC): U. S. Nuclear Regulatory Commission. 1987.
- MATLAB and Statistics Toolbox Release. The MathWorks S.L. Natick (MA); 2013.
- Ortego A, Modelo CN. Trillo mediante los códigos CASMO-4/SIMULATE-3 [Trillo NPP model with CASMO-4/SIMULATE-3]. Madrid (Spain): Centrales Nucleares Almaraz y Trillo. 2004.
- Tochihara H, Ochiai E, Hasegawa T. Re-evaluation of spatial weighting factors for EX-CORE neutron detectors. Nucl Technol. 1982;15:310–317.
- Simulación de CN. Trillo con RELAP5 módulo YC - vasija del reactor [RELAP5 Trillo NPP simulation - YC module - reactor vessel]. Madrid (Spain): Centrales Nucleares Almaraz y Trillo. 2002.
- Mesado C, Barrachina T, Miró R, et al. PWR simulation using a 3D vessel with TRACE/PARCS. The 15th International Topical Meeting on Nuclear Reactor Thermal-Hydraulics, NURETH-15; 2013 May 12–17; Pisa, Italy.
- Mesado C, García-Fenoll M, Miró R, et al. Modelado de un PWR mediante componentes 3D [PWR model with 3D components]. 39º Reunión anual de la sociedad nuclear española. Reus: SNE. 2013; p. 25–27.
- Roselló O. Desarrollo de una metodología de generación de secciones eficaces para la simplificación del núcleo de reactores de agua ligera y aplicación en códigos acoplados neutrónico/termohidráulicos [Development of a metholodogy for cross section generation for LWR core simplification and its aplication to neutronic/thermal-hydraulic coupled codes]. [PhD thesis]. València (Spain): Universitat Politècnica de València.2004.
- RELAP5/MOD3.3 code manual. Volume IV: models and correlations. Washington (DC): U. S. Nuclear Regulatory Commission. 2001.
- Groeneveld DC, Leung LKH, Kirillov PL, et al. The 1995 look-up table for critical heat flux in tubes. Nucl Eng Design. 1996;163:1–23.
- TRACE v5.0 Theory Manual. Field equations, solution methods and physical models. Washington (DC): U. S. Nuclear Regulatory Commission. 2012.
- Groeneveld DC, Cheng SC, Doan T. AECL-UP critical heat flux lookup table. Heat Transfer Eng. 1986;7:46–62.
- Bermejo JA, Encinas L, López A, et al. Análisis de fluctuaciones termohidráulicas en C. N. Trillo con SIMULATE-3K [Thermal-hydraulic fluctuations analyses with SIMLATE-3K at Trillo NPP]. 38ª Reunión anual de la sociedad nuclear española. Cáceres: SNE. 2012; p. 17–19.