
 ?Mathematical formulae have been encoded as MathML and are displayed in this HTML version using MathJax in order to improve their display. Uncheck the box to turn MathJax off. This feature requires Javascript. Click on a formula to zoom.
ABSTRACT
The perceived benefit and risk of nuclear power generation have received considerable attention as determinants of the public's nuclear power acceptance. However, the contingency of the relative importance of these benefit and risk has been less explored. Using Korea as an example, this study explores the possibility that the relative importance of perceived benefit and risk on nuclear power acceptance depends on acceptance levels. Our results from latent class analysis and multinomial probit show that, in determining whether an individual shows a moderate level of nuclear power acceptance rather than a low level, perceived risk plays a dominant role compared to perceived benefit; however, regarding whether he/she shows a high level of nuclear power acceptance rather than a moderate level, this relative importance is reversed. These results carry practical implications for risk governance of nuclear power, particularly with regard to communication with the public.
1. Introduction
Nuclear power is an electric power production source that carries great risks while offering great benefits (i.e. reducing dependency on fossil fuel, which is costly not only economically but also environmentally) [Citation1]; however, it is accompanied by potential risks of nuclear catastrophes [Citation2]. Thus, typically, there are sharp conflicts over nuclear power among the stakeholders in a given country [Citation3].
This double-sidedness of nuclear power generation – great benefits and risks together – and the resultant conflicts render considerations of these benefits and risks in risk governance of nuclear power generation important in the following ways. First, generally in risk governance – the institutional and social processes that guide the collective decisions and activities of a society with regard to risks [Citation4,Citation5], public response to risks or risky targets is an essential consideration, as the public is an important actor group in risk governance [Citation6]. In particular, in risk governance of nuclear power, the public's acceptance of nuclear power exerts significant influences on the country's nuclear power policy [Citation7–10]. Second, both benefit and risk are significant considerations in risk governance, since risk-related decision-making is not solely about the risks themselves, but based on risk(s)–benefit(s) evaluations. Indeed, some risk is considered tolerable if the benefits that it carries are worth pursuing [Citation4–6]. Third, consistent with the importance of considering benefits and risks, benefit perception has proved to facilitate acceptance while risk perception deters it [Citation11,Citation12]. Overall, these factors have brought research attention to the effects of public perception of benefits and risks on public acceptance of nuclear power (e.g. [Citation13–16]).
However, although these effects themselves have been well established, the degree to which they differ across acceptance levels remains relatively unexplored: do perceptions of benefits and risks have similar importance in softening public opposition and moderating the opinion of those opposed to nuclear power generation? Do they play a similarly important role in leveraging moderate opinions on such generation toward positive agreement? If this contingency exists, it will carry practical implications for risk governance of nuclear power, particularly with regard to communication with the public – a significant actor group in the risk governance of nuclear power, and, of course, the backbone of a society. In other words, strategies for raising nuclear power acceptance, including technological development and institutional arrangement as well as public communication, will need to vary according to the goal (i.e. whether to promote positive agreement or to soften public voices of opposition).
To explore the possibility of the aforementioned contingency, we analyzed a nationwide sample from Korea – one of the leading countries in nuclear power generation. First, we clustered the subjects according to their nuclear power acceptance levels, using latent class analysis (LCA). Second, using this latent class membership of a respondent as the index for his/her nuclear power acceptance level, our multinomial probit analysis investigated whether the perceived benefit and risk of nuclear power generation have different levels of relative importance in enhancing nuclear power acceptance, depending on the levels of such acceptance.
2. Analytic strategy
2.1. Latent class analysis to segment the sample according to nuclear power acceptance
In our research context, identifying the dependent variable – an individual's overall nuclear power acceptance level – required the following considerations. First, in a public survey, such acceptance levels are commonly measured using multiple indicators. Second, when combining these multiple indicators into a variable to represent an individual's overall nuclear power acceptance level, the level needed to be provided in the form of a multinomial categorical variable. We assumed that the effects of perceived benefit and risk on nuclear power acceptance might differ across the levels of such acceptance. These non-parallel effects can be investigated when the dependent variable is treated as a multinomial categorical variable (e.g. as in a multinomial logit or probit).
LCA [Citation17,Citation18] is a technique that meets these requirements. It identifies unobservable subgroups (i.e. latent classes) within a sample based on multiple observed variables that are categorical or ordinal [Citation18]. Individuals within a latent class share the pattern in the observed variables, while those from different classes are distinct in the variable levels. In our latent class model with nc classes from a set of M variables on nuclear power acceptance, let the vector Yi = (Yi1,… , YiM) represent individual i's values for the M variables, where the possible values of Yim are 1,… , rm; let Li = 1, 2,… , nc be the latent class membership of individual i; and let I (y = k) be the indicator function (i.e. takes 1 if y equals k, and 0 otherwise). When taking the last class as the reference class, the probability that individual i has the current responses as y is expressed as in EquationEquation (1)(1)
(1) :
(1)
(1)
The γ parameter denotes the probability that the individual belongs to a specific latent class; usually, the subject is regarded as belonging to the latent class with the highest γ. The ρ parameter expresses the item-response probability, which is conditional on latent class membership. The optimal number of nc is determined by comparing fit indexes by varying nc [Citation17].
2.2. Multinomial probit analysis regarding the effects of perceived benefit and risk on latent class membership
We adopted a multinomial probit approach [Citation19] to investigate the association between an individual's perception of the benefit and risk of nuclear power generation with his/her latent class membership, which we took as the indicator of his/her overall nuclear power acceptance level. When there are nc latent classes (i.e. 1, 2,… ,nc), subject i's latent class membership Ci is determined by the latent dependent variable, Ci*, as in EquationEquation (2)(2)
(2) :
(2)
(2)
Here, Cn*i is influenced by vector Xi – the covariates: the benefit and risk perceptions (our main interested independent variable) and socio-demographic features (control variables) of subject i. Also, ϵ – the vector of residuals ϵs – follows a multivariate normal distribution – – with ϵs being correlated to each other.
3. Data collection
3.1. Sample
We used a survey dataset built by the Korea Nuclear Energy Agency – a Korean government-affiliated organization – in 2016, targeting the population of adult residents aged 19 and over in South Korea. The first author of the present study participated in the development of the survey including the overall survey design and item development. The survey adopted a quota sampling method: the subjects were selected based on specified proportions of demographic and geographic sub-populations so that the sample could well represent the population. Among the original sample of 1000, we screened out 48 respondents whose responses were missing regarding either of the two measurement items for nuclear power acceptance, which were essential to our analysis. summarizes the characteristics of the research sample (N = 952).
Table 1. Sample profile (N = 952).
3.2. Measures
3.2.1. Independent variables
To measure the respondents’ overall perception of the benefit of nuclear power generation, four items were used regarding the main points in public relations efforts by the Korea Nuclear Energy Agency (source: interview with an agency staff): inexpensive electricity supply, stable electricity supply, contribution to national economic growth, and greenhouse gas reduction. Each item used a four-point Likert scale (1 = strongly agree and 4 = strongly disagree) and the responses were reverse-coded.
Benefit 1: Nuclear power generation contributes to inexpensive electricity supply in our country.
Benefit 2: Nuclear power generation contributes to stable electricity supply in our country.
Benefit 3: Nuclear power generation contributes national economic growth.
Benefit 4: Nuclear power generation contributes to the reduction of greenhouse gas such as carbon dioxide.
Perceived risk from nuclear power generation was measured using two four-point scale items (1 = very safe(ly) and 4 = not safe(ly) at all).
Risk 1: Do you think nuclear power plants in our country are safe or not?
Risk 2: Do you think radioactive waste in our country is managed safely or not?
Confirmatory factor analysis showed that this measurement model fits the data to a satisfactory level (χ2(8) = 17.055, normed χ2 = 2.132, p < 0.05, comparative fit index = 0.996, Tucker–Lewis index = 0.993, standardized root mean square residual = 0.012, root mean square error of approximation = 0.039), with all the factor loadings being significant and substantial (ps < 0.001, loadings > 0.50). The convergent validity (perceived benefit: average variance extracted (AVE) = 0.614, composite reliability (CR) = 0.864; perceived risk: AVE = 0.598, CR = 0.746) and the discriminant validity (each of the AVE > square of the correlation between the benefit and the risk (0.7432)) were satisfactory [Citation20].
3.2.2. Indicators for nuclear power acceptance
Acceptance of nuclear power generation was measured using two items. The responses were reverse-coded.
Acceptance 1: Considering the situation of our country, do you think nuclear power generation is necessary or not? (1 = very necessary and 4 = not necessary at all).
Acceptance 2: What is your opinion on the number of nuclear power plants that should be operating in our country? (1 = should decrease further from the current level,…, 3 = should maintain the current level,…, and 5 = should increase further from the current level).
3.2.3. Control variables
Gender, age, educational level, and household income level were measured as general socio-demographic control variables. In addition, we determined the respondent's residential area and retrospectively classified those areas according to whether and when they experienced the construction of nuclear-related facilities (for details, see Section 4.2).
4. Analyses and results
4.1. Latent class solution for nuclear power acceptance level
Regarding the two indicators for nuclear power acceptance (i.e. Acceptance 1 and 2), we conducted a series of LCAs, using the LCA Stata Plugin developed by Lanza et al. [Citation21]. shows the model fits of the latent class solutions with different numbers of pre-assumed classes. The three- and four-class solutions fit the data better than the other solutions. The former reveals the best fit regarding the Bayesian information criterion (BIC) and the consistent Akaike information criterion (CAIC); the latter has a fit close to the best regarding log likelihood and the best fit regarding the AIC. compares the three- and four-class solutions regarding AIC and BIC – the two criteria most commonly used to compare non-nested models [Citation22]. The ratio of the two solutions’ Akaike weights [Citation23] shows that the four-class solution has 16.61 (= 0.94/0.06) times higher likelihood of being a better model than the three-class solution; the ratio of the solutions’ Schwarz weights shows that the three-class solution has 16,601,440 (= 1.00/6.02 × 10−8) times higher likelihood of being a better model than the four-class solution. These results indicate that the three-class solution generates fewer discrepancies (better fit) than the four-class solution. Thus, we finally chose the three-class solution.
Figure 1. Goodness-of-fit according to number of classes. X-axes denote the number of pre-assumed latent classes.
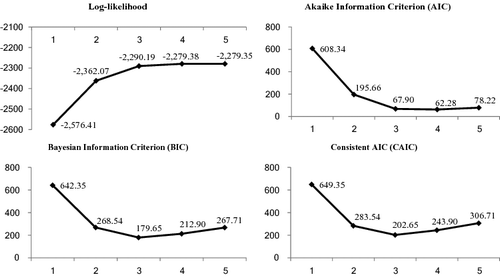
Table 2. AIC and BIC analyses for the three- and four-class solutions.
presents the respondents’ answers to the two measures of nuclear power acceptance according to the extracted latent classes. The distributions of the responses show that the classes represent different levels of nuclear power acceptance in the order of Class 1 < Class 2 < Class 3. We designate Class 1 (N1 = 220; 23.11% of the whole sample) as an Anti-nuclear power cluster since the absolute majority of the class members regarded nuclear power generation as unnecessary (i.e. 47.73% for ‘somehow unnecessary’ and 37.27% for ‘not necessary at all’) and thought that the number of nuclear power plants should be decreased (i.e. 72.27% for ‘decrease much further’ and 23.64% for ‘decrease a little bit’). Similarly, we term Class 2 (N2 = 426; 44.75%) as a Moderate cluster and Class 3 (N3 = 220; 32.14%) as a Pro-nuclear power cluster.
Table 3. Nuclear power acceptance according to latent classes.
4.2. Multinomial probit results
shows the result of our multinomial probit regression. The outcome variable – the cluster membership of an individual – denotes his/her nuclear power acceptance level, in the order of Anti-nuclear power cluster < Moderate cluster < Pro-nuclear power cluster. With the Moderate cluster as the reference (baseline) group, the coefficient of a variable denotes the variable's effect on the likelihood that an individual would belong to a given cluster (i.e. Anti-nuclear power cluster or Pro-nuclear power cluster) compared to the reference group. Thus, in the left (right) set of estimates regarding the Anti-nuclear power cluster (Pro-nuclear power cluster) compared to the Moderate cluster, a positive coefficient means the variable has a negative (positive) effect on nuclear power acceptance.
Table 4. Determinants of cluster membership: multinomial probit.
Among the control variables, the respondent's residential area reveals an interesting point. When we initially divided the area into two groups – metropolitan cities/provinces without a nuclear power plant or radioactive waste facility and those with – the area variable did not exert a significant effect on the respondent's cluster membership. However, after we re-classified the area based on different criteria – metropolitan cities/provinces that never experienced the construction of a nuclear power plant or radioactive waste facility or experienced it before the year 2000 and those in which a plant or facility was constructed after the year 2000 (i.e. the nuclear power plants of Shin Kori unit 4, Shin Uljin unit 1, and nuclear waste site of Gyeongju) – the variable's effect proved significant. In short, recent construction of nuclear-related facilities exerted a significantly negative influence on whether an individual belonged to the Moderate cluster compared to the Anti-nuclear power cluster, although it did not have a significant effect on whether an individual belonged to the Pro-nuclear power cluster or the Moderate cluster (see ). Overall, these findings imply that recent local controversies about the construction of nuclear-related facilities push residents’ acceptance of nuclear power from moderate to negative levels; however, such an effect is likely to be mitigated as time passes.
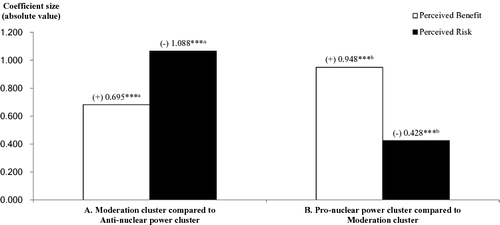
Perceived benefit and perceived risk are found to exert positive and negative effects on nuclear power acceptance, respectively, which is consistent with extant findings (e.g. [Citation13–16]). compares the absolute sizes of these coefficients. As (A) shows, regarding whether an individual belonged to the Moderate cluster compared to the Anti-nuclear power cluster, perceived risk exerted a stronger effect than perceived benefit. However, as (B) shows, regarding whether an individual belonged to the Pro-nuclear power cluster compared to the Moderate cluster, such relative importance was reversed; perceived benefit exerted a stronger effect than perceived risk.
Figure 2. Relative coefficient sizes of perceived benefit and risk. ***p < 0.01. (+) A positive effect on the membership to the cluster with the greater level of nuclear power acceptance; (−) a negative effect on such membership. The perceived benefit and the perceived risk variables have been standardized. aCoefficient sizes are different at the 0.10 level (p = 0.062); bdifferent at the 0.01 level (p = 0.006).
5. Conclusion
This explorative study shows that, in leveraging the public's nuclear power acceptance, the relative importance of the perceived benefit and risk of nuclear power generation may differ depending on acceptance levels. This implies that the focus of a public communication strategy to encourage nuclear power acceptance should be varied according to the communication goals as follows. To soften opposing voices to moderate levels, reducing perceived risk is likely to be more effective than leveraging the perception of benefit. On the contrary, in leveraging moderate levels of nuclear power acceptance to positive levels, leveraging perceived benefit is likely to be more effective. This contingency relating to the relative importance of benefit and risk also applies to resource investment on and institutional arrangement for nuclear power technology. Although perceptions of benefit or risk regarding a specific technology may not perfectly match actual levels [Citation24], the latter are the basis for the former. Thus, the nuclear industry professionals and policy-makers who aim to enhance the public's nuclear power acceptance through risk governance should devote resources and effort to both strengthening the actual benefits and reducing the actual risks of nuclear power generation. However, according to the findings of the present study, industry professionals and policy-makers need to vary investment priorities between such benefits and risks according to the policy objects (i.e. whether the policy aims to soften public opposition to nuclear power generation or to promote public agreement with nuclear power).
For generalization and extension of these findings and implications, future research under various research settings (e.g. different countries) would be necessary. In these further studies, the present study's analytic strategy – combining LCA and a multinomial choice model – is worthy of consideration. To investigate the effects of perceived benefit and risk on nuclear power acceptance, which are possibly dependent on such acceptance levels, the acceptance levels need to be treated as a multinomial categorical variable (e.g. as in a multinomial logit or probit) rather than a continuous variable. To draw the overall acceptance level from multiple indicators to a single index that is in the form of a multinomial categorical variable, LCA would be a useful approach.
Acknowledgment
The authors wish to thank the Korea Nuclear Energy Agency for the permission to use the survey data.
Disclosure statement
No potential conflict of interest was reported by the authors.
References
- Park S-H, Jung W-J, Kim T-H, et al. Can renewable energy replace nuclear power in Korea? An economic valuation analysis. Nucl Eng Technol. 2016;48:559–571.
- Rogner H-H. World outlook for nuclear power. Energy Strategy Rev. 2013;1:291–295.
- PÁZsit I. Recent developments in the Swedish energy situation with an outlook to the new Europe. J Nucl Sci Technol. 1993;30:363 –371.
- Kheifets L, Swanson J, Kandel S, et al. Risk governance for mobile phones, power lines, and other EMF technologies. Risk Anal. 2010;30:1481–1494.
- Renn O, Klinke A, van Asselt M. Coping with complexity, uncertainty and ambiguity in risk governance: a synthesis. Ambio. 2011;40:231–246.
- Van Asselt MB, Renn O. Risk governance. J Risk Res. 2011;14:431–449.
- Visschers VH, Keller C, Siegrist M. Climate change benefits and energy supply benefits as determinants of acceptance of nuclear power stations: investigating an explanatory model. Energy Policy. 2011;39:3621–3629.
- Choi YS, Lee BW. Analysis of policy alternatives on the public acceptance of Nuclear Power plant in Korea. J Nucl Sci Technol. 1995;32:218–225.
- Cohen BL. Problems in public acceptance of nuclear power in U.S. J Nucl Sci Technol. 1996;33:1–6.
- Roh S. Big data analysis of public acceptance of nuclear power in Korea. Nucl Eng Technol. 2017. doi:10.1016/j.net.2016.12.015.
- Sjöberg L. Precautionary attitudes and the acceptance of a local nuclear waste repository. Saf Sci. 2009;47:542–546.
- Stoutenborough JW, Sturgess SG, Vedlitz A. Knowledge, risk, and policy support: public perceptions of nuclear power. Energy Policy. 2013;62:176–184.
- Tanaka Y. Major psychological factors determining public acceptance of the siting of nuclear facilities. J Appl Soc Psychol. 2004;34:1147–1165.
- De Groot JI, Steg L. Morality and nuclear energy: perceptions of risks and benefits, personal norms, and willingness to take action related to nuclear energy. Risk Anal. 2010;30:1363–1373.
- Greenberg M. Energy sources, public policy, and public preferences: analysis of US national and site-specific data. Energy Policy. 2009;37:3242–3249.
- Whitfield SC, Rosa EA, Dan A, et al. The future of nuclear power: value orientations and risk perception. Risk Anal. 2009;29:425–437.
- Vermunt JK, Magidson J. Latent class cluster analysis. In: Hagenaars JA, McCutcheon AL, editors, Applied Latent Class Analysis. Cambridge: Cambridge University Press; 2002;89–106.
- Bartholomew DJ, Knott M, Moustaki I. Latent variable models and factor analysis: A unified approach. Chichester (UK): Wiley; 2011.
- McFadden D. A method of simulated moments for estimation of discrete response models without numerical integration. Econometrica. 1989;57:995–1026.
- Hair JF, Black WC, Babin BJ, et al. Multivariate data analysis. 6th ed. Upper Saddle River (NJ): Pearson Prentice Hall; 2006.
- Lanza ST, Dziak JJ, Huang L, et al. LCA Stata plugin users’ guide (version 1.2). University Park: The Methodology Center, Penn State; 2015.
- Reinecke J. Longitudinal analysis of adolescents’ deviant and delinquent behavior. Methodology. 2006;2:100–112.
- Wagenmakers E-J, Farrell S. AIC model selection using Akaike weights. Psychon Bull Rev. 2004;11:192–196.
- Jasanoff S. The political science of risk perception. Reliab Eng Syst Safe. 1998;59:91–99.