
ABSTRACT
The effect of Pu-rich agglomerates in U-Pu mixed oxide (MOX) on the reactivity analysis of light water reactor MOX core physics experiments was studied with the continuous-energy Monte Carlo calculation code MVP II. First, the following three different models were compared in the analysis of a representative unit cell of a MOX core tested at the KRITZ reactor: a Lattice model where Pu-rich agglomerates were assumed to exist in a fixed pitch, a statistical geometry (STG) model of MVP II, and a Random model where the random distribution of Pu-rich agglomerates was directly modeled. Since the three models gave comparable results, the STG model was used in parametric calculations to systematically understand the reactivity effect depending on the characteristics of Pu-rich agglomerates. In addition, the selected unit cells composing the MOX cores and one representing MOX core tested at the EOLE criticality facility were analyzed with the measured characteristics of Pu-rich agglomerates in MOX fuel. Consequently, the reactivity differences between the calculations assuming the homogeneous Pu distributions and those considering Pu-rich agglomerates were less than 0.0005 Δk/k/k', indicating that the effect of Pu-rich agglomerates was small on the reactivity analysis of the MOX cores tested in the EOLE facility.
1. Introduction
Under the collaboration between Japan and France, a series of mixed oxide (MOX) core physics experimental programs have been implemented at the EOLE facility in the Cadarache Research Center in France [Citation1]. The first two were the MISTRAL program [Citation2,Citation3] conducted from 1996 to 2000 and the BASALA program [Citation4,Citation5] from 2000 to 2002, which were aimed at the investigation of an advanced full-MOX core concept with the feature of high moderation. The former included two homogeneous lattice MOX cores and one MOX core composed of PWR 17 × 17-type mock-up fuel assemblies, and the latter two MOX cores of BWR 9 × 9-type mock-up fuel assemblies. The third was the FUBILA program [Citation6–10] implemented from 2005 to 2006, which was aimed at the investigation of high burn-up full-MOX BWR cores simulating a hot operational condition. The cores consisted of the highly enriched full-MOX BWR 9 × 9- and 10 × 10-type mock-up fuel assemblies. The obtained experimental results have been applied to the validation of state-of-the-art nuclear analysis codes and nuclear data libraries [Citation2–12]. In these experiments, PWR and BWR type mock-up MOX fuel rods were loaded to the tested cores.
The PWR type MOX fuel rods (hereafter referred to as the ‘EPICURE MOX fuel rods’) had originally been prepared for the EPICURE program [Citation13], which had been carried out prior to the MISTRAL program at the EOLE facility, dedicated to recycling 30% MOX fuel assembles in French PWR plants. The fabrication date of the MOX fuel rods implied that they were fabricated in the CFCa (COGEMA/Cadarache) MOX fabrication plant. The BWR type MOX fuel rods (hereafter referred to as the ‘FUBILA MOX fuel rods’) were newly fabricated for the FUBILA program at the MELOX plant located in Marcoule in France.
One of the preceding light-water-moderated MOX core physics experiments is KRITZ-2: 19 [Citation14] which was performed at the KRITZ reactor of Studsvik in Sweden from 1972 to 1973 and included two experiments under two different water temperatures of 21.1 and 235.9 °C. The experiment performed under the temperature of 21.1 °C is referred to as ‘KRITZ-2: 19’ in the following description. The PuO2 content of MOX fuel used in this experiments was 1.5 wt%. The MOX fuel rods were fabricated by vibro-compaction where PuO2 and UO2 powders were blended and compacted within the Zircaloy-2 claddings by the vibration compaction techniques. The average grain size of PuO2 agglomerates in the MOX fuel was reported to be 25 μm. It was also suggested [Citation14] that the use of the MOX fuel with this grain size required self-shielding corrections for accurate calculations on the experiments, and the benchmark specifications of the experiments showed the bias of +0.0050 Δk for KRITZ-2: 19. The bias was defined as the difference between the effective neutron multiplication factor (keff) obtained under the assumption of homogeneity and that under the assumption of heterogeneity in the isotopic compositions in the MOX fuel. The bias was obtained with continuous-energy Monte Carlo calculations for a unit cell consisting of a fuel rod and surrounding water which represented the core. They simulated the heterogeneity in the MOX fuel with the Lattice model assuming the spherical PuO2 agglomerates with the diameter of 25 μm existing in an equal pitch in a UO2 matrix.
In a program of MOX irradiation tests [Citation15–17] supported by the Japanese government, the investigation of characteristics of fabricated MOX fuel rods was implemented for the overseas MOX fabrication plants such as the MELOX plant where MOX fuel was scheduled to be fabricated and loaded into the PWR and BWR plants in Japan. The fabrication process of the MOX fuel rods studied in the program was different from that in KRITZ-2: 19. The powders of UO2 and PuO2 were blended, milled (ball milled), and pelletized. The pellets were sintered, grinded, and loaded into the fuel claddings. The MIMAS (micronized master blend) process is one of this type of fabrication processes and characterized by two-step blending. A master mix (primary blend) of high Pu content MOX powder is mechanically blended with UO2 powder in the secondary blend for the final product. The secondary blend retains Pu-rich agglomerates. The authors [Citation18] have performed the burn-up calculations on the PWR-type MOX fuel rods with heterogeneous Pu distribution with MVP-BURN [Citation19,Citation20] for comparison with those with homogeneous distribution using the investigated results of the MIMAS MOX fuel rods for PWR [Citation17], which were fabricated at the MELOX plant, as representing characteristics of the heterogeneity in the currently used MOX fuel. For modeling the heterogeneity in the burn-up calculations, they adopted the statistical geometry (STG) model [Citation21] installed in MVP II [Citation19] which had been originally developed to treat coated-fuel particles randomly distributed in fuel of high temperature gas-cooled reactors. The STG model allocates designated particles one after another along the neutron flight path at a certain position which is determined in a probabilistic manner. They concluded that the heterogeneity in the MOX fuel fabricated by the current fabrication process for light water reactor (LWR) fuel did not cause significant difference in the reactivity and other pellet average characteristics in burn-up.
The reactor integral test working group in the JENDL committee recently reported on the compilation of the data book on LWR benchmark to develop the new version of JENDL [Citation22]. It contained the review of the LWR MOX critical experiments available in ICSBEP [Citation23] and IRPhEP [Citation14], and also the analysis results of the effect of Pu-rich agglomerates on the reactivity analysis of the reviewed experiments. The results were newly obtained by applying the Lattice model to the experimental core analyses. The report also included the detailed interpretation of the physics mechanism of the reactivity effect of Pu-rich agglomerates.
Accordingly, there are the different results for the effect of Pu-rich agglomerates on the reactivity analysis of the MOX fuel though they were derived from different fuel conditions and obtained with different analysis models of Pu-rich agglomerates. In order to expand the knowledge on this subject, the modeling methods of Pu-rich agglomerates were studied in the first place in this study. Then the parametric survey on the reactivity effect relating to the characteristics of a fuel lattice and the parameters of Pu-rich agglomerates was performed to understand the effect of different fuel conditions. This survey was performed using the specifications of the MOX fuel rods in KRITZ-2: 19 as a basic case. Finally the reactivity analysis on the effect of the heterogeneity in the MOX fuel was performed for the MOX core physics experiments at the EOLE facility. The analysis was conducted with MVP II coupled with the nuclear library based on JENDL-4.0 [Citation24]. Section 2 shows the results on the modeling methods, and Section 3 the parametric study of the reactivity effect. Section 4 describes the effect of Pu-rich agglomerates on the reactivity analysis of the MOX core physics experiments conducted at the EOLE facility, and Section 5 the conclusions.
2. Modeling methods of Pu-rich agglomerates
In addition to the above-mentioned Lattice and STG models, the Random model which locates Pu-rich agglomerates randomly in MOX fuel was applied to the analysis as a reference model. In this model, the spheres of the same diameter representing Pu-rich agglomerates were directly defined in the MOX fuel region using random numbers. The effect of Pu-rich agglomerates on reactivity obtained with the Lattice and STG models was compared with that of the Random model to verify the Lattice and STG models.
One of the calculation cases for the comparison was the above-mentioned unit cell for KRITZ-2: 19. The main specifications of the experiments of KRITZ-2: 19 are shown in and [Citation14]. The compositions of Pu-rich agglomerates (PuO2) and the matrix (UO2) shown in the were calculated in this study based on the weight fraction of PuO2 in MOX fuel given in under the assumption that the weight densities of Pu-rich agglomerates and the matrix were equal.
Table 1. Specifications of KRITZ-2:19 [Citation14]
Table 2. Isotopic compositions of KRITZ-2:19 at the temperature of 21.1 °C (atoms/(barn-cm))
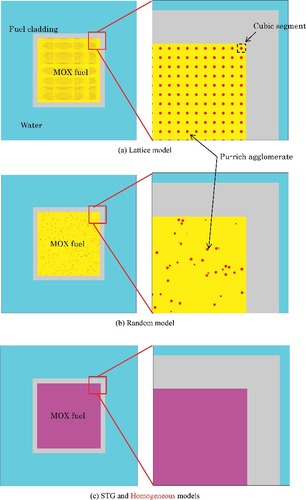
illustrates the horizontal configuration of the unit cell for the (a) Lattice, (b) Random, and (c) STG models. Figure 1(c) also shows the configuration of the model adopting homogeneous atomic compositions (hereafter it is referred to as the ‘Homogeneous model’). In the Lattice model [Citation14], the MOX fuel consisted of cubic shape fuel segments, and each segment had a Pu-rich agglomerate sphere at the center. The volume fraction of the sphere in the segment was 0.015. For a PuO2 sphere with a diameter of 25 μm, the side length of the segment was 81.7 μm. The horizontal shape of the MOX fuel was assumed to be square and the array of the segments in a horizontal plane was determined so that the area of the sum of segment areas was closest to but not beyond the actual area of the MOX fuel. The number of segments for the side of the MOX fuel was 102 and that for the MOX fuel area 10,404. The horizontal shape of the cladding was also assumed to be square. The side length of the square was determined so that the area of the cross section of the cladding was equal to that of the square. The cladded MOX fuel was surrounded by water and the boundary of the unit cell was a square with a side length of 1.80 cm corresponding to the fuel rod pitch. For the STG, Random, and Homogeneous models, the same cell configuration was adopted for the exact comparison with the Lattice model. The vertical length of the geometrical model was selected to be the length of three fuel segments 0.0245 cm so that the defined MOX fuel region contained 31,212 Pu-rich agglomerates. This vertical length was selected for the Random model. In the Random model, each Pu-rich agglomerate was geometrically defined in the MOX fuel region using random numbers, and the computing time and memory increases with the number of Pu-rich agglomerates. For a realistic resource of the computing time and memory, the total number had to be restricted. In the preliminary study on the vertical length, the calculations with the Random model for 3 and 10 fuel segments were performed for the PuO2 diameter of 50 μm with the same calculation conditions as the case of 25 μm except the PuO2 diameter. In this case, the side length of one segment was 163.4 μm. It was confirmed that the infinite multiplication factors agreed to each other within the statistical uncertainties, which implied that the selection of the vertical length was reasonable.
Figure 1. Horizontal configurations of the unit cell for the Lattice, Random, STG, and Homogeneous models (drawing not to scale). The axial plain for the illustration is at the height which corresponds to the center of the Pu-rich spheres in the Lattice model. In the illustration of the Random model, the plain cuts the agglomerates at various cross sections since the Pu-rich spheres randomly locate.
For the STG and Homogeneous models, the same vertical length as the Random model was adopted. In the calculations with the four models, sampling calculations of 2100 batches with 10,000 neutron histories per batch were performed and the initial 100 batches were skipped in the statistical process, which was selected to obtain the statistical uncertainties in infinite neutron multiplication factors (kinf's) less than 10 pcm (1σ) (1 pcm = 0.00001 △k).
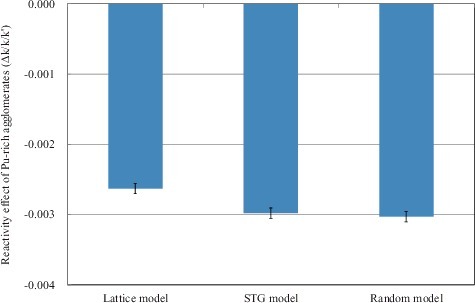
shows the calculated reactivity effects of Pu-rich agglomerates, which are defined by (kinf' − kinf)/kinf/kinf', where kinf and kinf' are the infinite multiplication factors with homogeneous and heterogeneous compositions, respectively (hereafter it is referred to as ‘Δk/k/k'’). The statistical uncertainties (1σ) are also shown in the figure.
Figure 2. Comparison of the calculated reactivity effects of Pu-rich agglomerates by the three models for the unit cell of KRITZ-2: 19.
The value of kinf' of the Random model was obtained for one set of uniquely defined locations of Pu-rich agglomerates in the MOX fuel region. Changing the initial random number for allocating Pu-rich agglomerates, 10 different sets of the locations of Pu-rich agglomerates were prepared, and the 10 values of kinf' were calculated. Using the average value of the 10 kinf's, the effect of Pu-rich agglomerates was obtained, and it agreed to that for the one set of the locations within the statistical uncertainties. This indicated that the influence of the different sets of the locations of Pu-rich agglomerates was not significant to the reactivity effect. The reactivity effects of the Random model are that obtained with one set of locations of Pu-rich agglomerates in this study.
It should be noted that the absolute values of the calculated effects are smaller than that of Ref. [Citation14], since the unit of the reactivity effect is different. The unit of the effect in Ref. [Citation14] was the difference in kinf's (Δk). The figure shows that the reactivity effects calculated with the Lattice and STG models agree within 0.0005 Δk/k/k' with that of the Random model which is regarded as a reference model. The effects of the Lattice model seem to be smaller than those of the Random and STG models for this case. The three models were also applied to the other cases and the results agreed each other within 0.0005 Δk/k/k' as shown in the later section. Even though the Lattice model does not take into account the random locations of Pu-rich agglomerates and the STG model does not explicitly consider the random locations of Pu-rich agglomerates, it was concluded that both the models were applicable to the study on the heterogeneity in MOX fuel used in light water moderation cores. It is noted, however, that the Lattice model has the systematic uncertainty which is caused by the fact that the model adopts only the rectangular shape of MOX fuel instead of the actual cylindrical one, and the volume of the rectangular shape is slightly different from that of the actual one. The validity of adopting the rectangular shape in place of the cylindrical shape for the analysis of the effect of Pu-rich agglomerates is also discussed in the later section.
3. Parametric survey on reactivity effect of Pu-rich agglomerates
In order to systematically understand the reactivity effect of Pu-rich agglomerates, a parameter study was performed based on the specifications of the MOX fuel used in KRITZ-2: 19. The studied parameters were the moderation ratio of the unit cell which was changed with the fuel rod pitch, and the diameter, volume fraction, Pu content, and Pu compositions of Pu-rich agglomerates. The Pu compositions mean the atomic fractions of 238Pu, 239Pu, 240Pu, 241Pu, 242Pu, and 241Am in Pu + Am in the MOX fuel. The Pu compositions of the FUBILA MOX fuel rods [Citation9] were applied for the parameter study. The analysis was mainly performed by the STG model and also partly done by the other models for confirmation. shows the cases of the parameter survey.
Table 3. Parameter study of reactivity effect of Pu-rich agglomerates based on the MOX fuel of KRITZ-2: 19
The geometrical model of the MOX fuel and cladding in the unit cell was a cylindrical shape specified in [Citation14] for the STG model which included the active fuel length. Sampling calculations of 220 batches with 50,000 neutron histories per batch were performed and the initial 20 batches were skipped in the statistical process, which was selected to obtain the statistical uncertainties in kinf's less than 20 pcm (1σ).
3.1. Moderation ratio
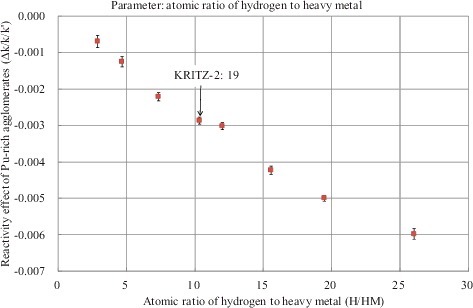
In order to see the trend in the reactivity effect of Pu-rich agglomerates along with the moderation ratio in the unit cell, the fuel rod pitch was changed from 1.80 to 1.25, 1.40, 1.60, 1.90, 2.10, 2.30, and 2.60 cm. As one of indexes to show the moderation ratio, an atomic ratio of hydrogen to plutonium in the unit cell was used. shows the calculated reactivity effect against the atomic ratio of hydrogen to plutonium (H/Pu). The figure also includes the statistical uncertainties (1 σ) in the calculated results and the previous results of the Lattice model reported in [Citation14]. For the comparison with the previous results, the effect was shown in the differences in kinf's (Δk) instead of Δk/k/k' units. The nominal value of H/Pu of KRITZ-2: 19 was about 700 as indicated in the figure. The method of showing the nominal values of KRITZ-2: 19 is same for the following figures. The figure shows that the effect increases with H/Pu and both results are comparable with each other. also shows the results of this study in Δk/k/k' against an atomic ratio of hydrogen to heavy metal (H/HM). The absolute value of the reactivity effect almost linearly increases with the atomic ratio of H/HM. Plutonium-239 has a broad fission-dominant resonance at 0.3 eV. Many of neutrons with energy around 0.3 eV are absorbed at the surfaces of Pu-rich agglomerates and do not penetrate into the internal regions of Pu-rich agglomerates, causing the fission rates in the internal regions to be reduced. This is referred to as self-shielding. The observed trend is mainly caused by decrease in fission reaction rates of 239Pu due to an increase of self-shielding around the resonance of 0.3 eV with softening of a neutron energy spectrum [Citation22].
Figure 3. Effect of Pu-rich agglomerates vs. the atomic ratio of hydrogen to plutonium in the STG model of this study and the Lattice model of Ref. [Citation14].
![Figure 3. Effect of Pu-rich agglomerates vs. the atomic ratio of hydrogen to plutonium in the STG model of this study and the Lattice model of Ref. [Citation14].](/cms/asset/b50da3e5-9d4c-478d-994c-55e315a452ac/tnst_a_1403386_f0003_oc.jpg)
Figure 4. Effect of Pu-rich agglomerates vs. the atomic ratio of hydrogen to heavy metal in the STG model.
3.2. Diameter of Pu-rich agglomerates
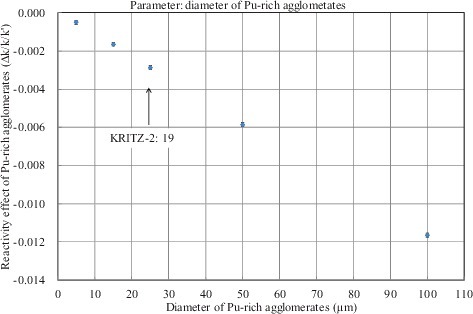
The diameter of Pu-rich agglomerates was changed from 25 to 5, 15, 50, and 100 μm. The numbers of Pu-rich agglomerates were adjusted in the calculations to conserve the volume fraction of Pu-rich agglomerates, and therefore, the average PuO2 content in the MOX fuel. shows the results of this study in Δk/k/k' against the diameter of Pu-rich agglomerates. The reactivity effect almost linearly increases with the diameter of Pu-rich agglomerates. This trend is also mainly caused by decrease in the fission reaction rates of 239Pu due to the increase in self-shielding around the resonance of 0.3 eV for larger sizes of Pu-rich agglomerates.
Figure 5. Effect of Pu-rich agglomerates vs. the diameter of Pu-rich agglomerates in the STG model.
3.3. Volume fraction of Pu-rich agglomerates
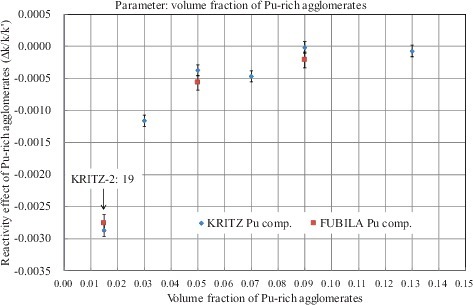
The volume fraction of Pu-rich agglomerates was increased from 0.015 to 0.030, 0.050, 0.070, 0.090, and 0.130 which correspond to the average PuO2 contents in MOX fuel 3.0, 5.0, 7.0, 9.0, and 13.0 wt%, respectively. The results noted by ‘KRITZ Pu comp.’ in show the results with the original Pu compositions of KRITZ-2: 19 in Δk/k/k' against the volume fraction of Pu-rich agglomerates. The results noted by ‘FUBILA Pu comp.’ will be referred to in the later section. The reactivity effect decreases with the volume fraction of Pu-rich agglomerates which corresponds to the average PuO2 content of MOX fuel. The reactivity effect at the volume fraction of 0.07 is slightly deviated from the general trend; however, it would be due to the statistical uncertainty in the calculation. The general trend is mainly caused by the decrease in self-shielding around the resonance of 0.3 eV of 239Pu with hardening of the neutron energy spectrum caused by higher average PuO2 contents of MOX fuel. For the volume fraction larger than 0.05 (average PuO2 content of MOX fuel: 5.0 wt%), the reactivity effect is less than 0.0005 Δk/k/k'.
Figure 6. Effect of Pu-rich agglomerates vs. the volume fraction of Pu-rich agglomerates in the STG model. The results noted by ‘KRITZ Pu comp.’ and ‘FUBILA Pu comp.’ show the results with the Pu compositions (including 241Am) in the MOX fuels for the KRITZ-2: 19 and the FUBILA experiments, respectively.
3.4. PuO2 content of Pu-rich agglomerates
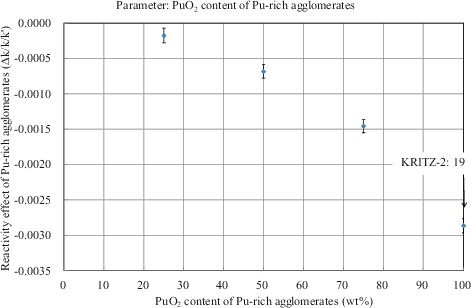
The PuO2 content of Pu-rich agglomerates was decreased from 100 to 75, 50, and 25 wt% and the weight fraction of UO2 in Pu-rich agglomerates was increased from 0 to 25, 50, and 75 wt%, respectively. The PuO2 content of the matrix was, accordingly, increased from 0 to 0.38, 0.76, and 1.14 wt%, respectively, in order to conserve the average PuO2 content of 1.50 wt% in MOX fuel. The results of this study are shown in . The reactivity effect became small with decrease in the PuO2 content of Pu-rich agglomerates. This trend is mainly caused by the decrease in self-shielding around the resonance of 0.3 eV of 239Pu with the reduction of the differences in the PuO2 contents between Pu-rich agglomerates and the matrix. For the PuO2 content of Pu-rich agglomerates less than 50 wt%, the reactivity effect is less than 0.001 Δk/k/k'.
Figure 7. Effect of Pu-rich agglomerates vs. the PuO2 content of Pu-rich agglomerates in the STG model.
The Lattice and Random models were also applied to the parameter study for the PuO2 content of Pu-rich agglomerates. The rectangular geometrical model of the MOX fuel rod mentioned in the previous section was used in the calculations. shows the comparison of the calculated results with the three models. They agree within 0.0005 Δk/k/k' in all analyzed range and within 0.0002 Δk/k/k' for the PuO2 content less than 75 wt%. The results of the Lattice model are generally smaller than those of the Random and STG models. As mentioned before, the Lattice model does not consider the random distribution of Pu-rich agglomerates in MOX fuel. This is likely the main cause of the smaller effect in the analysis with the Lattice model.
Figure 8. Effect of Pu-rich agglomerates vs. the PuO2 content of Pu-rich agglomerates in the Lattice, STG, and Random models. It is noted that the calculations were performed with the rectangular geometrical model of the MOX fuel as mentioned in the text.
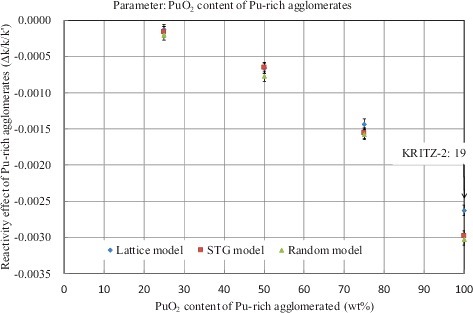
The infinite multiplication factor of the unit fuel cell with the rectangular geometrical model of the MOX fuel rod with the homogeneous MOX fuel composition was 0.004 Δk lower than those of the cylindrical model. The comparison of the reactivity effect between and for the STG model shows, however, that the difference in the reactivity effect for the PuO2 content of 100 wt% in Pu-rich agglomerates was 0.0001 Δk/k/k' for the rectangular and cylindrical models of the MOX fuel rod. It was comparable to the statistical uncertainties in the calculations.
3.5. Pu compositions for Pu-rich agglomerates
The reactivity effect calculated with the Pu compositions of the FUBILA MOX fuel rods were shown in in comparison with the results with those of KRITZ-2: 19 for three different volume fractions of Pu-rich agglomerates. As shown in , the atomic fractions of Pu isotopes with the mass numbers larger than 240 are larger for the FUBILA MOX fuel rods than those for KRITZ-2: 19. A positive reactivity contribution of self-shielding around a neutron capture resonance of 1.0 eV of 240Pu to the reactivity effect was expected for the Pu compositions of the FUBILA MOX fuel rods; however, the differences in the reactivity effect between the calculated results for the FUBILA and KRITZ-2: 19 Pu compositions were small as seen in . It indicates that major contribution to the reactivity effect comes from 239Pu.
4. Reactivity effect of Pu-rich agglomerates on reactivity analysis of cores tested at the EOLE facility
4.1. Analysis conditions of unit cells
The major specifications of the tested cores in the series of MOX core physics experiments MISTRAL, BASALA, and FUBILA are shown in [Citation9,Citation25]. For the FUBILA program, the reference 9 × 9 core was selected since it simulated a hot condition with an in-channel void fraction of zero and the highest moderation condition which makes the reactivity effect larger, if it exists, as shown in . The cores 2 and 3 of MISTRAL were square lattice homogeneous cores. The other cores of MISTRAL, BASALA, and FUBILA were the mock-up cores of LWR-type fuel assemblies. The effective fuel length was 80 cm for all the cores. The specifications of the cores were designed to represent the average H/HMs of the fuel assemblies used in the current commercial LWRs and advanced LWR concepts. The range of H/HM was from 5 to 10. The PuO2 contents of the MOX fuel rods composing the cores were from 3.0 to 11.5 wt%. The core configurations are schematically shown in Figure S1 on MISTRAL, Figure S2 on BASALA, and Figure S3 on FUBILA in the online supplemental material accompanying this manuscript.
Table 4. Outline of MOX experimental cores in the series of MOX core physics experimental programs [Citation9,Citation25]
The conditions of Pu-rich agglomerates were taken from the previous study [Citation18] which was based on the measured data for the heterogeneity on the MIMAS MOX fuel. The volume fractions (%) and average PuO2 contents (wt%) of Pu-rich agglomerates based on the measured data are shown in Figure S4 in the online supplemental material accompanying this manuscript. The heterogeneous characteristics of the EPICURE MOX fuel rods which were fabricated at the CFCa MOX fabrication plant may be different from those of the MIMAS MOX fuel; however, the degree of heterogeneity was assumed to be comparable with that of the MIMAS MOX fuel since the CFCa plant was one of the fabrication plants adopting the modern fuel fabrication technologies [Citation26].
shows the geometrical model of a unit cell which represents the cells composing the tested cores. It consists of MOX fuel and the zircaloy (Zry) fuel cladding, an over-cladding of aluminum alloy, and water. A gap between the MOX fuel and the Zry fuel cladding, and that between the Zry fuel cladding and over-cladding were filled with the materials having smeared densities of the Zry cladding and over-cladding, respectively. The smeared densities were determined so that their total numbers of isotopes of the Zry fuel cladding and over-cladding were conserved between the actual and smeared number densities. The parameters of the unit cells were selected to represent the experimental cores shown in . The axial model included the effective fuel length of the tested cores.
Figure 9. Illustration of a unit MOX fuel cell in reactivity effect analysis of Pu-rich agglomerates in the series of MOX core physics experiments.
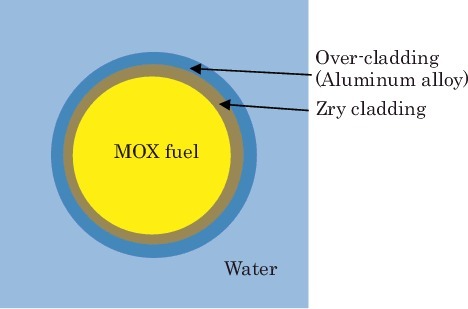
Table 5. Analysis cases of the unit cells representing the MOX cores tested at the EOLE facility
For the MISTRAL program, the average PuO2 content of MOX fuel in the unit cells was selected to be 7.0 wt% which composed the cores 2, 3, and 4. At the peripheral of the core 2 of the MISTRAL program, 16 MOX fuel rods of 8.6 wt% MOX fuel were placed; however, the analysis for this MOX fuel was not adopted since the reactivity effect of Pu-rich agglomerates, if it exists, would be smaller than that for the 7.0 wt% MOX fuel according to the results in the previous parameter study as shown in . The cell pitches were set to be 1.32 cm of the cores 2 and 4, and 1.39 cm of the core 3. In addition, the calculations of a cell pitch of 2.085, which was 1.5 times of 1.39 cm of the core 3, were performed for a parameter study. For the BASALA program, the average PuO2 content of MOX fuel in the unit cells was selected to be 3.0 wt% as the smallest content for which the effect, if it exists, would be larger than those of other higher content MOX fuels. The contents of 7.0 and 8.6 wt% were also selected for a parameter study. The cell pitches were set to be 1.13 cm for the core 1 and 1.35 cm for the core 2 which were those in the mock-up assemblies of the BASALA program. The cell pitches 1.75 cm for the core 1 and 2.05 cm for the core 2 were adopted since the 3.0 and 7.0 wt% MOX fuel rods were placed at the corners of the mock-up assemblies as seen in Figure S2 so that the cell pitches were effectively larger than that for rods inside of the mock-up assemblies. The effective pitches were obtained by averaging the pitches of four sides (top and bottom, and left and right) taking into account the fuel rod pitches in the fuel assemblies and the assembly gaps shown in .
For the test region of the FUBILA program, the average content of MOX fuel in the unit cell was selected to be 3.0 wt% for the same reason as for the BASALA program. The 11.5 wt% of MOX fuel was for a parameter study. The cell pitch of 1.49 cm was the fuel rod pitch in the assembly. The cell pitch of 1.875 cm was the effective pitch of the corner rod, which was obtained by a method similar to the BASALA program. Since Al alloy rods with a diameter of 1.32 cm were inserted in the assembly gaps of the test region as seen in Figure S3, the assembly gap applied for obtaining the effective pitch was reduced by the diameter of the Al alloy rods. The mock-up assemblies in the driver region consisted of 7.0 wt% MOX fuel rods, which were selected for the MOX fuel of the unit cell. The cell pitch of 1.49 cm was the fuel rod pitch in the assembly. The cell pitch of 2.535 cm was the effective pitch of the corner rod, which was obtained in the same manner as in the BASALA program since the Al alloy rods were not inserted in the driver region.
The parameters of Pu-rich agglomerates were taken from the Ref. [Citation18]. The diameter of Pu-rich agglomerates for the base cases was 30 μm and some of the cases adopted 100 μm for a parameter study. shows the PuO2 contents and volume fractions of Pu-rich agglomerates and PuO2 contents of the matrix of the MOX fuel shown in . The volume fractions of the average PuO2 content of 3.0, 8.6, and 11.5 wt% were interpolated or extrapolated from the experimental data of 5, 7, and 11 wt%. For that of 3.0 wt%, extrapolation with a quadratic fitting curve was applied to obtain a larger value of the fraction, making the PuO2 content of the matrix lower and the difference between Pu-rich agglomerates and the matrix larger. The PuO2 contents of the matrix were obtained so that the number densities of nuclides in the MOX fuel were conserved between those in the homogeneous and heterogeneous treatments.
Table 6. Calculation conditions of Pu-rich agglomerates and the matrix of MOX fuel for unit cells
For the calculations taking into account Pu-rich agglomerates, the STG model was adopted. Sampling calculations of 220 batches with 50,000 neutron histories per batch were performed and the initial 20 batches were skipped in the statistical process, which was selected to obtain the statistical uncertainties of infinite neutron multiplication factors (kinf's) less than 20 pcm (1σ).
4.2. Analysis results of unit cells
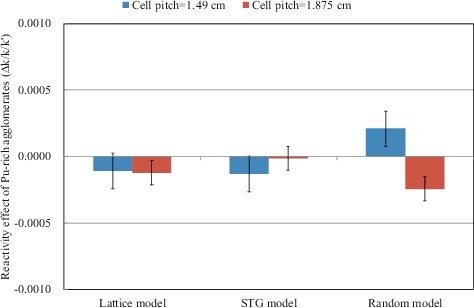
From kinf's for the homogeneous and heterogeneous calculations, the reactivity effect of Pu-rich agglomerates on reactivity Δk/k/k' was obtained. They are shown in for the cases of the MISTRAL and BASALA programs and in for those of the FUBILA program. The effect was less than 0.0005 Δk/k/k' for most cases even when considering the statistical uncertainties (1σ). In order to confirm the results, the three different models were applied to the cases of the cells of the FUBILA program: the average PuO2 content 3.0 wt%, the diameter of Pu-rich agglomerates 100 μm, the cell pitches 1.49 and 1.875 cm. The geometrical model was the square shape for the MOX fuel rod with the over-cladding and was determined in the same way explained in the previous section. The considered number of Pu-rich agglomerates was 4332 for the Lattice and Random models. The comparison between the three models was shown in . The results of the reactivity effect of the STG model agree with those of the Random model considering the statistical uncertainties. The result on the cell pitch 1.49 cm of the Lattice model agrees with that of the Random model; however, the absolute value of the effect on the cell pitch 1.875 cm is slightly smaller than that of the Random model. It is consistent with the observation in and .
Figure 10. Effect of Pu-rich agglomerates for the cases of the MISTRAL and BASALA programs in the STG model.
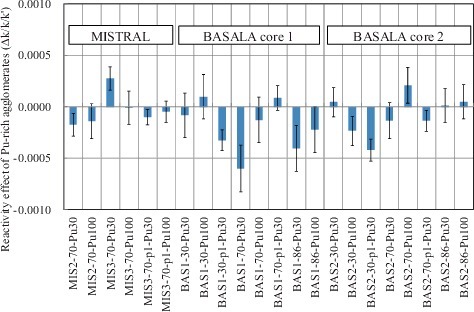
Figure 11. Effect of Pu-rich agglomerates for the cases of the FUBILA program in the STG model.
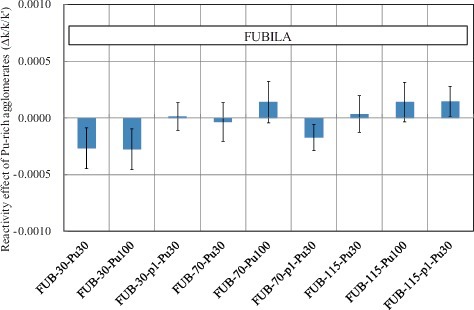
Figure 12. Comparison of the calculated reactivity effects of Pu-rich agglomerates by the three models for the cases of FUB-30-Pu30 (cell pitch = 1.49 cm) and FUB-30-p1-Pu30 (cell pitch = 1.875 cm).
As expected from the results of the parameter study based on KRITZ-2: 19, the conditions of the unit cells such as the lower PuO2 content of Pu-rich agglomerates, larger MOX fuel average PuO2 contents and smaller H/HM reduced the effects of Pu-rich agglomerates to smaller than 0.0005 Δk/k/k'. Consequently, it was concluded that the effect of Pu-rich agglomerates is small on the reactivity analysis of the MOX cores tested at the EOLE facility.
4.3. Analysis conditions and results of BASALA core 2
In order to confirm the results of the unit cell calculations, core calculations were performed on the BASALA core 2 using MVP with a three-dimensional (3D) geometrical condition, and homogeneous and heterogeneous conditions for MOX fuel. This core has the largest H/HM among the cores in the three programs and the largest reactivity effect was expected. The heterogeneous compositions of the MOX fuel were obtained in the same way for the unit cell calculations. The diameter of Pu-rich agglomerates was 30 μm. The STG model was adopted for the heterogeneous calculation. Sampling calculations of 1300 batches with 20,000 neutron histories per batch were performed and the initial 300 batches were skipped in the statistical process. The effective neutron multiplication factors were 1.00505 ± 0.00017 for the homogeneous composition and 1.00497 ± 0.00017 for the heterogeneous composition, and the difference of the heterogeneous composition from the homogeneous composition was as small as −0.00008 ± 0.00023 Δk/k/k'. The result was consistent with those obtained in the unit cell calculations.
5. Conclusions
The three different models considering Pu-rich agglomerates in MOX fuel were studied with MVP II on the unit cell representing the MOX core of KRITZ-2: 19. The reactivity effects of Pu-rich agglomerates calculated with the Lattice and STG models agreed within 0.0005 Δk/k/k' with those by the Random model which was regarded as a reference model. Even though the Lattice model does not take into account the randomness in the locations of Pu-rich agglomerates and the STG model does not explicitly consider the random locations, it was concluded that both the models were applicable to the analysis of the reactivity effects of Pu-rich agglomerates in MOX fuel.
The STG model was applied to the unit cell of KRITZ-2: 19 to systematically understand the variation of the reactivity effect relating to the moderation ratio of the unit cell and the diameter, volume fraction, Pu content, and Pu compositions of Pu-rich agglomerates. The observed systematic trends in the reactivity effect were interpreted as the effect of the parameter changes on the self-shielding of fission reaction rates around the 0.3 eV resonance of 239Pu.
The selected unit cells composing the experimental MOX cores of the MISTRAL, BASALA, and FUBILA programs were analyzed by applying the measured data for the heterogeneity of the MIMAS MOX fuel. As expected from the results of the parameter study, the effects of Pu-rich agglomerates were smaller than 0.0005 Δk/k/k'. This was attributed to the lower PuO2 contents of Pu-rich agglomerates, larger MOX fuel average PuO2 contents, and smaller atomic ratios of H/HM of the unit cells. The 3D geometrical calculation with the STG model for the heterogeneous composition of the MOX fuel was performed for the BASALA core 2, for which the reactivity effect was expected to be the largest among the cores tested in the three programs, and the effective multiplication factor was compared with that for the homogeneous composition. The absolute value of the difference was less than 0.0005 Δk/k/k'. Consequently, it was concluded that the effect of Pu-rich agglomerates is small on the reactivity analysis of the MOX cores tested at the EOLE facility.
Supplemental_data.pdf
Download PDF (214 KB)Disclosure statement
No potential conflict of interest was reported by the authors.
References
- Blaise P, Fougeras P, Cathalau S, et al. 12 years of Franco-Japanese international programs in EOLE for the validation of 100% MOX recycling in LWRs [CD-ROM]. Proceedings of the PHYSOR-2014; 2014 Sep 10–Oct 3; Kyoto, Japan.
- Cathalau, et al. First validation of neutronic lattice parameters of overmoderated 100% MOX fueled PWR cores on the basis of the MISTRAL experiment [CD-ROM]. Proceedings of the PHYSOR ‘98; 1998 Oct 5–8; Long Island (NY).
- Hibi K, Tatumi M, Umano T, et al. Analysis of MISTRAL and EPICURE experiments with SRAC and MVP code systems [CD-ROM]. Proceedings of the PHYSOR 2000; 2000 May 7–11; Pittsburgh (PA).
- Yamamoto T, Iwata Y, Umano T, et al. BWR MOX core physics experiments and preliminary analysis [CD-ROM]. Proceedings of the PHYSOR ‘02; 2002 Oct 7–10; Seoul (South-Korea).
- Cathalau S, Blaise P, Fougeras P, et al. High moderation boiling water fully loaded with MOX fuel: the BASALA experimental program [CD-ROM]. Proceedings of the PHYSOR-2004; 2004 Apr 24–29; Chicago (IL).
- Blaise P, Vaglio-Gaudard C, Vidal JF, et al. Deterministic model of 100% MOX ABWR lattice with increasing void fraction validation of the REL 2004 code package on FUBILA experimental program [CD-ROM]. Proceedings of the ICAPP ‘09; 2009 May 10–14; Tokyo (Japan).
- Yamamoto T, Ando Y, Sakai T, et al. Analysis of reactivity measurements in core physics experiments on full-MOX BWR. J Nucl Sci Technol. 2009;46:599–612.
- Blaise P, Thiollay N, Fougeras P. Monte Carlo modelling of increasing void fraction in 100% MOX ABWR: lessons drawn from the FUBILA program. J Nucl Sci Technol. 2010;47:558–569.
- Yamamoto T, Sakai T, Ando Y, et al. Neutronics analysis of full MOX BWR core simulation experiments FUBILA. J Nucl Sci Technol. 2011;48:398–420.
- Yamamoto T, Sakai T, Ando Y, et al. Neutronics analysis of full MOX BWR core simulation experiments – FUBILA: part 2. J Nucl Sci Technol. 2012;49:103–120.
- Sakai T, Yamamoto T. Neutron cross section sensitivity analysis of UO2 and MOX core physics experiments on light water reactors. J Nucl Sci Technol. 2014;51:240–250.
- Yamamoto T, Sakai T. Feedback on neutron capture cross sections of 238Pu and 241Am from analyses of measured isotopic compositions of irradiated LWR fuels and MOX core physics experiments. J Nucl Sci Technol. 2016;53:1235–1242.
- Mondot J, Gauthier JC, Chaucheprat P, et al. EPICURE: an experimental programme devoted to the validation of the calculational schemes for plutonium recycling in PWRs. Proceedings of the PHYSOR 1990 [CD-ROM]; 1990 Apr 23–27; Marseille (France).
- Briggs JB, editor. International handbook of evaluated reactor physics benchmark experiments. 2015. ( NEA/NSC/DOC(2006) 1).
- Fiscal 1998 report of fuel assembly reliability demonstration tests (mixed oxide fuel irradiation tests). Tokyo (Japan): Nuclear Power Engineering Corporation; 1999. Japanese.
- Fiscal 1999 report of fuel assembly reliability demonstration tests (mixed oxide fuel irradiation tests). Tokyo (Japan): Nuclear Power Engineering Corporation; 2000. Japanese.
- Fiscal 2000 report of fuel assembly reliability demonstration tests (1/3-core mixed oxide fuel irradiation tests). Tokyo (Japan): Nuclear Power Engineering Corporation; 2001. Japanese.
- Kawashima K, Yamamoto T, Namekawa M. Effect of Pu-rich agglomerate in MOX fuel on lattice calculation. J Nucl Sci Technol. 2007;44:1259–1267.
- Nagaya Y, Okumura K, Mori T, et al. MVP/GMVP II: general purpose Monte Carlo codes for neutron and photon transport calculations based on continuous energy and multigroup methods. Tokaimura (Japan): Japan Atomic Energy Research Institute; 2005. ( JAERI-1348).
- Okumura K, Mori T, Nakagawa M, et al. Validation of a continuous-energy Monte Carlo burn-up code MVP-BURN and its application to analysis of post irradiation experiment. J Nucl Sci Technol. 2000;37:128–138.
- Murata I, Mori T, Nakagawa M. Continuous energy Monte Carlo calculations of randomly distributed spherical fuels in high temperature gas cooled reactors based on a statistical geometry model. Nucl Sci Eng. 1996;123:96–109.
- Compilation of the data book on light water reactor benchmark to develop the next version of JENDL – utilization of critical data in ICSBEP and IRPhEP open data bases. Tokaimura (Japan): Japan Atomic Energy Research Institute; 2017. ( JAERI-Data/Code 2017-006). Japanese.
- Briggs JB, editor. International handbook of evaluated criticality safety benchmark experiments. 2013. ( NEA/NSC /DOC(95)03).
- Shibata K, Iwamoto O, Nakagawa T, et al. JENDL-4.0: a new library for nuclear science and engineering. J Nucl Sci Technol. 2011;48:1–30.
- Yamamoto T. Analysis of core physics experiments of high moderation full MOX LWR. Proceedings of the 2005 Symposium on Nuclear Data; 2006 Feb 2–3; Tokai (Japan). ( JAEA-Conf 2006-009 ).
- Bairoit H, Van Vliet J, Chiarelli G, et al. Overview of MOX fuel fabrication achievements. Proceedings of the International Symposium on MOX Fuel Cycle Technologies for Medium and Long-term Deployment; 1999 May 17–21; Vienna (Austria). ( IAEA-SM-358/VII).