
 ?Mathematical formulae have been encoded as MathML and are displayed in this HTML version using MathJax in order to improve their display. Uncheck the box to turn MathJax off. This feature requires Javascript. Click on a formula to zoom.
ABSTRACT
The SIMMER code has been developed to analyze event progression during core disruptive accidents (CDAs) in sodium-cooled fast reactors. One of the key phenomena during CDAs is the discharge of molten fuel from the core region which reduces the reactivity effectively. The discharge flow is inhibited by blockage formation due to freezing of the molten fuel. Then, the blockage formation is enhanced by unmolten fuel which forms solid–liquid mixture flow with the molten fuel. A physical model for blockage formation of solid–liquid mixture flow with freezing in the SIMMER code is improved in this study to dissolve some inconsistencies between the modeling and the physical phenomena involved in the solid–liquid mixture flow with freezing for more precise evaluation of CDA. The improved model is validated with a systematical procedure through a benchmark analysis of an experiment. Consequently, experimental penetration behaviors are simulated reasonably by the SIMMER code analysis with the improved model while excessive blockage formation occurred in the analysis with the original model.
1. Introduction
In the case of postulated core-disruptive accidents (CDAs) in sodium-cooled fast reactors (SFRs), there is a possibility to insert positive reactivity which may cause mechanical energy release against containments since reactor cores are not designed in the most reactive configuration. The reactivity is increased mainly by fuel compaction and discharge of molten steel and control materials, but can be reduced by discharge of molten fuel and diffusion of Boron–Iron eutectic during the transition phase or the early-discharge and material-relocation phases [Citation1,Citation2]. Mechanistic simulation of an accident sequence is required to realistically evaluate the consequence of a CDA involving interaction between the core-materials dynamics and neutronic phenomena. Therefore, the SIMMER code has been developed as a multi-dimensional, multi-velocity-field, multi-phase, multi-component, Eulerian, fluid-dynamics code coupled with a fuel-pin model and a space- and energy-dependent neutron dynamics model [Citation3]. This comprehensive tool for core safety analysis can calculate core-materials motion coupled with above positive and negative reactivity insertions. The discharge of core-materials, especially molten fuel, has been regarded as one of the key phenomena for the SIMMER code development [Citation4] since the discharge of molten fuel reduces the reactivity effectively and usually overcomes the reactivity increase by accompanying molten steel discharge.
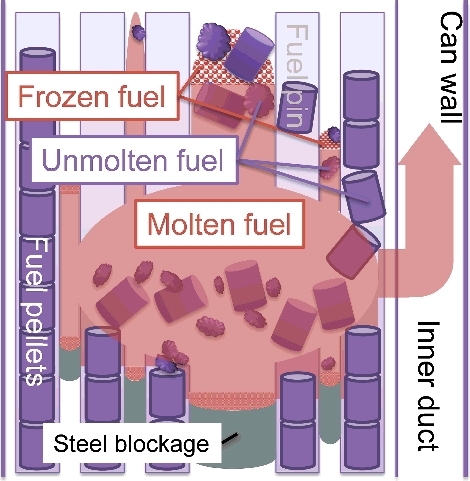
An example of fuel discharge behavior is illustrated in . It is expected that some of the fuel pellets exist in an unmolten solid state especially in the region with relatively low nuclear power density such as axial blanket regions at the beginning of the discharge of molten fuel. Then, the discharge of molten fuel forms solid–liquid mixture flow with the unmolten fuel in an axial blanket. Solid–liquid mixture flow is also formed in another case when the unmolten fuel mixes with molten fuel prior to its discharge through inner ducts of the ‘FAIDUS’ concept [Citation5] in the fuel sub-assemblies or through control rod guide tubes. The discharge of molten fuel in the solid–liquid mixture flow is inhibited by the unmolten fuel since the unmolten fuel acts as a flow resistance and also enhances freezing of molten fuel that results in blockage formation inside the discharge paths. Thus, the blockage formation of solid–liquid mixture flow with freezing is regarded as one of the key phenomena during CDAs.
Figure 1. Schematic view of a core fuel subassembly during CDAs.
Elemental phenomena involved in this blockage formation can be classified into heat transfer, freezing of molten fuel and momentum transfer among molten fuel, unmolten fuel, frozen fuel mixing with the molten fuel and structures. These elemental phenomena can be simulated by physical models of heat, mass, and momentum transfers considering interactions between the binary components of molten fuel, unmolten fuel, frozen fuel, and structures in the SIMMER code. The heat transfer and the resultant freezing are modeled by the heat and mass transfer models [Citation6]. The momentum transfer is modeled by the momentum exchange function model [Citation7]. In addition, the particle viscosity model is employed and coupled with the momentum exchange function model in order to simulate fluidity degradation which increases momentum exchanges due to the frozen and unmolten solid fuel in the solid–liquid mixture flow [Citation4,Citation7].
Up to now, these models have been validated utilizing experimental data with melt of fuel simulant or uranium oxide as shown in . The effect of either unmolten solid or freezing in the SIMMER code has been confirmed separately in the validation for the blockage behavior of melt flow. Without the effect of unmolten solid, the SIMMER analysis reproduced reasonably the blockage-forming behavior of melt flow with freezing by introducing mechanistically established heat and mass transfer models [Citation8]. The effect of unmolten solid on the melt flow was validated in other studies through analyses for dynamic behavior of solid–liquid mixture that simulated the mixture flow of unmolten and molten fuel without freezing [Citation9,Citation10]. The particle viscosity model played a key role in these analyses.
Table 1. Validation status of the key models for blockage formation of the solid–liquid mixture flow with freezing
Both effects of the unmolten solid and the freezing on the solid–liquid mixture flow have also been studied through benchmark analyses of THEFIS experiment [Citation11,Citation12] in a comprehensive SIMMER code assessment program [Citation4] and a subsequent study [Citation13]. Details of the THEFIS experiment are described in the online supplemental information. Alumina melt penetrated into a tube involving a particle deposit having several kinds of height in the THEFIS experiment. The particle deposit simulated unmolten fuel. Then, blockage was formed in the particle deposit due to melt freezing only in the case of relatively large height of the particle deposit.
This behavior of the THEFIS experiment was simulated reasonably by the SIMMER analysis in the comprehensive assessment [Citation4]. Subsequently, a chunk-particle component was newly introduced in the multi-component and multi-velocity models to distinguish unmolten fuel and frozen fuel because of the need in a general core safety analysis while both the unmolten fuel and frozen fuel were modeled as a fuel-particle component originally in the SIMMER code. However, the SIMMER analysis of the THEFIS experiment showed excessive blockage formation of melt flow inside the particle deposit which is represented by the chunk-particle component even when relatively small height of the particle deposit was set in the tube [Citation13]. This might result from the contribution of the chunk-particle component on the particle viscosity model. Since the momentum exchange among the melt, the particle, and the tube wall increases drastically due to freezing during blockage formation, the particle viscosity model is one of the key models in this benchmark analysis.
Therefore, in this study, we improve the particle viscosity model aiming to increase the reliability of the SIMMER code to analyze molten-fuel relocation during CDAs in core safety evaluation of SFRs. Modeling for frozen fuel and unmolten fuel in the particle viscosity model is improved based on the understanding of the physical phenomena involved in the blockage formation of the solid–liquid mixture flow with freezing during CDAs in SFRs. Then, the improved model is validated through benchmark analyses of the THEFIS experiment.
2. Physical model improvement
2.1. Particle viscosity model in the SIMMER code
The particle viscosity model is introduced to take into account the apparent increase in viscosity of a solid–liquid mixture. This model is used in combination with the multi-component and multi-velocity models in the SIMMER code. There are liquid fuel, fuel particle, and fuel chunk-particle (later just ‘chunk’) as the fluid components of fuel in addition to the vapor one in the multi-component model. The three fluid components simulate the molten, frozen, and unmolten fuel, respectively, as shown in . Here, the frozen fuel is put into ‘solid nuclei of fuel’ as for a proper expression based on the freezing phenomenon explained subsequently. The chunk is treated as a particle but distinguished from the particles generated through a freezing process. For instance, the chunk is applied to a different velocity field from the liquid fuel while the fuel particle is the same velocity field with the liquid fuel as a liquid–particle mixture. That is, the chunk can move independently from the liquid fuel while the fuel particle moves in unison with liquid fuel.
Table 2. Fuel components during CDAs and modeled components in the SIMMER code with their simulants in the THEFIS experiment
Interaction among fluid components (q, q') and a structure (s) is simulated by introducing the momentum exchange function K in the momentum equations as follows:
(1)
(1)
(2)
(2) where A is the laminar term, B is the turbulence term, V is the flow velocity, and f is a multiplier of the particle viscosity model. We call the multiplier ‘particle viscosity factor’ in this paper. The laminar term in EquationEquation (1)
(1)
(1) and the entire momentum exchange function of the fluid–structure in EquationEquation (2)
(2)
(2) are multiplied by the particle viscosity factor, respectively.
A basic formulation of the particle viscosity factor is described as the following equation based on the formulation proposed by Russel [Citation14]: (3)
(3) where F is a constant or a function which is not greater than 1.0, k and αMP are model parameters, and
is a particle fraction defined by some different expressions. As plotted in , a drastic increase in the effective viscosity due to particle generation in a liquid–solid flow is given by the model parameter αMP. The value 0.62 is recommended [Citation15] based on comparisons with experimental studies [Citation16].
Figure 2. Change in the particle viscosity factor f against the particle fraction αp for k = 5.0, αMP = 0.62, and F = 0.
Exact formulations of the particle viscosity factor are described for each binary component as (4)
(4)
(5)
(5)
(6)
(6) where subscripts L, P, and P_all denote the liquid component, the particle component, and all the particle components including the chunk component, respectively. αMP2 is a model parameter which can be given different values from αMP.
stands for the three-cells-averaged fraction. As shown in , the particle viscosity factor is applied to the calculation of binary momentum exchange functions between the liquid and the chunk by EquationEquation (4)
(4)
(4) , between the particle and the structure by EquationEquation (5)
(5)
(5) , and between the chunk and the structure by EquationEquation (6)
(6)
(6) . The particle viscosity factor is defined based on the particle fraction in the liquid–particle mixture in EquationEquation (4)
(4)
(4) and the particle fraction in a flow path in EquationEquation (6)
(6)
(6) . EquationEquation (5)
(5)
(5) contains both formulations in order to prevent excessive penetration of a small amount of the particle component in the application of the SIMMER code to the CABRI-EFM1 experiment [Citation13]. Then, αMP2 is recommended to be 0.9 [Citation15].
Table 3. Formulation of the particle viscosity factor for each binary component
When freezing of molten fuel progresses and the fraction of generated particles approaches αMP, the particle viscosity factor becomes extremely large as shown in . Then, the flow of molten fuel is stopped by the multiplied momentum exchange function. Here, we should note that the flow of the liquid components is affected by the particle viscosity factor in the momentum exchange function between the particle component and the structure since the liquid component and the particle component are applied to the same velocity field as a liquid–solid mixture. In this way, the SIMMER analysis can simulate the blockage formation due to freezing of discharging molten fuel.
2.2. Comparison between the physical phenomena and the physical modeling
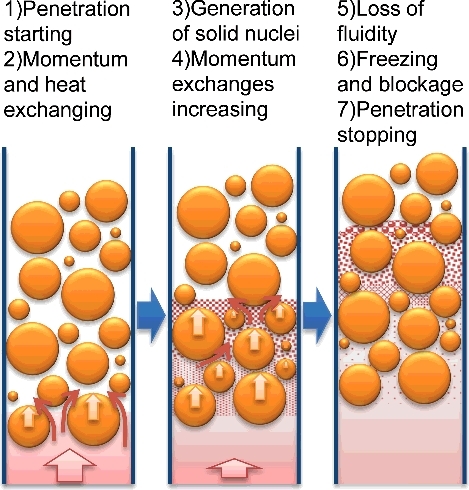
The particle viscosity model is assessed for its improvement through comparison with the physical phenomena involved in blockage formation due to freezing of solid–liquid mixture flow such as discharge flow of molten and unmolten fuel as illustrated in . The molten and unmolten fuels are called just ‘melt’ and ‘solid’, respectively, here. When melt starts to penetrate into a solid region (1), the melt exchanges its heat and momentum with the solid and the structure (2). Solid nuclei of the frozen melt are generated and mixed with the melt (3). Then, fluidity of the melt becomes lower and momentum exchanges increase (4). When the melt loses its enthalpy and the fraction of solid nuclei increases more (5), blockage is formed (6). Finally, penetration of the melt stops (7).
Figure 3. Physical phenomena involved in the freezing and blockage formation during CDAs.
In the SIMMER code, the particle viscosity model is employed to simulate the fluidity degradation due to increase in solid nuclei which are represented by the particle component as mentioned in Section 2.1. However, there are some inconsistencies between the physical phenomena and the modeling, especially in the chunk component which was not implemented in the original particle viscosity model.
First, the chunk, which represents unmolten fuel, is included in the particle volume fraction as in EquationEquations (5)
(5)
(5) and (Equation6
(6)
(6) ) for the calculation of particle viscosity factor. Since the loss of fluidity is caused by the generation of solid nuclei, it is not appropriate to include the chunk in the particle volume fraction to simulate freezing and blockage behavior.
Secondly, it is also inconsistent modeling with the physical phenomena to multiply the particle viscosity factor for the momentum exchange function between the chunk and the structure based on the understanding of the first point. Considering the physical phenomena, the friction resistance of unmolten fuel on a structure surface is independent of its surrounding solid nuclei while the interaction between unmolten fuel and molten fuel should change due to generation of solid nuclei.
Third, the particle viscosity factor of the liquid–particle mixture with the chunk is given by EquationEquation (4)(4)
(4) but this formulation is different from the one with the structure (EquationEquation (5)
(5)
(5) ). From the viewpoint of modeling consistency, the formulation of particle viscosity factor is better given by the same expression.
2.3. Improvement of the particle viscosity model
The problems in the original model of the SIMMER code are summarized as follows:
| (1) | Definition of the particle fraction that includes the chunk unnecessarily, | ||||
| (2) | Extra consideration of the particle viscosity factor between the chunk and the structure, | ||||
| (3) | Inconsistent formulation for the particle viscosity factor of the liquid–particle mixture. | ||||
The definition of the improved particle viscosity factor is consistently given as(7)
(7) The most important improvement is the definition of particle volume fraction αP to exclude the chunk based on the physical process of freezing explained in . Application of particle viscosity factor is unified for binary momentum exchange functions between the liquid and other components in the improved model as shown in . Therefore, the fluidity degradation of the melt flow is affected directly by the generation of solid nuclei due to freezing in the improved model.
Table 4. Improved formulation of the particle viscosity factor for each binary component
As for a minor modification, while the original model shown in EquationEquation (4)(4)
(4) could increase the particle viscosity factor unrealistically in the particular case of small particle fraction with much smaller liquid fraction, the improved model avoids such an unrealistic result by taking into account the gas volume fraction αG in the calculation of particle viscosity factor. This formulation is equivalent to the model in EquationEquation (6)
(6)
(6) based on the particle fraction in a flow path. While the momentum exchange functions for the chunk and particle components are calculated without the particle viscosity factor in the improved model, the particle jamming model can avoid the chunk and particle components from concentrating into a computational cell exceeding their maximum packing fraction [Citation9].
3. Validation of the improved model
3.1. Analytical method
For the reference data to assess the physical models in the SIMMER code, we select a series of THEFIS with particle experiments performed at KfK later reorganized as KIT in the 1980s [Citation11,Citation12]. In the THEFIS experiment, molten alumina penetrated into a quartz tube where alumina particles were accumulated partially as a ‘particle deposit’ to interact with the melt flow as illustrated in . Then, the solid–liquid mixture flow was formed by the alumina particles and melt. The particle deposit was just placed on an aluminum foil at the lower-end of the tube in the experimental Runs #2–#6. The particle deposit could penetrate upward with the melt forming the solid–liquid mixture flow in this case. In the experimental Runs #8 and #9, the particle deposit was fixed by two spacers at the bottom and at the top of the particle deposit. It should be note that the diameter of the quartz tube is close to the scale of the fuel-pin bundle. Applicability of the model for larger systems is confirmed by extra validations although the modeling based on the physical phenomena does not have significant dependency on the scale of a flow channel.
Figure 4. Experimental system and analytical model.
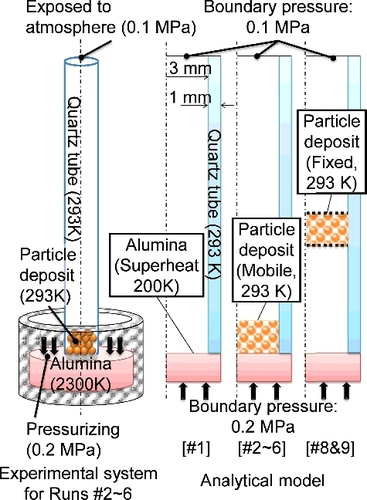
As shown in , the analytical model consists of a quartz tube with a particle deposit and an alumina reservoir. The particle deposit is placed at the lower-end of the tube in the case of Runs #2–#6 and at 0.31 and 0.38 m higher position in the case of Runs #8 and #9, respectively, as summarized in . The analytical system is a one-dimensional geometry in the axial direction with several kinds of computational-mesh sizes as shown in .
Table 5. Position and height of the particle deposit, and computational mesh size for each case
There exist the molten alumina and the particle deposit initially in this system. In addition, solid nuclei are generated in the freezing process of alumina. The molten alumina, the solid nuclei of alumina, and the particle deposit are assigned to the liquid, particle, and chunk components, respectively, as shown in . Since the only solid nuclei contribute to the loss of fluidity as mentioned in Section 2.2 and also since the solid nuclei and the particle deposit have different enthalpy and momentum, they are assigned to different components. The liquid and particle components are applied to the same velocity field since the solid nuclei homogenize with the melt. The chunk component has a different velocity field from the liquid component. The gas component has also an independent velocity field. Therefore, there are four fluid energy components and three fluid velocity components in this analysis.
The initial volume fraction of the chunk component, which represents the particle deposit, is set to 0.45 in accordance with the experimental condition. The maximum volume fraction of the chunk component is limited to the initial fraction by the particle jamming model [Citation9] in order to avoid the particles from concentrating excessively. Particle-fixing by the two spacers in Runs #8 and #9 are simulated by giving an extremely large momentum exchange function between the chunk and structure components. The diameter of the chunk component is set to 1.5 mm uniformly, which is the average value of the equivalent particle diameter used in the experiment, and kept constant. The diameter of the particle component, which represents the solid nuclei of alumina, is set to 0.05 mm based on metallographic observation of freezing uranium oxide [Citation17]. This size is not increased by freezing progression in this analysis to simulate the generation of solid nuclei.
The alumina melt is pressurized at the bottom of the reservoir to penetrate into the tube with 0.1 MPa of pressure difference. The initial temperature is 293 K in the tube wall, the particle deposit, and the gas. The superheat of the alumina melt is 200 K which is the same as the experimental condition but the absolute temperature is 200 K higher than that in the experiment where alumina at 2300 ± 50 K is used [Citation12]. In order to simulate temperature dependency of the physical properties of alumina exactly in the SIMMER analysis, the temperature of the alumina melt is set to 2524 K which is the melting point of pure alumina plus 200 K.
3.2. Steps of the validation analyses
The validation analyses are conducted in two steps. First, the experimental Runs #8 and #9 are analyzed where the particle deposit is fixed. The analysis of this case can validate the particle viscosity model coupled with the momentum exchange function model in a certain condition of the particles because the momentum transfer between the particles and the melt occurs without particle motion as summarized in . Second, the experimental Runs #2–#6 are analyzed where the particle deposit is mobile. Then, the particle motion gets involved in the momentum exchange behavior. The analysis of this case enables comprehensive validation for the physical models related to the blockage formation of the solid–liquid mixture flow with freezing which is a key phenomenon during CDAs.
Figure 5. Relation of the phenomena involved in each run of the THEFIS experiment.
3.3. Analytical result
shows the penetration length obtained by the THEFIS experiment and the SIMMER analysis with the improved or original models for Runs #8 and #9 where the particle deposit is fixed by the two spacers. The penetration length means the position of the melt's leading edge when the flow blockage forms. The placements of the particle deposit are illustrated for each case in this figure with dot-lines. The melt penetrated through the particle deposit in the Run #8 experiment. In the case of Run #9 experiment where the height of the particle deposit is higher, the penetration stopped inside the particle deposit. The analysis with the improved model reproduced these penetration behaviors of experimental Runs #8 and #9 as shown in .
Figure 6. Results of penetration length obtained by the THEFIS experiment [Citation12] and the SIMMER analysis for various computational-mesh sizes for (a) Run #8 and (b) Run #9.
![Figure 6. Results of penetration length obtained by the THEFIS experiment [Citation12] and the SIMMER analysis for various computational-mesh sizes for (a) Run #8 and (b) Run #9.](/cms/asset/bc774378-a60d-42a7-9ce2-de3b536fbe84/tnst_a_1417172_f0006_b.gif)
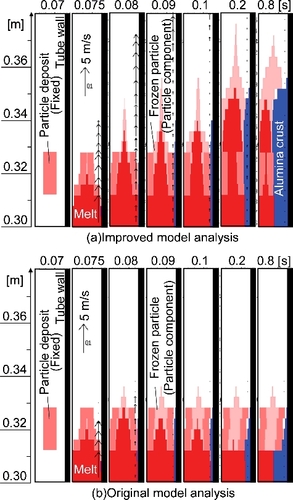
(a) shows the penetration behavior for Run #8 analysis with computational mesh of 4 mm. The melt flow has enough momentum to penetrate through the particle deposit during 0.08–0.1 s despite flow resistance due to the fixed particle deposit and some frozen particles. On the other hand, the analysis with the original model cannot simulate the melt-passing behavior through the particle deposit. The melt flow is decelerated suddenly inside the particle deposit at around 0.08 s as shown by velocity vectors in (b). This is because the chunk component is included in the particle fraction to calculate the particle viscosity factor and the fluidity of the melt flow degraded rapidly by the generation of the particle component due to freezing in the original model.
Figure 7. Axial distribution of materials with the melt velocity vector during melt penetration around the particle deposit for the Run #8 analysis with the computational mesh of 4 mm (the vertical axis shows the distance from the lower-end of the tube).
In (a), overestimation of penetration length can be seen in the analysis for Run #8 with coarse computational mesh of 16 mm. Just one computational cell is assigned for the particle deposit in this case. This means that multiple computational cells are required for a particle deposit such as unmolten fuel in a gap of fuel-pins in . Except for this case, however, the difference of penetration length is less than ±8% between the experiment and the improved model analysis with fine mesh of 10 mm or less in the case of Runs #8 and # 9. This result reveals sufficient validity of the heat and momentum transfer models between chunk and melt with freezing for best-estimate analyses. In case of a totally conservative core safety analysis by eliminating small overestimation in Run #8, model parameter tuning is one of the methods. For example, in the case of Run #8 with αMP = 0.45, the analytical result of penetration length becomes lower than the experimental result 0.34 m.
shows the result of penetration length in the THEFIS experiment and the SIMMER analysis with the improved or original models for Runs #1–#6 where the particle deposit is mobile. The penetration length decreased to almost zero in the experiment with particle deposit height of 40 mm or more while the penetration length for particle deposit of 25 and 30 mm is approximately 1 m which is equivalent level of the non-particle case Run #1. This feature of experimental penetration behavior is reproduced by the SIMMER analysis with the improved model.
Figure 8. Results of penetration length for Runs #1–#6 obtained by the THEFIS experiment [Citation12] and the SIMMER analysis for various computational-mesh sizes.
![Figure 8. Results of penetration length for Runs #1–#6 obtained by the THEFIS experiment [Citation12] and the SIMMER analysis for various computational-mesh sizes.](/cms/asset/129adcb1-3d68-4344-b658-3588dc224eed/tnst_a_1417172_f0008_b.gif)
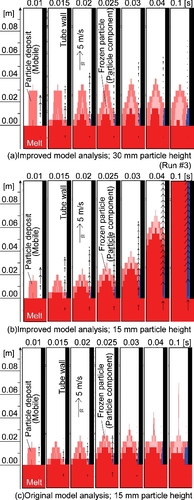
In the case with relatively high particle deposit (Run #3), as shown in (a), the melt penetration is decelerated and stops in the upper-part of the particle deposit, while in the case of half the height of Run #3 in (b), the melt can penetrate with the particle deposit. However, in the analysis with the original model shown in (c), the melt does not penetrate over the particle deposit even in the case with relatively low height. This excessive blockage occurs except for just one case with 5 mm of mesh size and 10 mm of particle-deposit height. The improved model eliminates such an excessive underestimation of penetration length. These results reveal that the SIMMER code with the improved model can analyze the blockage formation of solid–liquid flow with freezing more appropriately than the original SIMMER code can.
Figure 9. Axial distribution of materials with the melt velocity vector at the beginning of melt penetration for particle height of 30 and 15 mm with computational mesh of 5 mm.
4. Conclusions
In this study, a physical model employed in the SIMMER code to describe the blockage formation of the solid–liquid mixture flow with freezing is improved in order to increase reliability of the SIMMER code for core safety analyses of SFRs. We improve the particle viscosity model which dominates blockage formation of the solid–liquid mixture flow with freezing based on consideration of the physical phenomena during CDAs in SFRs. The improvements are listed as follows:
| (1) | The chunk component is excluded from the definition of the particle fraction, | ||||
| (2) | The particle viscosity factor is not applied to the momentum exchange between chunk–structure, | ||||
| (3) | Definition of particle viscosity factor is unified between melt–chunk and between melt–structure. | ||||
Supplementary_Data.docx
Download MS Word (501.4 KB)Acknowledgments
The authors would like to express sincere gratitude to Mr M. Sugaya and Mr S. Hosono of Nuclear Energy System Inc., for their technical contribution on computational analyses.
Disclosure statement
No potential conflict of interest was reported by the authors.
Related Research Data
References
- Suzuki T, Tobita Y, Kawada K, et al. A preliminary evaluation of unprotected loss-of-flow accident for a prototype fast-breeder reactor. Nucl Eng Technol. 2015;47:240–252.
- Suzuki T, Kamiyama K, Yamano H, et al. A scenario of core disruptive accident for Japan sodium-cooled fast reactor to achieve in-vessel retention. J Nucl Sci and Technol. 2014;51:493–513.
- Morita K, Kondo S, Tobita Y, et al. Computational advances in transition phase analysis. In: Proceeding IAEA/IWGFR Technical Committee Meeting on Material-Coolant Interactions and Material Movement and Relocation in Liquid Metal Fast Reactors; 1994 Jun 6–9; O-arai. p. 407–416.
- Kondo S, Yamano H, Tobita Y, et al. Phase 2 code assessment of SIMMER-III, a computer program for LMFR core disruptive accident analysis. Ibaraki: Japan Nuclear Cycle Development Institute (JNC); 2000. (no. JNC TN9400 2000-105).
- Sato I, Tobita Y, Konishi K, et al. Safety strategy of JSFR eliminating severe recriticality events and establishing in-vessel retention in the core disruptive accident. J Nucl Sci and Technol. 2011;48:556–566.
- Morita K, Yamano H, Tobita Y, et al. SIMMER-III/IV heat- and mass-transfer odel – model and method description. Ibaraki: Japan Nuclear Cycle Development Institute (JNC); 2003. (no. JNC TN9400 2003-047).
- Morita K, Liu P, Matsumoto T, et al. Fundamental study on flow characteristics of disrupted core pool at a low energy level (joint research). Ibaraki: Japan Atomic Energy Agency (JAEA); 2009. (no. JAEA-Research-2009-018).
- Kamiyama K, Brear DJ, Tobita Y, et al. Establishment of freezing model for reactor safety analysis. J Nucl Sci and Technol. 2006;43:1206–1217.
- Liu P, Yasunaka S, Matsumoto T, et al. Simulation of the dynamic behavior of the solid particle bed in a liquid pool: sensitivity of the particle jamming and particle viscosity models. J Nucl Sci and Technol. 2006;43:140–149.
- Liu P, Yasunaka S, Matsumoto T, et al. Dynamic behavior of a solid particle bed in a liquid pool: SIMMER-III code verification. Nucl Eng Des. 2007;237:524–535.
- Fieg G, Henkel P, Möschke M, et al. Freezing phenomena of flowing melts in nonmelting and melting tubes. In: Proceeding Conference Science and Technology of Fast Reactor Safety; 1986 May 12–16; Guernsey. Vol. 2, p. 335–338.
- Maschek W, Fieg G, Flad M. Experimental investigations of freezing phenomena of liquid/particle mixtures in the THEFIS facility and their theoretical interpretation. In: Proceeding International Fast Reactor Safety Meeting; 1990 Aug 12–16; Snowbird, UT. Vol. I, p. 519–529.
- Yamano H, Tobita Y. Experimental analyses by SIMMER-III on fuel-pin disruption and low-energy disrupted core motion. J Power and Energy Systems. 2010;4:164–179.
- Russel WB. Effects of interactions between particles and rheology of dispersions. In: Meyer RE, editor. Theory of dispersed multiphase flow. New York (NY): Academic Press; 1983. p. 1–34.
- Yamano H, Fujita S, Tobita Y, et al. SIMMER-III: a computer program for LMFR core disruptive accident analysis, version 3. A model summary and program description. Ibaraki: Japan Nuclear Cycle Development Institute (JNC); 2003. (no. JNC TN9400 2003-071).
- Ishii M, Zuber N. Drag coefficient and relative velocity in bubbly, droplet or particulate flows. AIChE J. 1979;25:843–855.
- Soussan P, Schwarz M, Moxon D, et al. Propagation and freezing of molten material interpretation of experimental results. In: Proceeding International Fast Reactor Safety Meeting; 1990 Aug 12–16; Snowbird, UT. Vol. II, p. 223–232.