
 ?Mathematical formulae have been encoded as MathML and are displayed in this HTML version using MathJax in order to improve their display. Uncheck the box to turn MathJax off. This feature requires Javascript. Click on a formula to zoom.
ABSTRACT
For better nuclear material accountancy, we had developed a non-destructive assay system dedicated to uranium waste drums (JAWAS-N: JAEA Waste Assay System at Ningyo-toge). The system is based on a fast neutron direct interrogation (FNDI) method. To clarify the characteristics of the FNDI method and the performance of JAWAS-N, experimental and computational mock-up tests were carried out using various dry materials that contained known amounts of natural uranium. As a result, linearity between the die-away time (τ2) and the counts of fast neutrons attributed to 235U fission was confirmed. Moreover, the MCNP simulation was performed to discuss the radial and axial dependences of 235U fission probability, neutron detection efficiency, and sensitivity on uranium distributions in the drum. The simulation results agreed with the empirical results reported in a previous paper, providing valuable information on the practice of FNDI-based uranium determination. Furthermore, the nominal detection limits of natural uranium in JAWAS-N were estimated to be 15, 4, and 2 g for τ2 = 0.2, 0.3, and 0.4 msec, respectively. The findings obtained here will contribute to the implementation of the FNDI method to assess the quantities of 235U in actual uranium waste drums.
1. Introduction
Active neutron interrogation using an external source is known as a sensitive approach to detect, identify, and quantify fissile materials [Citation1,Citation2]. It has been applied in a wide range of areas, for example, uranium surveying in mining exploration, inspection of shielded fissile materials hidden in cargo, determination of plutonium in spent nuclear fuel, and assay of fissile material in a waste drum. Neutron irradiation to fissile material induces the nuclear fission reaction, giving rise to prompt and delayed neutrons and prompt and delayed gamma rays. The measurement of these neutrons and/or gamma rays can characterize the nuclear material of interest.
The differential die-away technique is one of the active neutron methods, which is featured with distinguishing prompt fission neutrons from incident and background neutrons [Citation3–5]. Pulsed neutrons are injected to fissile material, and then, the time spectrum of neutron counts is measured to analyze the contribution of the prompt fission neutrons induced by thermal neutrons staying in the material. In general, the thermal neutrons attenuate there exponentially with a mean life depending on the matrices. This means that the thermal-neutron-induced fission rate is also characterized by the same mean life, the so-called die-away time.
Since the conventional die-away technique uses thermal neutrons for the interrogation, neutron absorption by the material itself results in an inhomogeneous thermal-neutron flux, that is, a much lower flux in the inner side of the material. When the amount of nuclear material is quantified, it is necessary to determine accurately the inhomogeneity of fissile isotopes and matrices in a drum for correction purposes. However, it is often very difficult or impossible to obtain information about inhomogeneity. To overcome this problem, a fast neutron direct interrogation (FNDI) method was developed by Japan Atomic Energy Agency (JAEA) [Citation6,Citation7]. According to this method, the material is bombarded with pulsed fast neutrons, which can improve drastically the uniformity of the positional sensitivity. Concerning uranium-bearing metal or cloth wastes, previous numerical studies have demonstrated the advantage of the FNDI method in terms of sensitivity [Citation8,Citation9].
In 2016, an FNDI-based non-destructive assay system dedicated to uranium waste drums was developed in Ningyo-toge Environmental Engineering Center, JAEA, which was named JAWAS-N (JAEA Waste Assay System at Ningyo-toge). This project was initiated with the motivation of better nuclear material accountancy, and the system was designed and constructed at as low cost as possible. The previous paper presented the concept of JAWAS-N and presented some data to discuss its basic functions [Citation10]. For instance, the influences of uranium positions in an iron-containing drum on sensitivity and the linearity between uranium mass and its fission neutron counts were studied for the iron matrix with a bulk density of 0.5 g cm−3. Since 2016, JAWAS-N has been running to assess 235U contents in a variety of actual uranium wastes. These wastes were generated through uranium refining and conversion processes in Ningyo-toge Environmental Engineering Center during the years 1981–1998. Moreover, dismantling of the major equipment used in this refining and conversion facility between 2008 and 2013 led to waste production. The following matrices account for the majority of wastes: sodium fluoride (NaF), calcium fluoride (CaF2), silicon dioxide (SiO2), and iron (Fe) [Citation11,Citation12].
The main aim of the present study was to elucidate the characteristics of JAWAS-N by using dry materials containing known amounts of 235U. Only dry materials were used to simply strengthen the underlying foundation of the FNDI method and JAWAS-N, although some types of actual wastes stored in JAEA are wet. We first discussed the relationship between die-away time and fission neutron counts, and then numerically investigated the influences of uranium positions in a measured material on the response sensitivity that is composed of neutron detection efficiency and 235U fission probability. Various matrices, which had not yet been covered, were examined here to consolidate the conclusion of the sensitivity that was deduced from experimental data only on Fe matrix with a density of 0.5 g cm−3 [Citation10]. Moreover, the detection limits of 235U were evaluated to consider the limitation of JAWAS-N. For this, a unique and practical attempt was made that the detection limits were determined not for specific materials, but for virtual materials characterized by die-away times of 235U fission neutrons. The present study led not only to the exhibition of the performance of JAWAS-N, but also to the expansion of the applicability of the FNDI method to diverse materials.
2. Materials and methods
2.1. Experiment
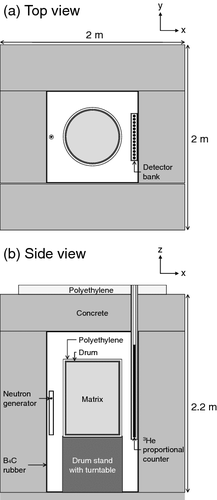
shows a schematic illustration of JAWAS-N. The main components are a neutron generator, neutron detector bank, and reflector/shielding. The present system used concrete as a neutron reflector and outer-shielding material, with 3-mm B4C rubber lining for the absorption of thermal neutrons that may re-enter the drum. The outside of the drum was lined with 2-cm-thick high-density polyethylene, which served as a neutron moderator. Pulsed 14-MeV neutrons, supplied by a generator (MF Physics, A-210) based on the D-T fusion reaction, were injected to a 200-liter drum (approximately 57 cm in diameter and 80 cm in height) for 10 min. During the irradiation, the drum was rotated at a speed of 2.5 rpm. The frequency of the neutron pulses was 100 Hz, and the intensity of neutrons was 106 per pulse, resulting in an incident neutrons of 108 s−1. The neutrons were detected using 3He proportional counters (Eurisys Measures, 150NH100) (2.54 cm in diameter; 100 cm in length; 4 atm in pressure) and multichannel scalers (1 ch = 9 μs in dwell time) synchronized with the pulse generation of neutrons. For the better discrimination of fast and thermal neutrons, a detector bank consisting of 14 3He detectors settled in polyethylene covered with a 2-mm-thick cadmium plate was used.
Figure 1. Schematic illustrations of JAWAS-N. The origin of coordinates is at the center of the drum.
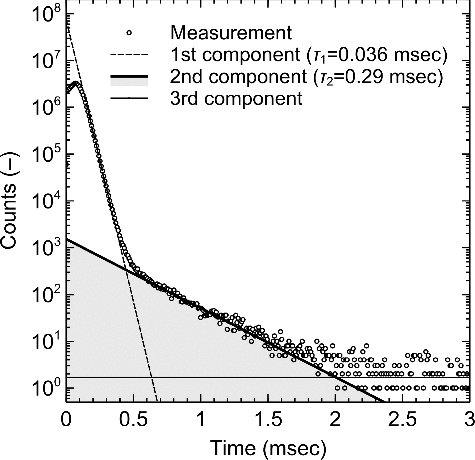
The time spectrum of neutron counts can be obtained, as shown in (NaF with natural uranium of 198 g), by using JAWAS-N in conjunction with the FNDI method. Obviously, the spectrum can be divided into three components. The first component is fast neutrons for interrogation, the second one is fast neutrons produced by thermal-neutron-induced fission of 235U, and the third one is background such as the spontaneous fission of 238U in the drum. According to the literature [Citation13], the approximation of counts, C, can be expressed as a function of time t (ch): (1)
(1)
where Ci
is the count at t = 0, τi
(ch) is the die-away time, and the subscript i stands for the respective components. Here, it should be noted that the total counts, S
2, due to the second component, is proportional to the 235U mass. S
2 can then be given by
(2)
(2)
where tlast (ch) is the last channel of time t.
Figure 2. Typical time spectrum of measured neutrons. In this case, the matrix was NaF with 198 g uranium. The fitting was performed excluding the first 25 plots because of the influence of counting loss. The gray-colored area under the fitted curve of the second component should be proportional to the mass of 235U.
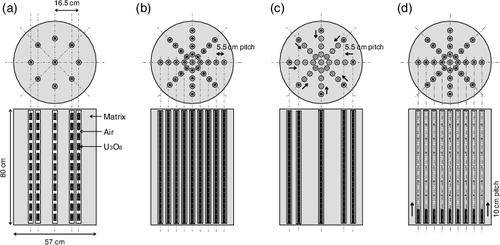
The experiments were carried out to associate S2 with τ2. A 200-liter drum was filled with the following sample: Fe (bulk density 0.25, 0.5, 0.9, and 1.2 g cm−3), NaF (1.0 g cm−3), CaF2 (1.2 g cm−3), or SiO2 (0.4 g cm−3). All mock-ups were dry and homogeneous. A few grams of natural uranium samples (triuranium octoxide, U3O8) packed in small vials were inserted into the matrix, as shown in (a). The uranium samples weighing 198 g in total were positioned at intervals of 45° on a circle of radius r = 16.5 cm.
Figure 3. Setting positions of uranium samples in the experiments and simulations. (a) Experiments and simulations (r = 16.5 cm; Uranium 198 g). (b) Simulations of the time spectrum, fluxes in the material, and uranium fission events (r = 0, 5.5, 11, 16.5, and 22 cm; Uranium 726 g). (c) Simulations of radial dependences of 235U fission probability, detection efficiency and sensitivity (r = 0, 5.5, 11, 16.5, and 22 cm; Uranium 22 g for r = 0 cm or 176 g for the other). (d) Simulations of axial dependences of 235U fission probability, detection efficiency, and sensitivity (z = −35, −25, −15, −5, 5, 15, 25, and 35 cm; Uranium 90.75 g).
2.2. Simulation
The simulations were performed using the MCNP6 code [Citation14]. Both prompt and delayed neutrons were created and tracked, although the latter was clearly insignificant within the range of a few milliseconds. The geometries of JAWAS-N and the drum in the simulation model are shown in and . The neutron time spectrum, which was simulated simply by counting 3He(n,p) events occurring in the 3He detectors (4 atm) in the geometry of (a,b), was analyzed in the same manner as described in Section 2.1. The neutron fluxes (0‒0.5 eV, 0.5 eV‒10 keV, 10‒100 keV, and 100 keV‒20 MeV) and the uranium fission events in the drum were tallied as well. Then, 235U fission probabilities and the detection efficiencies of the 3He proportional counter were computed at various uranium positions ((b,c,d)). The 235U fission probability corresponded to the integrated number of fission events over the entire range of time per incident neutron source. In calculation of the detection efficiency (per generated neutron source in the drum), neutrons with the Watt spectrum (thermal-neutron-induced 235U fission) were emitted only from a given uranium position: in this case, neutron irradiation from the generator and fission events were turned off. All calculations were performed using the history number of 109.
The dimensionless quantity, sensitivity (ϵ), is defined by (3)
(3)
where ϵdet (‒) is the detection efficiency of the 3He proportional counter to fast neutrons, and ϵ
fis (‒) is the 235U fission probability.
3. Results and discussion
shows the relationship between τ2 and S2 (per unit 235U mass per unit measurement time). The linearity between τ2 and S2 can be seen in the measurement result, suggesting that at a given quantity of 235U, C2 is a constant parameter independent of the type of matrices. This idea came from the fact that S2 is the product of C2 and τ2 in EquationEquation (2)(2)
(2) . The values of C2 were actually similar among all matrices, with a standard deviation of about 15% when the 235U input was 198 g. Therefore, it would be reasonable to apply the regression line shown in for the assessment of 235U in unknown fissile materials. By contrast, on another basis, the authors have proposed a power function for the regression in a previous paper [Citation10]. The method of associating S2 with τ2 remains controversial. However, it must be emphasized that both linear and power regressions can work well practically over a τ2 range of at least 0.15–0.45 msec because the discrepancies were not significant (mostly within 5%).
Figure 4. Relationship between die-away time τ2 and 235U fission neutron counts. Note that the counts given by the simulation were adjusted to fit to the regression line of the measured data.
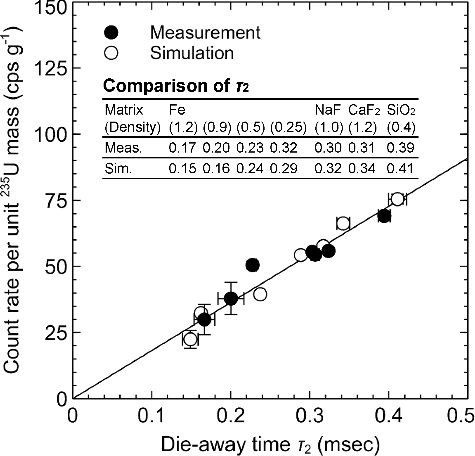
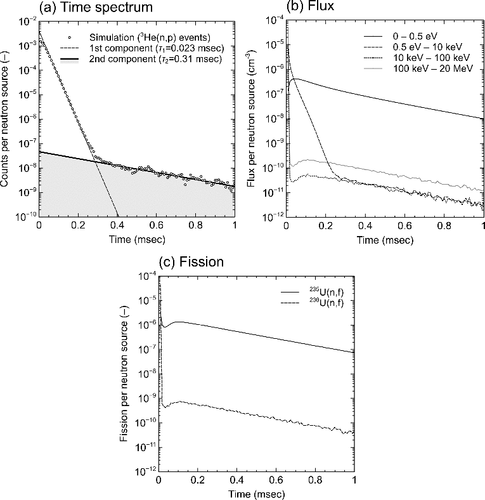
The die-away times τ2 and counts S2 from the simulations were found to agree well with those from the experiments (). The agreement means that the present simulation described well what occurred in JAWAS-N including the drum during the neutron irradiation. This would validate a series of simulation data, exhibited later in the present paper, that the corresponding experimental data were not obtained. Moreover, it was found that while the computational result shown in was obtained using the geometry shown in (a), a similar result was obtained even when using the geometry shown in (b). Thus, a simpler model of uranium input, as in (a), is sufficient for the mock-up experiments. It is known that τ2 reflects the attenuation of the thermal-neutron flux in the material as well as that of the 235U fission events induced by thermal neutrons [Citation3–Citation5]. In fact, shows that all of the neutron counts, flux (0–0.5 eV), and 235U fission events are attenuated with a mean life of 0.31 msec, which is consistent with this knowledge. The fission of 238U was also seen to be insignificant in comparison to that of 235U ((c)), so the second component in the time spectrum can be ascribed solely to 235U fission.
Figure 5. Simulated time spectra of neutron counts, fluxes in the material, and uranium fission events. This simulation was performed using the geometry shown in (b) with the NaF matrix.
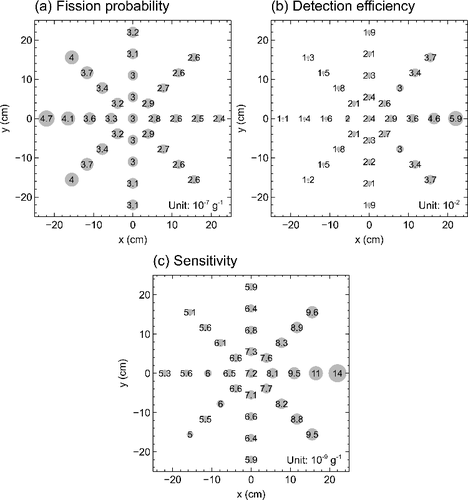
shows the radial dependence of the sensitivity of JAWAS-N, which was computed using the geometry shown in (c). The simulations were performed for the situation that uranium samples were inserted into all available positions on a given concentric circle, almost fully from the bottom to the top of the drum; the radius of the circle was changed at 5.5-cm intervals. Each plot in is the average calculated over eight positions on a certain concentric circle (see ), taking into account the drum rotation. The sensitivity was thus corresponding to the concentric average of individual sensitivities calculated by multiplying the 235U fission probabilities with the detection efficiencies of fission neutrons at all positions shown in . This implies that the product of values indicated in (a,b) is approximate to but not equal to (c). Given that the uranium positions were farther from the drum center, the fission probabilities, detection efficiencies, and sensitivities more or less increased for all matrices. The greater fission probabilities at 22 cm from the drum center ((a)) can be ascribed to much greater probabilities at positions on the neutron-generator side, which can be understood from the example shown in (a). In this case, at y = 0 cm, the fission probability at x = −22 cm was about twice as large as that at x = 22 cm. By contrast, the higher detection efficiencies at 22 cm from the drum center ((b)) were attributed to far higher efficiencies at positions on the 3He-proportional counter side, as shown in (b); at y = 0 cm, the fission probability at x = 22 cm was more than five times higher than that at x = −22 cm. In conclusion, the positions near the 3He proportional counters were more sensitive than those near the neutron generation ((c)). However, it was evident that drum rotation can significantly mitigate the influence of uranium position on the sensitivity ((c)). The ratios of the sensitivities at the distance of 0 cm to those at 22 cm were found to be 1.02 for SiO2, 1.03 for CaF2, 1.04 for NaF, 1.05 for Fe (0.25 g cm−3), 1.10 for Fe (0.5 g cm−3), 1.22 for Fe (0.9 g cm−3), and 1.31 for Fe (1.2 g cm−3). The higher ratios in denser Fe were explained by its greater shielding of neutrons moderated by the polyethylene surrounding the drum.
Figure 6. Simulation results of radial dependences of 235U fission probability, detection efficiency, and sensitivity on uranium positions in drum. The geometry of this simulation is shown in (c). Each plot is the average calculated over eight positions on a certain concentric circle (see ), taking into account the drum rotation.
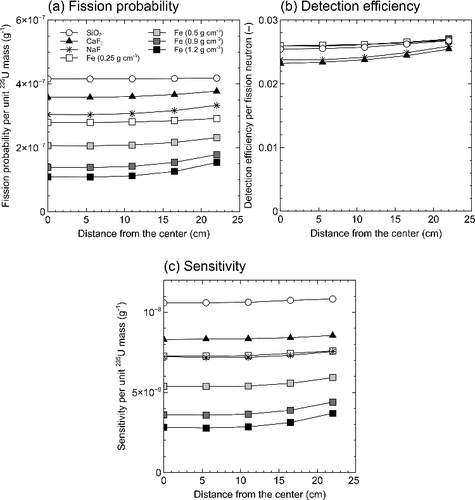
Figure 7. Simulation results of fission probability, detection efficiency, and sensitivity in the NaF matrix in the drum. The geometry of this simulation is shown in (b). Each value was averaged along the z direction.
shows the axial dependence of the sensitivity of JAWAS-N, calculated using the geometry shown in (d). The simulations were performed for the situation that uranium samples with a length of about 10 cm were inserted into all available positions in the drum; the distance from the bottom of the drum to the uranium sample was changed at 10-cm intervals. For all matrices, the detection efficiencies increased at uranium positions closer to the drum center (z = 0 cm) ((b)). The fission probabilities showed somewhat different trends depending on the matrices ((a)), but their curves were flatter than those of the detection efficiencies. As a result, the sensitivities of SiO2, CaF2, and NaF at the drum center were far higher than those at both ends of the drum ((c)), which were similar to the detection-efficiency curves. In contrast, at all densities, Fe was found to be less sensitive to the axial position of uranium. This is because Fe with higher density can better absorb neutrons moderated by the polyethylene at the drum surface (including the top and bottom parts), leading to the trend that the fission probabilities were lower around the drum center than those at both ends.
Figure 8. Simulation results of axial dependences of 235U fission probability, detection efficiency, and sensitivity on uranium positions in the drum. The geometry of this simulation is shown in (d).
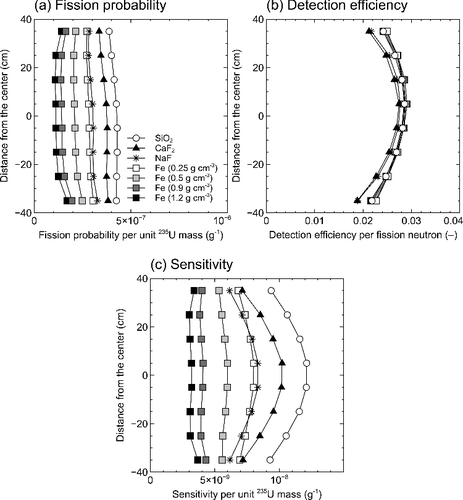
In a previous experiment, no explicit dependences of sensitivity on uranium positions along the radial and the axial directions were observed in the Fe matrix (0.5 g cm−3) [Citation10]. Namely, both sensitivity distributions were almost flat within a variation of about 20%, regardless of the distance from the drum center. The computed data shown in (c) and 8(c) may agree with the earlier experimental results, considering the uncertainties due to counting statistics. Haruyama et al. [Citation8,Citation9] performed the same simulations using metal (c.a. 1 g cm−3) and cloth (0.3 and 0.4 g cm−3) to clarify the radial dependence of the sensitivity, but the system used in that study was not JAWAS-N. Their results, calculated on the assumption that the drum was surrounded by 2-cm-thick high-density polyethylene moderator, also showed an almost flat or concave curvature. However, the cloth sample (0.2 g cm−3) yielded a slightly different result (i.e. convex curvature) and implicated the difference in thermal-neutron fluxes between the lower and the higher bulk densities. This type of sensitivity difference can occur even in JAWAS-N depending on the type of matrices, although the present paper proved that the Fe matrix would lead to no significant difference at least between 0.25 and 1.2 g cm−3.
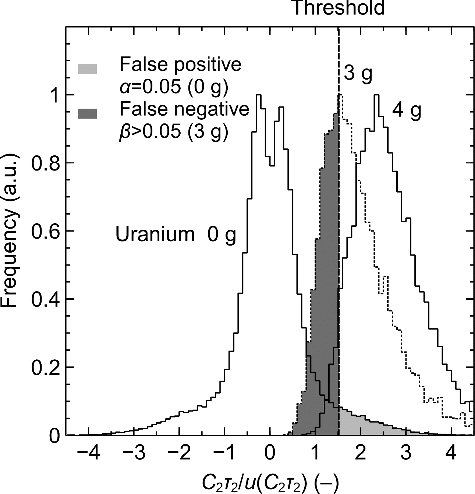
Given that the manifestation of detection limits of 235U may be useful to show the performance characteristic of JAWAS-N based on the FNDI method, we attempted to determine the detection limits with the allowance of both false positive (α) and false negative (β) of 0.05 as the critical value proposed by Currie [Citation15]. For this purpose, the inverse of the relative uncertainty of S2, that is, C2τ2/u(C2τ2), was used as a threshold parameter that represents the significance level [Citation16]; if C2τ2/u(C2τ2) obtained from a measurement exceeds a threshold, C2 and τ2 are considered as significantly detected, and vice versa. To set the threshold value of C2τ2/u(C2τ2), the following procedures based on Monte Carlo simulation were implemented assuming no amount of 235U. The other necessary parameters were selected from the data obtained empirically in the present experiments. First, the time spectra of 105 were produced artificially based on input quantities (only C1, τ1 and C3) considering their uncertainties (u(C1), u(τ1), and u(C3)); they were then randomized by a Poisson distribution. EquationEquation (1)(1)
(1) was then fitted to those spectra to obtain a set of C2 and u(C2); ideally, C2 is zero. shows an example of the distribution of C2τ2/u(C2τ2), indicating a threshold of 1.52. Considering this threshold value and β = 0.05, the above procedures were employed to evaluate the nominal detection limit when τ2 was 0.2, 0.25, 0.3, 0.35, and 0.4 msec. In this case, the parameters C2, u(C2), τ2, and u(τ2) were also incorporated to generate artificial time spectra. It is noted that the detection limits here were assigned not to specific but to virtual materials that were characterized only by τ2, so we here called the nominal detection limit.
Figure 9. Distributions of C2τ2/u(C2τ2) analyzed for neutron time spectra generated using Monte Carlo method. This is an example of the analysis under the assumption of τ2 = 0.30 msec. The detection threshold was set to satisfy α = 0.05. If the distribution had β ≤ 0.05, the amount of uranium was considered to be detected. In the case of this figure, the detection limit was determined to be 4 g.
represents the nominal detection limits of natural uranium in measurements performed using JAWAS-N. The detection limits were found to be less than 15 g for τ2 of 0.2−0.4 msec. The relative uncertainties of uranium data assessed at such detection limit levels were in the range approximately from 40% to 80%; the uncertainty was the standard deviation of a set of uranium estimates from many time spectra generated artificially. The detection limit and the uncertainty of uranium assessment at the detection-limit level would be governed mainly by the difficulty in fitting separation between the first and the second components. The values of detection limits indicated in meet the requirements on JAWAS-N used for nuclear material accountancy. If necessary, of course, the detection limits and uncertainties can be improved by enhancing injected neutron intensity, increasing the number or capability of neutron detectors, or introducing fast-neutron reflector better than concrete used in JAWAS-N [Citation7].
Table 1. Nominal detection limits of natural uranium in measurements using JAWAS-N
4. Conclusions
This paper discussed the characteristics and performance of the operation of JAWAS-N based on the FNDI method. Various dry mock-ups of uranium wastes drums that we possess were examined experimentally and analytically; the matrix of them was NaF, CaF2, SiO2, or Fe. The measured data represented the linear relationship between S2 and τ2 in the range of approximately 0.2–0.4 msec, which was reproduced well by the simulation. The regression line can be used for assessing uranium in actual wastes that are similar to the materials used in the present work. Subsequently, the simulation elaborated the radial and axial dependences of 235U fission probability, neutron detection efficiency, and sensitivity on the uranium distribution in the drum. The simulation data for all materials strongly supported our previous conclusion that the uranium distribution had little impact on the sensitivity when the drum was rotated during the neutron irradiation, which was experimentally drawn only from the Fe matrix (0.5 g cm–3). For virtual materials characterized only by τ2, moreover, the nominal detection limits of natural uranium were also calculated using the Monte Carlo method, and were found to be 15, 4, and 2 g for τ2 of 0.2, 0.3, and 0.4 msec, respectively. The findings obtained here will be useful for the practice of the FNDI method with JAWAS-N.
All matrix samples used in the present study were dry, but uranium wastes may include water to some extent. In future, it should be investigated how hydrogen or other elements with high neutron absorption ability influence uranium assessment by using the FNDI method.
Acknowledgments
The authors wish to thank Mrs N. Fujiki and T. Suwaki (Ningyo-Toge Nuclear Industry) for sharing information from their routine operation of JAWAS-N.
Disclosure statement
No potential conflict of interest was reported by the authors.
References
- Runkle RC, Chichester DL, Thompson SJ. Rattling nucleons: new developments in active interrogation of special nuclear material. Nucl Instr Meth Phys Res A. 2012;663:75–95.
- Whetstone ZD, Kearfott KJ. A review of conventional explosives detection using active neutron interrogation. J Radioanal Nucl Chem. 2014;301:629–639.
- Coop KL. Neutron die away methods for criticality safety measurements of fissile waste. USA: Los Alamos National Laboratory; 1989 ( LA-UR-89-2124).
- Jordan KA, Gozani T, Vujic J. Differential die-away analysis system response modeling and detector design. Nucl Instr Meth Phys Res A. 2008;589:436–444.
- Kashyap Y, Agrawal A, Roy T, et al. Differential die-away analysis for detection of 235U in metallic matrix. Nucl Instr Meth Phys Res A. 2016;806:1–4.
- Haruyama M, Ara K, Takase M. [High-sensitivity detection of fissile materials in a waste drum by direct interrogation of 14 MeV acc neutrons]. Nihon-Genshiryoku-Gakkai Shi (J At Energy Soc Jpn). 2001;43:397–404. Japanese.
- Haruyama M, Takase M, Tobita H. Improvement of detection limit in 14 MeV neutron direct interrogation method by decreasing background. J Nucl Sci Technol. 2008;45:432–440.
- Haruyama M, Takase M, Tobita H, et al. [High-sensitive detection by direct interrogation of 14 MeV acc neutrons, (I) Uranium-contained metal matrix in a waste drum]. Trans At Energy Soc Japan. 2004;3:185–192. Japanese.
- Haruyama M, Tobita H, Takase M, et al. [High-sensitive detection by direct interrogation of 14 MeV acc neutrons, (II) Uranium-contained cloth matrix in a waste drum]. Trans At Energy Soc Japan. 2007;6:65–72. Japanese.
- Ohzu A, Komeda M, Kureta M, et al. [Development of non-destructive assay system using fast neutron interrogation method for actual uranium waste drums]. Trans At Energy Soc Japan. 2016;15:115–127. Japanese.
- Ohashi Y, Nomura M, Tsunashima Y, et al. Technique for recovering uranium from sludge-like uranium-bearing wastes using hydrochloric acid. J Nucl Sci Technol. 2014;51:251–265.
- Ohashi Y, Harada M, Asanuma N, et al. Applicability of polyvinylpolypyrrolidone adsorbent to treatment process of wastes containing uranium. J Radioanal Nucl Chem. 2017;311:491–502.
- Komeda M, Ohzu A, Mori T, et al. Study of the neutron multiplication effect in an active neutron method. J Nucl Sci Technol. 2017;54:1233–1239.
- Goorley T, James M, Booth T, et al. Initial MCNP6 release overview. Nucl Technol. 2012;180:298–315.
- Currie LA. Limits for qualitative detection and quantitative determination. Application to radiochemistry. Anal Chem. 1968;40:586–593.
- Blaauw M. Detection limits should be a thing of the past in gamma-ray spectrometry in general as well as in neutron activation analysis. J Radioanal Nucl Chem. 2016;309:39–43.