
ABSTRACT
During a severe accident in a pressurized water reactor, large quantities of hydrogen can be produced and released into the containment. The hydrogen mixed with air may be ignited. Rapid pressure rise is likely to occur during hydrogen combustion in a semi-confined compartment because the length–diameter ratio of the compartment is relatively large and there generally are some devices and components in the compartment. Obstacle position and number have a significant and complex effect on combustion pressure. In this paper, a numerical analysis of the effects of obstacle position and number on the overpressure of hydrogen combustion in a semi-confined compartment was carried out to identify the arrangement of obstacles that can decrease the pressure loads generated by hydrogen combustion. The overpressure in the compartment with a single obstacle was found first increases to a maximum value and then decreases as the obstacle moving from the closed end to the open end. When there are multiple obstacles existing in the compartment, minimize the obstacle spacing and number is likely to reduce the maximum overpressure of hydrogen combustion. In addition, intentionally adjust the length of obstacle array may help for reducing the maximum overpressure.
1. Introduction
Large quantities of hydrogen can be produced and released into containment during a severe accident in pressurized water reactor. The hydrogen mixed with air generates a flammable mixture, may be ignited when it reaches the flammability limit. The pressure loads generated by the combustion may cause structural damage to the internal devices and components and even to the containment with subsequent consequence of releasing radioactivity into the environment [Citation1]. The most recent example of hydrogen explosion took place at the Fukushima Daiichi reactors in Japan, which caused large release of fission product into the environment [Citation2]. Rapid pressure rise is likely to occur during the process of hydrogen combustion in a semi-confined compartment, such as steam generator compartment, pressurizer compartment, etc., because the length–diameter ratio of the compartment is relatively large and there generally are some devices and components installed in the compartment. The pressure load may cause damage to the devices and components in the compartment and to the compartment walls if it is not controlled within an acceptable limit. Therefore, investigation of the overpressure produced by hydrogen combustion in a semi-confined space with built-in obstacles is of great important for assessing and improving reactor safety.
Many studies have been carried out to investigate the effect of the arrangement of obstacles on the overpressure caused by gas combustion in a semi-confined space. It was pointed out that there is a position where the obstacle placed may cause the highest combustion overpressure, although there is no general agreement with regard to the relationship between the obstacle position and the size of combustion chamber when the highest combustion pressure appears [Citation3–Citation5]. Comparatively, the effect of the spacing and number of obstacles is more complex. In the experiments of methane-air explosion in a vented cylindrical vessel incorporating two obstacles, the overall maximum overpressure first increases and then decreases as the obstacle spacing increases [Citation6]. According to a numerical analysis of influence of laneway support spacing on methane-air explosion shock wave, destructive effects of explosion shock wave are greater for the laneway support system with larger spacing [Citation7]. However, the spacing of obstacles was found do not have much effect on the flame acceleration for the lower blockage ratio obstacles [Citation8]. With respect to obstacle number, when there are three or more obstacles in a vented chamber, the peak overpressure generated by the combustion of liquefied petroleum gas and air increases with increasing obstacle number until it reaches a limit and starts to decrease [Citation9]. Otherwise, the numerical investigation of the influence of obstacle number on acetylene-air explosion in a vented square pipe showed that the maximum pressure increases with increasing of obstacle number [Citation10]. The similar variations trend of maximum pressure in the pipes with different numbers of obstacles was also found in the experimental studies [Citation11,Citation12]. In addition, the vented explosion experiments of stoichiometric propane and air mixtures in a room-size space with volume of 63.7 m3 indicated that the introduction of obstacles does not always increase the maximum pressure [Citation13,Citation14]. The previous studies show the significant and complex effect of arrangement of obstacles on combustion overpressure. However, most of the studies were performed based on limited number of experiments. The situations of very short obstacle spacing or distance between obstacle and closed end of pipe required further investigation.
In this paper, in order to identify the arrangement of obstacles that can decrease the pressure loads generated by hydrogen combustion in a reactor compartment environment, the combined effect of position and number of obstacle on the maximum overpressure of hydrogen combustion in a semi-confined space was analyzed by numerical simulations. The mole fraction of hydrogen, transient overpressure, and flow distribution in process of combustion were obtained for a clearly understanding of the generation of the maximum overpressure.
2. Method validation
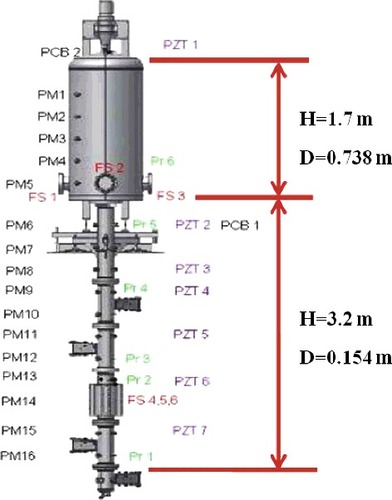
A validation analysis was carried out in order to validate the accuracy and reliability of the numerical simulation method. The experiment RUN-153 carried out on the ENACCEF facility [Citation15] was used as a comparison. An overview of the facility is given in . ENACCEF is a vertical facility of 5-m height. It is divided in two parts, which are the acceleration tube with 3.2 m long and 0.154-m inner diameter and the dome with 1.7-m long and 0.738-m inner diameter. There are nine annular obstacles of blockage ratio 0.63 arranged with 0.154-m spacing in the acceleration tube. The first obstacle is located at 0.638 m from the ignition point. The ignition point is located at 0.138 m from the bottom of the facility. The facility is filled with a mixture of 13% vol. of hydrogen in air. The experiment was performed under the conditions of temperature of 23 °C and pressure of 1 bar. The history of overpressure of the point located at the distance of 2.1 m from the ignition location was measured. A pressure transducer is located at 2.877 m from the ignition point, the data at which would be compared with the computed pressure time evolution.
Figure 1. Overview of the ENACCEF facility.
Two-dimensional and three-dimensional analyses were carried out using computational fluid dynamics software ANSYS Fluent. A two-dimensional axisymmetric model was built for two-dimensional analysis and a quarter of the facility was built for three-dimensional analysis. The two-dimensional simulations were performed using various mesh resolutions, the coarse one with 35,100 quadrilateral meshes, the medium one with 99,400 quadrilateral meshes and the fine one with 219,600 quadrilateral meshes. The three-dimensional geometric model was divided into 541,900 tetrahedron meshes. The standard k–ϵ model was employed to model turbulent flow as in previous studies [Citation16–Citation18]. The finite-rate/eddy-dissipation model with one step chemical reaction for the hydrogen and air mixtures was adopted for the combustion simulation since its good accuracy was found in a validation analysis comparing with experimental data in Ref. [Citation19]. The spark ignition model in the software was used to ignite the hydrogen–air mixtures. The ideal gas law was used to define the density of gas mixtures. The specific heat, thermal conductivity and viscosity of gas species were defined as polynomial function of temperature. The laminar flame speed was calculated using the equation in literature [Citation20]. All of the walls were defined as adiabatic and no slip conditions. At the opening, the pressure outlet boundary condition was applied. The initial pressure and temperature of the premixed gas was set as 0.1 MPa and 25 °C, respectively. The initial values of turbulent kinetic energy and the turbulent dissipate rate are set as 1.5e–04 m2 s−2 and 4.8e–05 m2 s−3, respectively [Citation21].
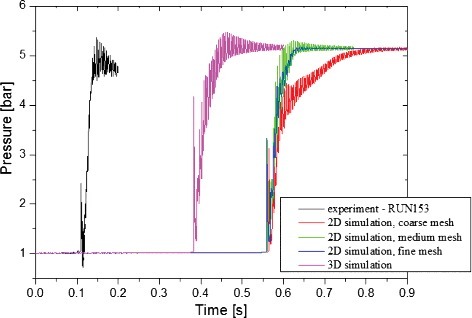
shows the comparison of the simulated and measured maximum overpressures at the monitoring point. The results of medium mesh calculation are more consistent with the experimental results than the one of coarse mesh, especially in the late stage of the combustion process. The simulated pressure remains stable finally and is slightly larger than the measured one, because the walls are assumed as adiabatic in the simulations. The results predicted by medium mesh are well matched with the experimental results. However, the difference of between the results by medium mesh and fine mesh is very small. For the three-dimensional analysis results, it does not seem help to improve the accuracy. Therefore, two-dimensional with the medium mesh resolution is adopted in the following analyses.
Figure 2. Comparison between simulated and measured pressure at the monitoring point.
3. Numerical simulation
3.1. Geometric model
The calculating object is an imaginary and scaled down compartment with length–diameter ratio of 9. Its length and inner diameter are 1.62 m 0.18 m, respectively, as shown in . One end of the compartment is closed and the other end is open. An annular obstacle with 5 mm thickness in the compartment represents the floor or passageway close to the compartment wall. The blockage ratio of the obstacle is assumed as 0.5. The external boundary of the annular obstacle is contact with the compartment wall. Because of geometric symmetry, two-dimensional computational zone was built for each case. The quadrilateral meshes are generated for the whole geometric model. shows the arrangement of obstacles in different cases. In the geometric models with a single obstacle, the distance between the obstacle and the closed end of compartment was changed from 90 to 1620 mm. For the geometric models with multiple obstacles, the obstacles arranged repeatedly like an obstacle array. The spacing (indicated by S) is from 18 to 180 mm, i.e. 0.01 to 1 times of the inner diameter of compartment (indicated by D). The obstacle number is from 2 to 60.
Figure 3. Schematic diagram of calculating object.
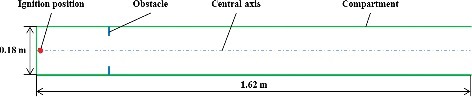
Table 1. Arrangement of obstacles in the different cases
3.2. Initial and boundary conditions
The gas mixture in the compartment is composed by hydrogen (20% vol.) and air (80% vol.). The hydrogen and air was assumed to be mixed uniformly and keep at rest before ignition. The analyses take account of the influences of gravity. The gravity direction is from the opening to the closed end. The initial pressure and temperature of the premixed gas is 0.1 MPa and 25 °C, respectively. The initial values of turbulent kinetic energy and the turbulent dissipate rate are assumed to be 1e-04 m2s−2 and 1e–04 m2s−3, respectively. The laminar flame speed is 1.393 m/s, which is calculated based on the initial conditions. All of the walls of the compartment were set as adiabatic because the combustion time is very short. No slip conditions were imposed on the walls. The pressure outlet boundary condition was applied to the opening. The ignition position is on the central axis and 10 mm away from the closed end of compartment. The initial radius of the spark is 2 mm.
4. Results and discussion
4.1. Single obstacle
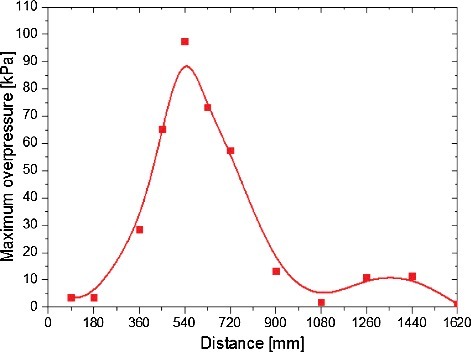
Changing the position of a single obstacle may reduce the overpressure during combustion. From this point of view, a series of simulations were carried out with different obstacle position. It is obviously in that the maximum overpressure first increases to a maximum value and then decreases as the obstacle moving to the open end of the compartment. The maximum value of the peak overpressures is about 97.6 kPa, appears when the obstacle is located at 540 mm away from the closed end of compartment. It is the result of combined effects of the pressure rise due to obstacle and the pressure relief at the opening. When the obstacle distance is 540 mm, the difference between the pressure rise and pressure relief is the largest, hence the maximum overpressure with 540 mm obstacle distance shows the largest. The tendency of the maximum overpressure with the distance between the obstacle and the closed end of compartment is consistent with the previous related studies [Citation2–Citation4].
Figure 4. Maximum combustion overpressure changes with the distance between the obstacle and the closed end of compartment.
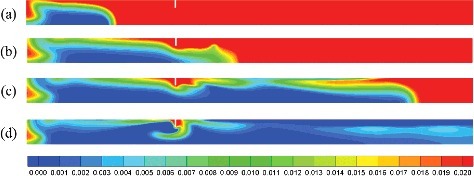
The variation of mole fraction of hydrogen in the compartment with obstacle at 540 mm from the closed end at different times after ignition is shown in . The region where the mole fraction of hydrogen is 0.2 and 0, respectively, means hydrogen is unburned and burn-out. The interface between the high and low mole fraction of hydrogen indicates the location of flame front. The flame proceeds rather slowly first spherically and then it evolves into a finger shape front along the compartment to the opening, as shown in see (a). When the flame encountered the obstacle, the flame front was contorted (see (b)) and then spread rapidly through the gap between the obstacle and the compartment wall. After pass the obstacle, the flames propagate toward the centerline of the compartment in the downstream area of the obstacle. At the same time, the accelerated flame propagated with a much faster speed towards the opening (see (c)), and the residual hydrogen in the regions near the closed end and around the obstacle continue burning (see (d)).
Figure 5. Mole fraction of hydrogen at (a) 0.25 s, (b) 0.325 s, (c) 0.343 s, and (d) 0.3459 s after ignition.
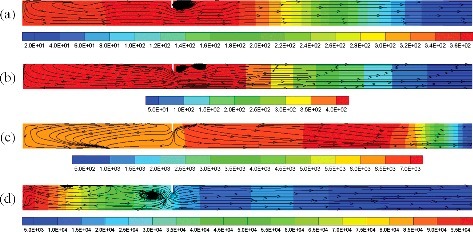
Corresponding to the burn time in , the overpressure distribution and flow field during hydrogen combustion is shown in . As (a) and (b) shows, in the process of hydrogen–air flame pass through the obstacle, turbulence has been generated and the pressure was increased in the obstacle region. After the flame pass through the obstacle, the pressure wave propagates toward the opening of the compartment (see (c)). Due to the pressures at the opening and at the closed end are relatively low, the fluids in the high-pressure zone flow to the two ends of the compartment. In the closed end of the compartment, owing to the backflow of fluids and the combustion of residual hydrogen, the turbulence is enhanced and more heat is generated. As a result, the pressure increases rapidly and then achieves a limit (see (d)).
Figure 6. Overpressure distribution (Pa) and flow flied at (a) 0.25 s, (b) 0.325 s, (c) 0.343 s, and (d) 0.3459 s after ignition.
4.2. Multiple obstacles
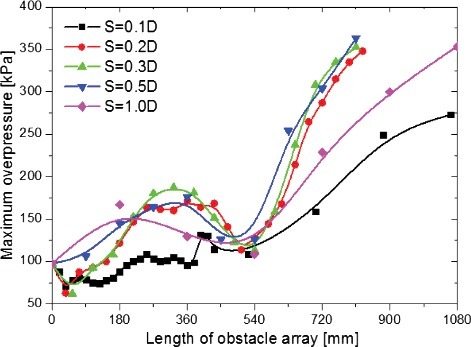
With respect to in the semi-confined compartment internally installed multiple obstacles, the maximum overpressure in the hydrogen combustion process was predicted under different obstacle number and spacing. As shown in , it is obviously that the maximum overpressure is not always increase with the increasing of obstacle number. In general, the maximum overpressure first increases and decreases, then increases with the increasing of obstacle number. The first peak of maximum overpressure in the pressure rise process appears when the length of obstacle array is approximately 270 mm, and the minimum overpressure in the pressure rise process appears when the length of obstacle array is approximately 540 mm. In addition, the maximum overpressure decreases as obstacle number increases when the obstacle quantity is not too much for the spacing of 0.1D–0.3D. The maximum decreasing amplitude can exceed 30% comparing with the overpressure of the compartment only has one obstacle located at 540 mm from the closed end.
Figure 7. Variation of the maximum combustion overpressure in the compartment with the length of obstacle array and obstacle spacing.
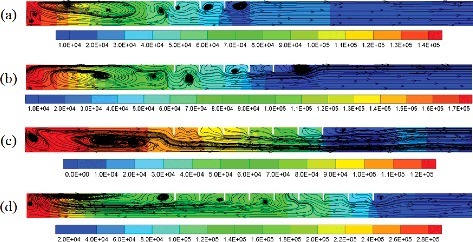
The overpressure distribution and flow flied at the time when the maximum combustion overpressure appears in the compartment with 3, 5, 7 and 9 obstacles are compared in . For the case with three obstacles, see (a), there are some vortices around the obstacles and in the region close to the closed end of compartment. In the region between the last obstacle and the opening of compartment, the gas flows unimpeded towards the opening. As shown in (b), since there are two more obstacles, the quantity of vortices increases, and the maximum overpressure is higher comparing with Figure (a). Some gas in the zone between the first and second obstacle flows to the closed end. When the obstacle number is 7, the vortices number around the obstacles decrease obviously. Almost all of the gas in the region between the first obstacle and the opening flows in one direction. The maximum overpressure is less than the one in (a) and (b). As shown in (d), when the obstacle number is 9, the gas in the compartment seems to be divided into two regions and the zone between the sixth and seventh obstacle is the boundary. The gas in the two regions flows in the opposite direction. The quantity of gas flows to the closed end in (d) is probably more than the one in other three cases. The overpressure in (d) is the highest compare. Therefore, there is a direct relationship between gas flow behaviors and pressure distribution. If more gas can flows to the closed end in the combustion process, the gas in the closed end will be compressed and reflected, as a result, the pressure in the closed end will be larger. When the length of the repeatedly arranged obstacles equal to the distance between the first obstacle and the closed end, it might be help for reducing the gas reverse flow to the closed end.
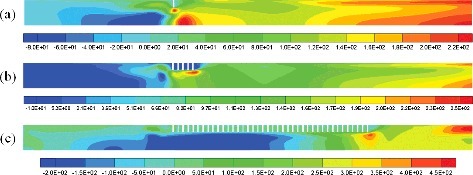
Figure 8. Overpressure distribution (Pa) and flow flied at the time when the maximum combustion overpressure appears in the compartment with (a) 3, (b) 5, (c) 7, and (d) 9 obstacles (S = 0.5D).
gives the overpressure distribution and flow flied at the time when the maximum combustion overpressure appears in the compartment with 1, 5 and 40 obstacles. The obstacle spacing is 0.1D. Obviously, there are much more gas in the compartment with 40 obstacles flows to the closed end than the gas in the compartment with 1 and 5 obstacles. Correspondingly, the peak value of the overpressure in the compartment with 40 obstacles is the largest. However, it is difficult to judge whether more gas flows towards the closed end in the compartment with 5 obstacles than the one with single obstacle. Thus, the axial velocity of gas at the time when the maximum combustion overpressure appears in the compartment with 1, 5 and 40 obstacles are shown in . It can be seen that the gas flows faster in the compartment with a single obstacle than with 5 obstacles. In addition, as predicted, the gas flows to the closed end of the compartment is the most.
Figure 9. Overpressure distribution (Pa) and flow flied at the time when the maximum combustion overpressure appears in the compartment with (a) 1, (b) 5, and (c) 40 obstacles (S = 0.1D).
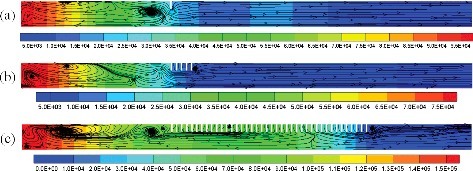
Figure 10. Axial velocity (m/s) of gas at the time when the maximum combustion overpressure appears in the compartment with (a) 1, (b) 5, and (c) 40 obstacles.
5. Conclusions
A series of numerical simulations of hydrogen–air combustion reaction in a semi-confined horizontal compartment with different obstacle position and number were conducted focusing on the overpressure generated in the combustion process. The mole fraction of hydrogen, transient overpressure, and flow distribution were obtained for a clearly understanding of the generation of the maximum overpressure. The maximum overpressure is first increases to a maximum value and then decreases as the obstacle moving to the opening in the compartment with single obstacle. For the compartment with multiple obstacles arranged with the same spacing, the maximum overpressure generally first increases and decreases, then increases with the increasing of obstacle number. When the spacing is very small and the obstacle is not too many, the overpressure may decreases as obstacle number increases. When the length of the repeatedly arranged obstacles equal to the distance between the first obstacle and the closed end, it might be help for reducing combustion pressure. The results indicate the possibilities of decreasing the overpressure of hydrogen combustion in the compartments via optimization of the arrangement of devices and components. Specifically, arranging the obstacle close to the opening or close enough to the closed end should be conducive to decrease the maximum overpressure of hydrogen combustion in a semi-confined compartment. Minimize the obstacle spacing and number is likely to reduce the maximum overpressure of hydrogen combustion. In addition, we can try to intentionally adjust the length of obstacle array to reduce the maximum overpressure. Since the obstacle shape in an actual compartment are very complex and irregular compared to the well-defined conditions, the obstacles with different three-dimensional structures will be considered in the further study.
Acknowledgements
This work was supported by the National Science and Technology Major Project [grant number 2015ZX06004003-003] and China Postdoctoral Science Foundation [grant number 2016M592074].
Disclosure statement
No potential conflict of interest was reported by the authors.
Additional information
Funding
Related Research Data
References
- Şahin S, Sarwar MS. Hydrogen hazard and mitigation analysis in PWR containment. Ann Nucl Energy. 2013;58:132–140.
- Hardie SML., McKinley IG. Fukushima remediation: status and overview of future plans. J Environ Radioactiv. 2014;133:75–85.
- Tang P, Jiang J.C. Numerical simulation for the effect of the obstacle on the inducted venting of gas explosion. J Safety & Environ. 2011;11:151–156.
- Lv X, Zheng L, Zhang Y, et al. Combined effects of obstacle position and equivalence ratio on overpressure of premixed hydrogen–air explosion. Int J Hydrogen Energ. 2016;41:17740–17749.
- Li G, Du Y, Liang J, et al. Characteristics of gasoline-air mixture explosions with different obstacle configurations. J Energy Instit. In press; Available from:https://doi.org/https://doi.org/10.1016/j.joei.2017.01.001.
- Na'Inna AM, Phylaktou HN, Andrews GE. Effects of obstacle separation distance on gas explosions: the influence of obstacle blockage ratio. Procedia Eng. 2014;84:306–319.
- Pang L, Zhang Q, Wang T, et al. Influence of laneway support spacing on methane/air explosion shock wave. Safety Sci. 2012;50:83–89.
- Ciccarelli G, Fowler CJ, Bardon M. Effect of obstacle size and spacing on the initial stage of flame acceleration in a rough tube. Shock Waves. 2005;3:161–166.
- Hall R, Masri AR, Yaroshchy P, et al. Effects of position and frequency of obstacles on turbulent premixed propagating flames. Combust Flame. 2009;156:439–446.
- Yang F, Tao G, Zhang L, et al. Numerical simulation on sinfluence of obstacle on the pressure filed of combustible gas explosion. J Safety Sci Technol. 2013;2:59–63.
- Wen X, Yu M, Ji W, et al. Methane–air explosion characteristics with different obstacle configurations. Int J Mining Sci Technol. 2015;25:213–218.
- Na'Inna AM, Phylaktou HN, Andrews GE. Explosion flame acceleration over obstacles: effects of separation distance for a range of scales. Process Saf Environ. 2017;107:309–316.
- Bauwens CR, Chaffee J, Dorofeev SB. Effect of ignition location, vent size and obstacles on vented explosion overpressures in propane–air mixtures. Combust Sci Technol. 2010;182:1915–1932.
- Chao J, Bauwens CR, Dorofeev SB. An analysis of peak overpressures in vented gaseous explosions. P Combust Inst. 2011;33:2367–2374.
- OECD Nuclear Energy Agency. ISP-49 on Hydrogen Combustion. Report NEA/CSNI/R (2011) 9, January 2012.
- Manninen M, Silde A, Lindholm I, et al. Simulation of hydrogen deflagration and detonation in a BWR reactor building. Nucl Eng Des. 2002;211:27–50.
- Baraldi D, Heitsch M, Wilkening H. CFD simulations of hydrogen combustion in a simplified EPR containment with CFX and REACFLOW. Nucl Eng Des. 2007;237:1668–1678.
- Holler T, Kljenak I, Komen EMJ. Simulation of hydrogen combustion experiment in large-scale experimental facility with ANSYS fluent CFD code. Proc. 24th International Conference Nuclear Energy for New Europe; 2015; Ljubljana (Slovenia).
- Guessab A, Aris A, Bounif A. Simulation of turbulent piloted methane non-premixed flame based on combination of finite-rate/eddy-dissipation model. Mechanika. 2013;6:657–664.
- Sathiah P, Haren SV, Komen E, et al. The role of CFD combustion modeling in hydrogen safety management—II: validation based on homogeneous hydrogen–air experiments. Nucl Eng Des. 2007;252:289–302.
- Xiao J, Travis JR, Kuznetsov M, et al. Numerical investigations of heat losses to confinement structures from hydrogen-air turbulent flames in ENACCEF facility. Int J Hydrogen Energ. 2015;38:13106–13120.