
ABSTRACT
The operation of recently implanted low-leakage seals after Fukushima has altered the analysis of classical PWR Station Blackout (SBO) sequences , as Seal Loss of Coolant Accident (SLOCA) is no longer one of the dominant factors in the accident progression . An analysis of different management strategies in non-SLOCA sequences has been performed by means of the Integrated Safety Assessment (ISA) methodology using the SCAIS-MAAP model of a 3-Loop PWR Westinghouse design. Through the use of the Damage Domain concept(i.e. the region of the uncertain crew actuation times or physical parameters space where each damage limit is exceeded for each sequence), the times for reaching different damage limits are obtained. Results evidence the positive impact of low-leakage seals, which greatly increase the margin to core uncoveryand reduce core damage frequency. Results also allow concluding that an SBO is dominated, namely by the Auxiliary Feed-Water (AFW) mass flow(turning blind AFW management into an essential procedure), SLOCA (in case the new low-leakage seals fail or they are not present), an excessive AFW mass flow (leading to Turbine-Driven Pump failure) and the DC failure time (losing control valves and the instrumentation).
1. Introduction
The Fukushima Dai-ichi nuclear power plant (NPP) accident revealed the necessity of a thorough safety analysis of an accidental scenario in which alternating current (AC) and direct current (DC) are simultaneously lost, and respective recoveries are considered at uncertain times. Likewise, the same accident has led to the implantation of a wide range of improvements in NPPs (filtered containment venting, mobile equipment, passive reactor coolant pump (RCP) seals, etc.) and to the quest for new methodologies in the verification process of severe accident management guidelines (SAMGs).
Therefore, this accident urged the nuclear industry for the implementation of learned lessons to enhance safety features. Among these needs, the implementation of passive thermal shutdown seals in current pressurized water reactor (PWR) designs has been one of the most extended for the current PWR fleet. As a consequence, this action has revealed the need for reassessing the classical PWR station blackout (SBO) sequences evolution, as seal loss of coolant accident (SLOCA) is no longer the dominant and challenging effect in the evolution of SBO sequences.
The standard RCP seal system of a PWR Westinghouse (hydrostatic seal system) consists of three sealing stages. Although they differ from each other, all of them have a running ring linked to the pump shaft, and a non-rotating ring linked to the pump shell. One of these rings, usually the non-rotating one, has the capability to move in the axial direction to provide adequate performance of the seal and accommodate thermo-mechanical expansion of the pump components. Secondary sealing is needed to avoid coolant leakage though the housing of the non-rotating ring. This is achieved by an o-ring made of an adequate elastomeric material. Seal failures resulting from loss of seal cooling may affect either the primary ring (ring-to-ring) seal or the secondary one (o-ring).
New models for RCP seals are found with two main designs (see ): hydrodynamic seal technology (which replaces the previous seals altogether) versus passive thermal shutdown seals, which consist on the addition of a fourth stage to the already existing seal. Spanish NPPs have followed these recommendations and have introduced new RCP seal concepts to their designs: Almaraz NPP, Ascó NPP and Vandellós II NPP have decided on passive thermal shutdown seals [Citation1], while Trillo NPP has chosen hydrodynamic shaft seal technology for its safety improvement [Citation2].
Table 1. RCP sealing systems
Advanced nuclear reactors incorporate their own features to cope with the possibility of SLOCA. AP1000 [Citation3], on the one hand, prevents loss of inventory with the implantation of canned RCPs (hermetically sealed, with no mechanical seals, hence leakage free). On the other hand, both EPR and APR1400 have their own advanced seal system design. EPR RCPs have three water lubricated seals plus a fourth standstill seal [Citation4], provided to ensure RCP shaft sealing conditions during SBO. As a final example for advanced designs, APR1400 has hydrodynamic seals KSB Type F [Citation5] with three independent stages that keep seal leakage down for an extended period of time.
This paper presents the analysis of sequences with RCP Passive Thermal Shutdown Seals, hence without SLOCA, of a commercial 3-Loop PWR Westinghouse designed. The study has been performed by means of the integrated safety assessment (ISA) methodology [Citation16] with its computerized platform SCAIS (Simulation Code System for ISA) [Citation17,Citation18] coupled to MAAP thermal-hydraulic code [Citation19]. It is complementary of a previous one, with the objective of verifying the adequacy of emergency operating procedures (EOPs) and SAMGs in an SBO sequence with SLOCA [Citation14]. The purpose of this present work is then to analyze the progression of SBO accidents after the installation of these new seal concepts, which take SLOCA out of the sequence.
Specific goals of this work are: to analyze SBO without SLOCA sequence evolution; to assess the impact of several factors like new thermal seals, auxiliary feed-water (AFW) mass flow, DC failure time or AC recovery time; to verify the adequacy of EOPs and SAMGs related to this scenario and to appraise the time evolution of the different damages that come up during the sequence.
This article is divided into the following sections: in Section 2, a base case for SBO sequences without SLOCA is characterized. In Section 3, ISA methodology is applied to SBO sequences taking into account several discrete damage indicators or DDIs (those damage indicators with Boolean logical values, such as Core Uncovery (CU), embrittlement cladding conditions (peak cladding temperature (PCT) > 1477 K), inadequate core cooling conditions (ICC, Core Exit Temperature (CET) > 922 K), partial core melting (2499 K), fuel relocation in lower plenum (FR) and vessel failure (VF)), in order to obtain damage domains (DDs) as a function of the uncertain times of AC power recovery and DC power failure and a comparison of final states with different severe accident management (SAM) actions; a study of the existing difference between sequences with and without SLOCA is also conducted. Section 4 summarizes the main conclusions of the study.
2. SBO sequences without SLOCA. Base case
This section describes the base case to illustrate the main characteristics of SBO sequences without SLOCA. Human actions triggered from EOPs E-0 (Reactor SCRAM and/or Safety Injection System) and ECA-0.0 (Loss of all AC Power), as well as from SAMGs SAG-1, SAG-2 and SAG-3 have been considered in the management of the scenario (see and ).
Figure 1. EOPs involved in SBO sequences without SLOCA.
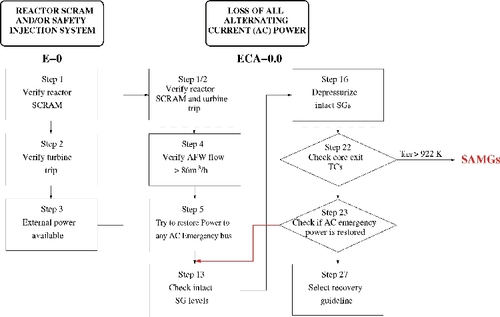
Table 2. List of TSC SAGs (from [NSA-11])
The DC power is lost at 9000 s after SBO and AC power is recovered at 81,000 s, in the base case. Additional boundary conditions and human actions that have been considered while AC power is not available are:
High pressure safety injection (HPSI), low pressure safety injection (LPSI), and spray containment are unavailable, as they depend on AC power.
The steam generator (SG) level is controlled manually with the turbine driven pump (TDP) while DC is available (EOP ECA-0.0, step 13).
Once DC is lost at 9000 s, the SG power operated relief valves (PORVs) remain stuck-closed and the total AFW mass flow keeps constant (≈24 kg/s, minimum AFW mass flow required by EOPs for the reference plant), because TDP admission valve remains at a stuck-fixed position, [Citation6]. If the SG is overfilled then the TDP fails due to liquid inventory entrainment in the turbine blades and then causes pump trip on overspeed [Citation20].
According to EOP ECA-0.0 step 16, reactor coolant system (RCS) cool-down at a rate of 55 K/h is established at a fixed point in time of 600 s (10 min) from the AC power loss (base case hypothesis).
AC recovery at 81,000 s implies the possibility of the following additional boundary conditions and human actions:
LPSI and HPSI systems, manual control on SG-PORVs and containment spray (SAG-3) become available.
If Refueling Water Storage Tank (RWST) level is lower than 21%, sump recirculation is enabled (ES-1.3, SAG-3).
Second RCS cool-down at fast cooling rate (SAG-2).
SG manual control level with AFW motor driven pump (MDP) (EOP E-0, SAG-1).
These assumptions are in line with previous analyses such as ‘State-of-the-Art Reactor Consequence Analyses (SOARCA) Project’, [Citation6], as well as with SAM training material, [Citation21]. Similar hypothesis were also taken into account in the previous study about SBO with SLOCA [Citation14].
Main variables (primary and secondary pressures, PCT, RCS level, SG level and local fuel melting) as well as main actions and phenomena are illustrated in – and ( includes MAAP events, referenced by their corresponding event numbers in the code). RCS level decreasing starts at 74,052 s (); and core temperature excursion begins at 75,556 s, 300 s after core uncovery (). PCT reaches embrittlement conditions and partial core melting occurs afterwards. A sudden RCS pressure drop at 88,836 s is the indication of reactor pressure vessel (RPV) failure ().
Figure 2. Primary and secondary pressures (SBO base case sequence without SLOCA).
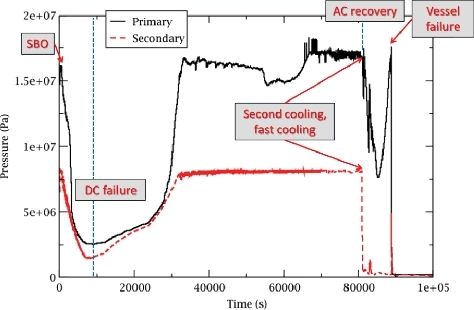
Figure 3. Core and cladding temperatures (SBO base case sequence without SLOCA).
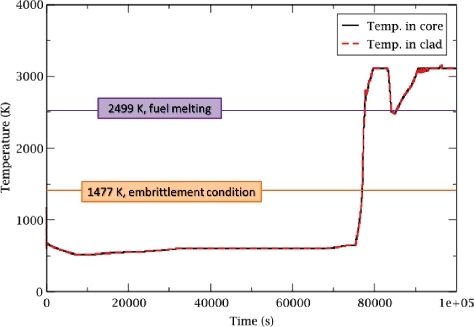
Figure 4. Collapsed level in RCS, excluding PZR (SBO base case sequence without SLOCA).
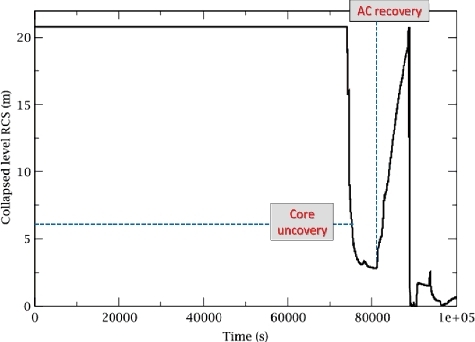
Figure 5. Steam generator level (SBO base case sequence without SLOCA).
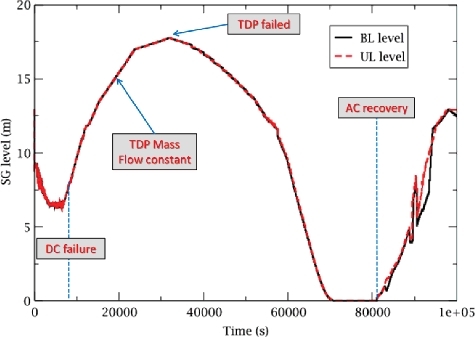
Table 3. Main events of SBO base case sequence (without SLOCA)
3. Analysis of SBO sequences including time-dependent uncertainties
This section covers the application of ISA method to depict a suitable set of DDIs useful to the analysis of the scenario. It entails the selection of DDIs and the obtainment of the so-called previous damage (PD) lines (Section 3.1), the DD seeking (Section 3.2), and a comparison of eventual end states considering different SAM strategies (Section 3.3). Finally, the effect of SLOCA on the sequence is performed in Section 3.4, comparing the results with respect to an equivalent base case without SLOCA.
3.1. Discrete damage indicators and previous damage lines
Most of the elements required in this application are the same than the ones used in the previous SBO with SLOCA study [Citation14]:
Only two uncertain human action times (DC power failure and AC/DC power recovery) have been considered in this analysis (i.e. the DDs identified in the sequel are up to two-dimensional).
DDIs considered: CU; start of H2 generation; ICC conditions; fuel cladding embrittlement criterion; partial fuel melting; beginning of FR; CU; and beginning of (H2) burning inside containment compartments.
Only the failure of AFW TDP is an additional DDI necessary in the study as the TDP mass flow contribution is the dominant phenomenon when no SLOCA exists in the sequence.
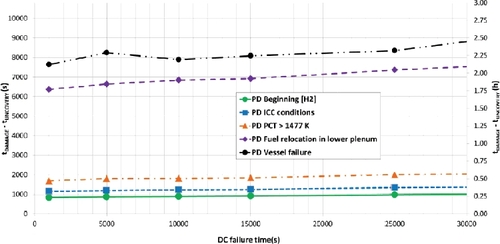
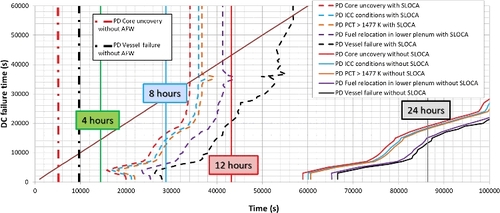
Running several simulations (near 30) with different times for DC power loss and with no AC power recovery allows to obtain the so-called PD line in the plane (DC failure time vs. damage occurrence) for each DDI (PD lines in ). A single case, DC power loss at 15,000 s, is marked by squares in the diagram.
Figure 6. Previous damage lines (CU, ICC conditions, PCT, local melting, FR and VF).
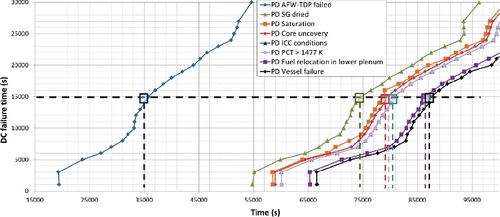
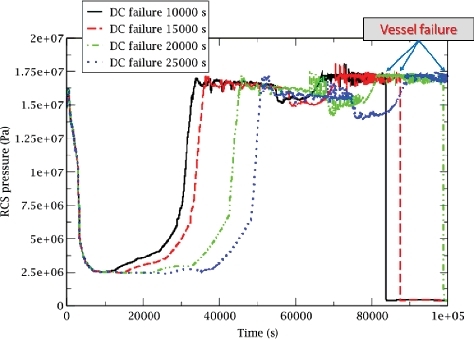
and collect the evolution of some relevant variables for different DC failure times. provides information for cladding embrittlement criterion and local melting, while the VF related to the RCS pressure evolutions are depicted in . Corresponding values of time for each different DDI are then transferred into the PD diagram, .
Figure 7. Core temperature for several PD sequences (without AC recovery).
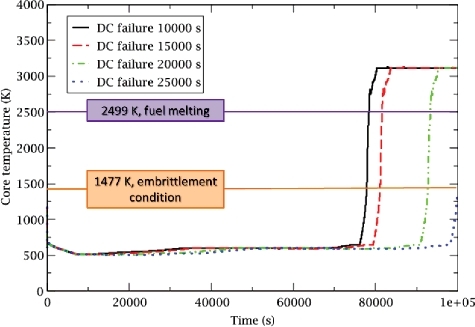
Figure 8. RCS pressure for several PD sequences (without AC recovery).
This PD diagram in allows describing which damage conditions are reached as a function of time, supposing there is no AC recovery and no human actions are performed after DC power loss. In other words, PD plots represent the damage state at the moment of AC power recovery, i.e. the extent of unavoidable damage previous to any subsequent accident management (AM) action taken by the operating crew, aiming at avoiding the stepping up of the damage level from this PD. It is important to point out that the TDP failure can be recovered after its failure. Actions to recover the pump could include draining the water, resetting valves, and restarting it [Citation22]. Several hours are needed for this TDP repair; however, PD diagram results show that there is a wide margin from AFW TDP failure to SG dryout (10–11 h) in order to recover the TDP.
collects the progression of different sequences (SBO without SLOCA), represented as the distance in time of the different DDI to the CU as a function of DC failure time, allowing comparison of these times with available generic values ([Citation12,Citation19]). Obtained results show a high similarity with those of the cited references. shows a slightly ascending tendency as a function of DC failure time, which means that VF time is larger for higher DC failure time values because the residual heat is lower when FR begins. In the case of the previous analysis [Citation14] referred to SBO with SLOCA sequences, a significantly different result was obtained. In that case, some damage times differed from the generic ones for sequences with a later core uncovery, and the influence of DC failure time was much more relevant. Quantitatively, the changes in the time for VF were substantial. The lack of SLOCA turns the sequence into a high pressure one, which reduces the time for VF, especially as DC failure time increases.
Figure 9. Damage indicators vs. CU time in SBO sequences without SLOCA (times obtained through previous damage curves).
To complete the study, a sensitivity analysis for the AFW mass flow is performed as the absence of SLOCA in the sequence makes it a relevant variable. The represented base case simulates an AFW mass flow of ≈24 kg/s (8 kg/s per SG, this minimum mass flow required by EOPs is plant dependent and usually corresponds to the capacity of one AFW MDP), which makes the compensation of residual heat possible from approximately t = 1100 s (see ). Consequently, from that moment in time on, residual heat is evacuated and SGs inventory stabilized before starting its recovery. However, there may be situations in which AFW mass flow lies below the required minimum. A reason for this analysis, in line with post-Fukushima SAMG modifications, is the potential need of portable equipment in case of TDP failure [Citation23]. Given this scenario, a low mass flow could come from portable equipment with insufficient flow or even from an overpressure in the secondary circuit, impeding a sufficient injection. The importance of this issue is such that Westinghouse performs an analysis in WCAP-16 800 [Citation24,Citation25], in which the management of secondary pressure and portable equipment mass flow is assessed; the study includes portable pumps with different shutoff head, and is carried out using MAAP4 code.
Figure 10. Total AFW mass flow needed for the evacuation of residual heat.
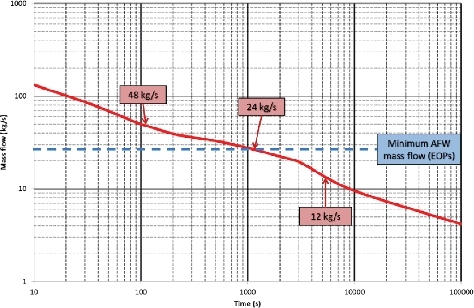
The performed sensitivity analysis studies the impact of this lesser mass flow to the SGs (0, 6, 12 and 24 kg/s). Results are shown in –; shows the required AFW mass flow to compensate the residual heat along the transient. Another interpretation is the possibility of knowing the moment in time from which evacuation of the residual heat by means of a particular AFW flow to SGs is possible. represents such sensitivity analysis to the TDP mass flow. It shows, for a given mass flow, the evolution of a sequence without any human actions. This representation gives evidence of two different behaviors as a function of TDP mass flow:
| (1) | For low values of TDP mass flow, damage times (CU; VF; AFW-TDP Failed, AF) are independent from DC failure time. | ||||
| (2) | For higher values of TDP mass flow, however, there is a strong dependence. | ||||
Figure 11. Damage times for different DC failure times.
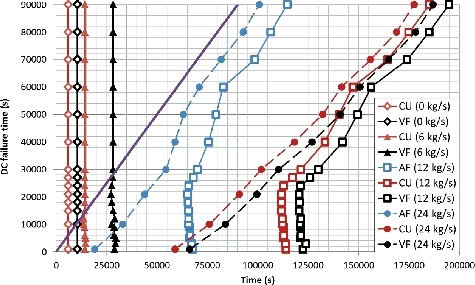
Figure 12. Damage times for different TDP mass flow.
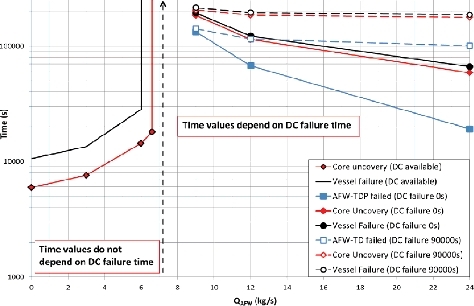
tries to show the cause for this dependency. It represents damage times as a function of total AFW mass flow and it allows the following interpretation:
| (1) | For Q > QTR (being QTR ∼7.5 kg/s), the TDP fails because an excessive flow to the SGs overfill them making liquid water enter the TDP. This kind of failure happens sooner as AFW flow increases. As it was mentioned above, it is possible to repair the AFW TDP and the available time suffices to perform the needed actions (for DC failure at 0 s, available time oscillates between 11 and 14 h depending on Q; for DC failure time at 90,000 s, available time lies between 20–21 h depending on Q). | ||||
| (2) | For Q < QTR, the TDP never fails; however, AFW mass flow to the SGs is not able to compensate the residual heat and so, RCS boils causing the discharge of its inventory through pressurizer (PZR) valves. | ||||
The transition value QTR depends on the previous power history and fuel composition. The subsequent damage states, like CU and VF, are the consequence of these previously mentioned failures (TDP failure or AFW mass flow below the minimum needed value, QTR).
In the context of an SBO with no available instrumentation (DC failure), blind control of SGs level must be performed, and so AFW mass flow turns into a critical variable. In light of , if the necessity of blind SG feeding comes into the scene, it would be advisable to remain a little over the value QTR, as opposed to slightly under it: available times until damage are greater when AFW mass flow remains over this value, whereas going below pushes towards an earlier failure.
WEC has analyzed this problem in WCAP 16939 [Citation22,Citation26], where several alternatives for AFW mass flow are taken under advise in a sequence with an AFW TDP available but no AC/DC. An analysis similar to the one here presented is carried out using MAAP4 code.
3.2. Multiple damage domain seeking
As stated in Section 2, ISA analyses entail as an essential step, obtaining as many DDs as DDIs of interest considered for any sequence. According to the same approach followed in [Citation14], this set of DDs is represented in a comprehensive and convenient manner by using the following color code(see electronic version to appreciate the colors meaning): green (no core uncovery); red (CU); blue (ICC conditions); orange (cladding embrittlement); purple (FR) and black (VF). The point in time corresponding to the most severe damage state reached along a particular transient (also called a path within ISA methodology), taking for granted that all the lower severity damage states have already been reached, is represented with this color code in subsequent figures. In other words, an orange color means that not only cladding embrittlement has been reached but also that CU and ICC have previously occurred. This allows depicting in a condensed manner the so-called multiple damage domain (MDD), assigning each point of the MDD to a particular simulation of the SBO sequence with DC power loss occurring at time t0 and AC power recovery at time t1.
In this analysis, DC power is lost at an uncertain time and, as availability of AC power implies availability of DC power, only sequences with tACREC greater than tDCLOST have been considered. That implies that the different DDs are enclosed between the bisector of tDCLOST = tACREC and PD lines previously calculated for different damages.
Different AM strategies imply different MDDs, allowing an assessment of each strategy from the point of view of this set of DDI, i.e. in terms of benefits and/or drawbacks of possible strategies. Two possible AM strategies are considered in the sequel, namely one corresponding to SAG-2 with a fast secondary cooling, and other with an slow cooling (55 K/hour) also from the secondary side. Due to the fact that during severe accident sequences with extended core damage the hydrogen could concentrate in the primary side of SGs, thereby limiting the extent of RCS depressurization [Citation27], the generated hydrogen during the sequence could limit the effectiveness of both types of SAM strategies.
The process to obtain the first MDD has taken, for each DC failure time, the following steps:
| (1) | CU is checked in all paths with the same DC failure time, . Figure 13. RCS collapsed liquid level with AC recovery at different times (DC failure at 20,000 s), fast cooling. 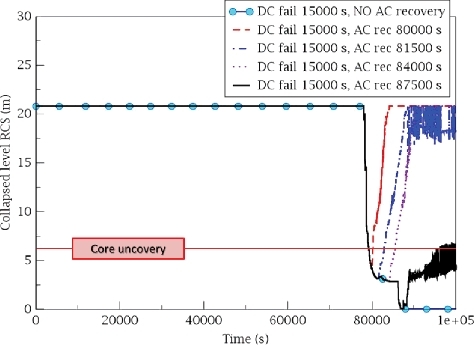 | ||||
| (2) | ICC conditions are checked in all paths with CU. | ||||
| (3) | Cladding embrittlement criteria is checked in all paths with ICC conditions exceeded, . Figure 14. Core temperature with AC recovery at different times (DC failure at 20,000 s), fast cooling. 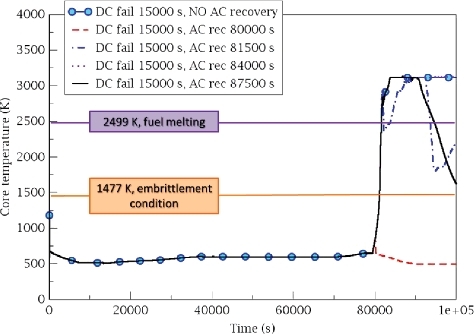 | ||||
| (4) | Beginning of FR is checked in all paths with high PCT. | ||||
| (5) | VF is checked in all paths with FR, . Figure 15. RCS pressure with AC recovery at different times (DC failure at 20,000 s), fast cooling. 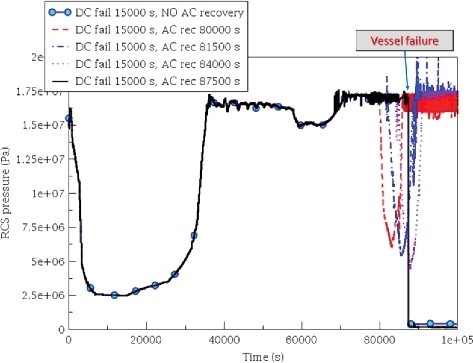 | ||||
collects the first MDD obtained from near 500 SCAIS-MAAP4 simulations. All these simulations consider SAG-1, SAG-2 and SAG-3 actions with fast cooling by means of SG PORVs (from SAG-2). The end state for each path is represented with the above described color code in , taking into account that reaching a given DDI implies reaching all the lower severity DDIs. In that manner, the PD curves () would represent the plant state just before AC recovery, while the MDD () would represent the end damage state of the paths at the completion of the simulation. depicts the boundaries of the different zones for , in which the behavior and the final damage state of the sequences are different, allowing to draw the following conclusions for SBO sequences with fast cooling strategy:
Zone A: CU could be avoided, if AC is recovered before core uncovery PD line.
Zone B: This zone between core uncovery PD and PCT PD lines delimits a region of minor damages. FR would be avoided if AC is recovered amongst these times.
Zone C: Despite AC being recovered before fuel relocation PD time there is a lapse of time for which FR cannot be avoided, regardless of any management actions.
Zone D: Fuel relocation PD has been exceeded and FR cannot be avoided.
Zone E: VF would not be avoided if AC is recovered after vessel failure PD time. This zone also comprises those sequences leading to VF that stochastically appear in zones C and D.
Figure 16. Multiple damage domain seeking (case with fast cooling).
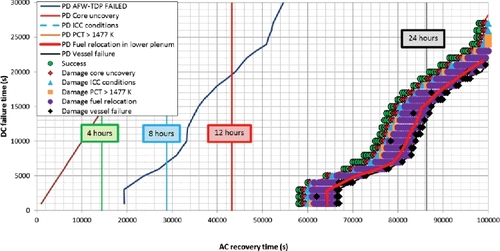
Figure 17. Multiple damage domain (case with fast cooling).
MDD can be seen as available times for operator actions before a certain level of damage is reached. With that aim, it is necessary to seek the boundaries between the different damage zones, , by measuring the first damage point of each damage indicator in each DC failure time.
Figure 18. Available times for each DDI (case with fast cooling).
3.3. Impact of severe accident management (SAM) strategies on vessel failure conditions
The comparison of eventual end states considering a different SAM strategy is analyzed with a second MDD obtained from about 550 simulation runs. These simulations consider EOPs (E-0 and ECA-0.0) and SAG-1, SAG-2 and SAG-3, but with slow RCS cooling (55 K/hour) by means of SG PORVs. compares both MDDs (corresponding to fast and slow cooling), showing that there are no evident zones leading to different end states in a deterministic way. With the exception of a series of isolated cases, highlighted in , which reach a further damage state for a fast depressurization strategy, it is difficult to draw clear conclusions as a very similar MDD is obtained for both cooling strategies. As a general idea, it will be efficient to inject as much water as possible before the beginning of FR. However, this action is no longer a warranty for avoiding VF given the stochastic nature of the sequence.
Figure 19. Comparison between MDDs with slow and fast cooling.
These isolated cases which lead to VF may be avoided by the application of slow cooling. This strategy prevents sudden increases in the safety injection flow, which at the same time avoid sudden increases in pressure due to large amounts of steam generation that could cause VF. This is true for those situations when the AM phase starts by the time fuel melting has already begun. Furthermore, the same result (however less uncertain) was already obtained in the study for SBO with SLOCA [Citation14] and once again confirms what French SAMGs state: water injection should be avoided after few hours of core degradation if a sufficient break does not exist on the reactor cooling system because of re-pressurization (see [Citation28,Citation29]).
Nevertheless, if the operating crew intervenes before the time fuel melting has started, the conclusion is not so obvious. During the initial phases of the sequence, a fast depressurization could be advisable in order to inject as much water as possible before fuel melting starts, even though its effect is visible only in the short term.
3.4. Impact of SLOCA on SBO sequences
In order to analyze the effect of SLOCA in the sequence, a base case with loss of DC at 15,000 s, with and without SLOCA, has been simulated. A similar analysis (SBO with SLOCA, including human actions, depressurization and conservative residual heat in the calculations) appears in [Citation30,Citation31], which is being applied by the nuclear industry in order to obtain available times until failure in the sequence.
The sequence with SLOCA consideration represents every NPP with conventional RCP seals, but also the possibility of passive seal failure. In the case of no actuation of the passive seal (0.0271/demand), see [Citation12,Citation32], existing seal model leakage rates are applied [Citation6] and so both situations are comparable. The aim is to study the main characteristics and differences in both sequences, including human actions and severe accident phenomenology.
In a first simulation, an SBO with SLOCA is analyzed. Loss of DC occurs at 15,000 s, and VF at 40,498 s. Besides, unavailability of HPSI, LPSI and containment sprays has been taken into account. Following step 16 of EOP ECA-0.0, at 600 s cooling at 55 K/h starts; and the SLOCA volumetric flow varies from 1.32E-3 m3/s (21 gpm) to 1.15E-2 m3/s (182 gpm) when saturation point is reached [Citation6]. As in the case of SBO without SLOCA, manual control of SG level is carried out through the TDP while DC is available; when DC is lost, AFW flow to SGs is kept constant and SG PORVs remain stuck closed. In a second simulation, an SBO without SLOCA is analyzed, being otherwise similar to the first sequence. VF happens at 87,384 s.
shows the main variables for both sequences (with and without SLOCA). It presents the repressurization process due to SG PORVs failure in stuck closed position once DC is lost. Besides, when SLOCA occurs, primary pressure allows to identify VF at 40,500 s as it causes a sudden drop in its value. Core temperatures can also be observed, seeing how at 30,000 s embrittlement criterion is exceeded for the case with SLOCA and at 81,500 s for the case without SLOCA. Time for partial core fusion can also be extracted from the same figure. Finally, it shows SG level control through AFW.
Figure 20. Primary and secondary pressure, core temperature and SG level. (DC failure at 15,000 s). Comparison of SBO with and without SLOCA.
The comparison of the PD diagrams for three cases, minimum AFW massflow with or without SLOCA and also the case without AFW mass flow (see ), illustrates the dominating phenomena in the case study and their order of importance depending on the developed conditions throughout the sequence:
This representation evidences that for the possibility of no AFW mass flow, or a very low mass flow, the absence of AFW will be the dominant event of the sequence, giving rise to the earliest damages (VF after 3 h approximately).
If there is enough AFW massflow, the SLOCA occurrence is the dominating event in the sequence, as the inventory loss would drive the sequence evolution.
Then, if there is no SLOCA and there is sufficient AFW mass flow, the possibility of an excessive AFW flow leading to TDP failure would be the most concerning event, giving rise to later damages.
Finally, there is a fourth dependence corresponding to the DC failure time which has a different impact on the sequence depending on its development: it has no significant impact when AFW flow is insufficient, a somewhat more significant impact when the SBO sequence includes an SLOCA and, a very important effect when TDP failure due to SG overfill occurs.
Figure 21. PD curves. SBO with and without SLOCA.
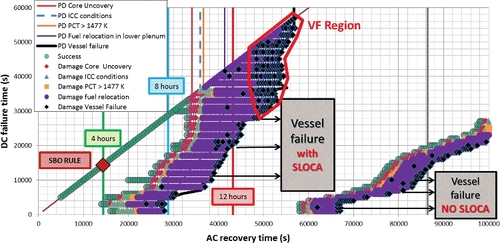
The MDD comparison in , corresponding to both cases with and without SLOCA, shows the end states of the plant ranging from success sequences to those with VF (note that it only shows a case with SLOCA versus one without, both of them with the AFW mass flow required by EOPs). These MDDs have been obtained from more than 1100 simulations with the application of EOPs (E-0, ECA-0.0, E-1, ES-1.2, SAG-1, SAG-2 and SAG-3 for SBO with SLOCA; and E-0, ECA-0.0, SAG-1, SAG-2 and SAG-3 for SBO without SLOCA). In this case, the comparison of both MDDs shows similar damage regions, but translated on time. The main difference is a new region in SBO with SLOCA case, denoted ‘VF region’ in , which does not appear in the SBO without SLOCA case, which corresponds to a large set of paths in which the injection begins before VF but this damage cannot be avoided.
Figure 22. MDDs. Comparison of SBO with and without SLOCA. (Fast cooling).
4. Conclusions
This article shows a practical example of application of the ISA methodology for severe accident sequences of SBO in the case of RCP including new passive thermal shutdown seals (i.e. without SLOCA). The main conclusions obtained after this study are the following:
Passive thermal seals represent a great step forward in nuclear safety of PWRs. The absence of SLOCA in SBO sequences slows down the damage progression, increasing the margin to CU and other damage indicators.
SBO without SLOCA sequences phenomenology is dominated by AFW mass flow: mass flow lower than a critical value leads to early damage as SGs dry out, whereas mass flow higher than a critical value leads to late damages as the TDP fails when the SGs are overfilled.
The absence of SLOCA in the analyzed SBO makes AFW mass flow the dominant variable in the sequence, consequently turning blind feeding of the SGs into an essential procedure. The comparison of both SAM strategies (either fast or slow cooling) shows no evident zones leading to different end states in a deterministic way. Despite the stochastic behavior, as a general idea, to inject as much water as possible (fast cooling) during the initial phases of the sequence before fuel melting begins is an efficient procedure to avoid VF. After this moment in time, and due to the possible increase in pressure caused by large amounts of steam generation, slow cooling is a better suited strategy.
Comparison of the different SBO sequences analyses performed in the paper allow concluding that the order of importance in the dominant phenomena is as follows: AFW failure or low AFW mass flow dominates SBO sequences (for both cases with and without SLOCA); the second phenomena in importance is SLOCA, which accelerates the progression of the accident due to the loss of inventory; third, an excessive mass flow leading to TDP failure would be the concerning event. Finally, there is a fourth dependence corresponding to DC failure time which has a different impact on the sequence depending on its development.
General ingredients of ISA-CSN methodology applied in this and previous studies allow analyzing and optimizing different operator management strategies, as they take into account possible damages in the reactor and in the whole facility. They provide important information to the analyst regarding the impact of uncertain times in AM and safety analysis (e.g. uncertain time bounds, subtle interactions between plant dynamics and AM actuations, identification of hidden threats, etc.).
Acknowledgments
The authors acknowledge the support by ‘Cátedra Juan Manuel Kindelán’ of Spanish Nuclear Regulatory Body (CSN) which has allowed performing this work.
This work has also been funded by the Spanish Ministry of Competitiveness and Economy within PYGAS project: [grant number ENE2015-67638-R (MINECO/FEDER)]. Its support is gratefully acknowledged.
Disclosure statement
No potential conflict of interest was reported by the authors.
Additional information
Funding
References
- Hernández H, Fornós J, Muñoz C. RCP passive seal installation in ANAV within post-fukushima performances. 42th Annual Meeting of the Spanish Nuclear Society (SNE), Santander. Spain; 2016 Sep 28–30. Spanish.
- Technical proposal. Request for renewal of operating authorization for Trillo NPP. 2014. Spanish.
- Westinghouse Electric Company. AP1000 Design control document. 2008. Rev. 19.
- AREVA. PCSR – Sub-chapter 5.4 – Components and systems sizing. 2012. UKEPR-0002-054 Issue 05.
- Schneider RE. APR 1400 RCP seal design and ELAP capability. Presented to US NRC Staff at PARM on APR1400 DCA; 2014. AAN: ML14262A259
- NRC. State-of-the-art reactor consequence analyses project, Volume 2: Surry integrated analysis. 2012. NUREG/CR-7110, Vol 2.
- NRC. Regulatory analysis for generic Issue 23: Reactor coolant pump seal failure. 1991. NUREG-1401.
- INL. Support and modeling for the boiling water reactor station black out case study using RELAP and RAVEN. 2013. Light Water Reactor Sustainability Program. INL/EXT-13-30203, Revision 0.
- AREVA. AREVA qualifies new hydrodynamic seal. 2012. Available from: https://doi.org/https://doi.org/10.1016/S1350-4789(12)70255-6
- Flowserve. White paper on the response of the N-Seal Reactor Coolant Pump (RCP) seal package to extended loss of all power (ELAP). 2015. AAN: ML15222A357.
- Westinghouse Electric Company. Use of westinghouse SHIELD® passive shutdown seal for FLEX strategies. 2014. TR-FSE-14-1-NP, Rev. 1
- PWROG. PRA model for the generation III westinghouse shutdown seal. 2014. PWROG-14001-NP, Rev. 1
- Westinghouse Electric Company. 2012. SHIELD® passive thermal shutdown seal for reactor coolant pumps. NS-FS-0106
- Queral C, Mena-Rosell L, Jimenez G, et al. Verification of SAMGs in SBO sequences with Seal LOCA. Multiple damage domains. Ann Nucl Energy. 98:2016;90–111.
- AREVA. Tests of shaft seal systems of circulation pumps during station blackout. Paper presented at: 40th Annual Meeting of the Spanish Nuclear Society (SNE), Valencia. Spain; 2014 Oct 1–3.
- Ibánez L, Hortal J, Queral C, et al. Application of the integrated safety assessment methodology to safety margins. Dynamic event trees, damage domains and risk assessment. Reliab Eng Syst Saf. 147:2016;170–193.
- Izquierdo JM, Hortal J, Sánchez-Perea M, et al. CSN Experience in the development and application of a computer platform to verify consistency of deterministic and probabilistic licensing safety cases. Vol 1, General approach and deterministic developments. Madrid (Spain): CSN Publication; 2016.
- Izquierdo JM, Hortal J, Sánchez-Perea M, et al. Why sequence dynamics matters in PSA: Checking consistency of probabilistic and deterministic analyses. In: Aldemir T, editor. To be published in advanced concepts in nuclear energy risk assessment and management. World Scientific Publishing Company Pte. Ltd.;2018
- MAAP4. User´s manual. MAAP4, modular accident analysis program, Volume 1, 1994. User Guidance, EPRI, May, 1994.
- NRC. Operating experience feedback report – reliability of safety-related steam turbin-driven standby pumps. 1994 NUREG-1275, Vol. 10.
- SARnet. Short course on severe accident phenomenology. London (UK): Centre for Nuclear Engineering, Imperial College;2013.
- International Topical Meeting on Probabilistic Safety Assessment and Analysis. PSA. Vol. 3. Knoxville, Tennessee, 7-11 September; 2008.
- Harter R. FLEX implementation. 2015 SAMG-D course, IAEA, Vienna, Austria 19–23 October 2015.
- Baron BR, Lutz RJ. Insights into operating a low pressure feed pump for loss of all AC and DC power. 2008. ICONE16, May 11–15, 2008, Orlando, Florida, USA.
- Westinghouse Electric Company. Insights for operating steam generators to minimize RCS inventory loss following a loss of all AC and DC power. 2007. WCAP-16800-NP, Rev. 0.
- Westinghouse Electric Company. PRA model guidance for blind feeding a steam generator (PA-RMSC-0146R3). 2008. WCAP-16939-NP, Rev. 0.
- Electric Power Research Institute. Severe accident management guidance technical basis report, Volume 1. Candidate High-Level Actions and Their Effects. Palo Alto (CA): EPRI; 2012. (1025295).
- Hermsmeyer S, Iglesias R, Herranz LE, et al. Review of current Severe Accident Management (SAM) Approaches for nuclear power plants in Europe. European Commission, JRC; Publications Office of the European Union, 2014.
- Raimond E, Bonnet JM, Cenerino G, et al. Continued efforts to improve the robustness of the French Gen II PWRs with respect to the risks of severe accidents. Safety assessment and research activities. Paris: EUROSAFE Forum;2011.
- RETRAN User Group (RUG) ELAP Workshop. Duke energy. Charlotte (NC); 2013.
- Westinghouse Electric Company. Reactor coolant system response to the extended loss of AC power event for westinghouse, combustion engineering and babcock & wilcox NSSS designs. 2013 WCAP-17601-P, Rev. 1.
- Southern Company. Response to request for additional information regarding license amendment request for transition to 10 CFR 50.48(c) - NFPA 805 performance based, standard for fire protection for light water reactor generating plants. 2014 AAN: ML14223A646.
- International Atomic Energy Agency Generic assessment procedures for determining protective actions during a reactor accident. 1997 IAEA-TECDOC-955.
- NRC. RTM-96, Response technical manual. 1996 NUREG/BR-0150, Vol.1, Rev.4, Page A-23.