
ABSTRACT
In order to maintain the integrity of a nuclear power plant containment and effectively manage a severe accident, it is necessary to understand phenomena occurring in the atmosphere of the nuclear power plant containment during the accident. A number of containment atmosphere mixing experiments have been performed in the dedicated experimental facilities, followed by the numerical simulations using lumped-parameter and computational fluid dynamics codes. This paper presents the THAI+ test facility experiment TH27 post-benchmark simulations performed with the lumped-parameter code ASTEC. The experiment TH27 was an initial operation test of the THAI+ facility, which has been recently constructed by expanding the experimental facility THAI with the newly constructed parallel attachable drum vessel. The experiment featured steam and helium injections and transport and mixing of gasses and steam between the two vessels, as well as wall heating and cooling of different vessels. The TH27 experiment was performed together with an international multistage benchmark, consisting of double-blind, blind, and open phases. The developed nodalization scheme and the features of the calculation are presented in the paper. The results of the calculations are compared to the experimental values for the main containment parameters – pressure, gas and wall temperatures, helium concentrations.
KEYWORDS:
1. Introduction
According to the defence-in-depth concept, the containment of a nuclear power plant is the last barrier protecting the environment against the release of radioactive fission products in case of a severe accident [Citation1]. In order to effectively manage an on-going severe accident and prevent radioactive releases, it is essential to maintain the containment integrity and its function under the best possible conditions. This necessitates a high level of understanding and predictive capability of the phenomena occurring in the atmosphere of the nuclear power plant containment during the accident. Acknowledging this necessity, a large number of containment atmosphere mixing experiments have been performed in the dedicated experimental facilities, experiments followed by the numerical simulations using lumped-parameter and computational fluid dynamics (CFD) computer codes, including international standard problems and benchmarks. International standard problems No. 23 [Citation2], 29 [Citation3], 35 [Citation4], 37 [Citation5], and 47 [Citation6] showed the tendencies of lumped-parameter codes to overestimate atmosphere mixing when stratification conditions exist and possible ways to solve them by selecting appropriate nodalization schemes. Simulation of jet/plume releases of gases using lumped-parameter codes is problematic and requires additional nodalization features. However, when these features are successfully applied, it is possible to obtain sufficiently accurate results, as was demonstrated in the simulations of various experiments – THAI HM2 with COCOSYS [Citation7] and MELCOR [Citation8], PANDA SETH with ASTEC [Citation9], THAI TH13 with COCOSYS [Citation10] and others.
This paper presents the results of the THAI+ TH27 experiment simulations. The TH27 experiment was the commissioning test of THAI+ facility. THAI+ facility was formed when the THAI experimental facility, operated by Becker Technologies GmbH in Eschborn, Germany, has been extended with a second, newly constructed PAD (parallel attachable drum) vessel in order to correspond to a two-compartment configuration [Citation11]. The TH27 experiment was performed together with an international multistage benchmark, consisting of a double-blind, blind and open phases with more than 10 organizations participating with lumped-parameter – ASTEC, COCOSYS, MELCOR – and CFD – FLUENT, CFX, GASFLOW, GOTHIC – codes [Citation12,Citation13]. The paper presents post-benchmark simulations performed with the ASTEC code.
The TH27 experiment conditions are established by the wall heating and cooling in different vessels, and helium and separate steam injections at different experiment phases and facility locations. The essential processes determining the containment atmosphere mixing are the transport of air, steam, and water between the two vessels of the THAI+ facility, steam condensation and heat exchange through the external facility walls. The experiment addresses steam and wall heating of the atmosphere; pressure stabilization by the compensation of heat losses with the injected steam; and light gas injection with the formation of stable stratified conditions, their break-up and subsequent gas mixing leading to homogeneous distributions of light gas.
During the blind and double-blind phases of the benchmark, the thermal losses of the system were under-predicted by the participants due to overly optimistic thermal insulation data given by the specification report. However, it was observed that the steam injection and pressure decrease rates depend not only on heat losses. It was concluded that the other important factors and modelling choices, e.g. manner of the applied wall temperatures control or condensate distribution played an important role in the simulations of the experiment. The light gas distribution was another important issue which was challenging for the benchmark participants. During the blind and double-blind phases, only the CFD simulations provided a stable helium layer in the upper connecting pipe during the stratification phase. All the lumped parameter contributions observed dilution of the helium layer by other gases. It was found that for lumped-parameter codes, finer vertical subdivisions above and below the injection location and plume nodalizations improve light gas distribution results. Considering the predictive capabilities of codes in the blind simulations, it was found that most of the main experiment characteristics were predicted well qualitatively.
The authors of the paper participated in the TH27 double-blind and blind benchmark and continued post-benchmark analysis. This paper presents the results of post-benchmark simulations. One of the incentives to continue with the ASTEC simulations of the experiment post-benchmark was the enthalpy of the injected steam, which was defined incorrectly by the authors in the benchmark simulations. This error resulted in significant deviation of pressure evolution and water/steam contents in the facility compared to the experiment and contributions of other benchmark participants. However, initial post-benchmark analysis showed that even with the correct steam enthalpy, the obtained results still had deficiencies in pressure evolution and helium behaviour (consistent with the results of other lumped-parameter benchmark contributions). Therefore, a number of follow-up simulations were performed investigating the sensitivity of the results to the heat losses through the thermal insulation and nodalization features. While we did not manage to obtain results fully corresponding to the experimental values, results presented in this paper are significantly closer to them than our benchmark contributions.
The experimental configuration is presented in Section 2. The developed nodalization scheme and the features of the calculation are presented in the Section 3. Section 4 presents the results of the calculations and their comparison of the experimental values for the main containment parameters – pressure, gas and wall temperatures, and helium concentrations. The impact of nodalization choices on helium distribution is discussed.
2. Experimental facility and TH27 test
THAI+ test facility is composed of two vertical vessels: THAI and PAD. They are connected with single horizontal pipes at the bottom and top parts of the facility ().
Figure 1. Scheme of THAI+ facility.
Both vessels have cylinder-shaped main parts and sump compartments at the bottom. THAI vessel had a removable open inner cylinder and horizontal condensate storage trays installed for the TH27 experiment. The condensate trays were installed at h = 4 m elevation. They block two-thirds of the cross-sectional area between the inner cylinder and facility walls (). Trays are made of 10 mm thickness steel. PAD vessel had no internal elements.
Figure 2. Schematic view of the THAI vessel cross-section at 4 m elevation, condensate trays in grey.
The THAI vessel has 9.2 m height and 3.2 m diameter and the PAD vessel has 9.8 m height and 1.6 m diameter, resulting in a total volume of 80 m3. The horizontal connecting pipes have diameters of 0.5 m.
The external walls of both vessels and pipes are made of steel, mostly steel 1.4571. The thickness of both vessel walls (main cylindrical parts) is 22 mm. The wall thickness of the connecting pipes is 10 mm. Three cooling/heating jackets (vertical sections) are attached to the walls of the main cylindrical parts of each vessel. The cooling/heating jackets operate by using heating oil, which is guided helically around the corresponding part of vessel steel structure. Other parts of THAI and PAD vessel walls have electrical heaters attached to them, but PAD vessel electrical heating was not activated in this experiment. Both vessels and connecting pipes are thermally insulated with a 12 cm thick rock wool layer enveloped with 1 mm aluminium foil.
Three gas injection lines are used in the experiment (). Steam is injected into the THAI vessel at the lower (h = 1.6 m) and upper (h = 5.75 m) positions. Helium is injected in the upper part of PAD vessel (h = 6.2 m). The upper steam and helium injection lines are equipped with the upwards directed nozzles. At the lower THAI vessel elevation, steam is injected horizontally. After 11 mm distance injected steam impinges on a vertical plate.
Both vessels have the condensate collection gutters on the walls. THAI vessel has the lower (h = 1.14 m) and upper (h = 6.605 m) gutters on the external walls and gutters on the inner cylinder, one on the inside and one on the outside at h = 2.305 m. PAD vessel has two gutters, both on the walls, at h = 1.868 m and h = 6.73 m.
The experiment is started from room temperature and pressure with air content. Initial relative humidity of 60 % was assumed. 251.58 l of water are present in the PAD vessel sump.
The experiment sequence consists of the following seven phases:
Steam heating phase. The facility is heated by steam injected with a mass flow rate of 34.83 g/s. Initially, the upper steam injection is active. At 1800 s it is stopped and lower steam injection is started. This phase lasts until a pressure of 2 bar is reached.
Pressure stabilization phase. When a pressure of 2 bar is reached, the flow rate of the lower steam injection is regulated to compensate heat losses and maintain stable pressure of 2 bar.
Intermediate phase. This phase starts at 9 h (32,400 s) when the lower steam injection is stopped and THAI vessel heating by three jackets and electrical heating elements is started. Heating power is regulated to reach and maintain 105.5 °C temperature of heated walls.
Pressure stabilization phase. It is started at 24 h (86,400 s). During this phase, the lower steam injection is active with initially constant mass flow rate of 30.86 g/s. When 2.5 bar pressure is reached, injection mass flow rate is regulated to balance heat losses and maintain the constant pressure.
Sequential cooling phase. Starting with 27 h (97,200 s), three PAD vessel cooling jackets are activated sequentially. At 27 h, the lower cooling jacket is activated and initially provides 10.45 kW of cooling power. The lower steam injection mass flow rate increases accordingly to account for the increased heat removal. At 30 h (108,000 s), the middle cooling jacket is activated with 10.45 kW initial cooling power. The steam injection rate is adjusted accordingly. At 32 h (115,200 s), the upper cooling jacket is activated with 7.04 kW initial cooling power, and steam injection rate is again adjusted accordingly.
Helium injection and mixing phase. At 34 h (122,400 s), the helium injection is activated in the PAD vessel with a mass flow rate of 0.87 g/s and is maintained until 1.96 kg of helium is injected.
Cooldown phase. At 36.55 h (131,580 s) the heating and cooling of both vessels and steam injection are stopped. The facility is left to cool down until 60 h (216,000 s). Pressure and temperature in the facility continuously decrease due to heat losses.
3. Nodalization scheme and model features
The simulations were performed using an integral severe accident code ASTEC v2.1.1.0 [Citation14]. ASTEC is developed by IRSN (France) for the simulations of the entire severe accident sequences in a nuclear water-cooled reactor from the initiating event to the release of radioactive elements out of the containment. Only the containment part of ASTEC – CPA – was employed for the simulations. CPA uses a lumped-parameter approach to simulate all important containment phenomena.
When using a lumped-parameter approach, the simulated system is described using zero-dimensional nodes (zones), which are considered homogeneous. The mass exchange of gas phase between the zones is modelled using one-dimensional atmospheric junctions. Separate junctions are described for liquid flows between the zones. Other objects and various safety systems can also be described, e.g. structures (walls), pumps, spray systems, valves, etc. Heat exchange between the zones and walls can be simulated by a number of heat transfer regimes: free and forced convection, condensation and radiation.
In order to simulate the facility with a lumped-parameter code, its nodalization scheme was developed ().
Figure 3. Nodalization scheme of THAI+ facility.
In the developed nodalization scheme, THAI+ facility is subdivided into 91 control volumes. Their dimensions correspond to the geometric values of a corresponding subdivision. Additional nodes are employed for the environment and as targets for the condensate, which is removed from the facility during the experiment, and gas, which is sampled from the facility. THAI vessel is vertically subdivided into 17 layers, PAD vessel into 10. The lower connecting pipe is simulated with one node, upper pipe with five. The near wall region (5 cm) is simulated as a separate node in each level of the main cylindrical part of both vessels.
The use of the lumped-parameter approach may have influence on the calculation accuracy, especially when parts of the simulated system are not homogeneous and rapid mass transfer processes are occurring. Therefore, when developing the nodalization scheme, it is necessary to take into account what processes are likely to occur and consider a more detailed description of some parts of the system or use other methods to circumvent limitations of numerical approach used. Calculations during the benchmark and post-benchmark periods were performed with a number of different nodalization schemes to assess the sensitivity of the results to various features of the schemes. This paper presents the nodalization scheme and calculations which provided results closest to the experimental values.
One of the processes, which needs special measures for lumped-parameter simulation, is gas injection. The problem is caused by the momentum balance which is not calculated for the zones in the lumped-parameter approach. When gas jet injections are simulated, the local momentum transfer is important and this method deficiency has to be compensated by applying additional nodalization features. In the presented case, the plume-shaped injection zones were employed (darker zones in ) to facilitate simulation of gas injections. These zones form a truncated right circular cone, which forms a 16° angle with the flow direction. They are defined right above the geometrical nozzle heights. Employment of these zones allows more accurate simulation of injected gas distribution and mixing when using lumped-parameter codes [Citation8–10,Citation15,Citation16].
In order to obtain more accurate behaviour of helium gas in the facility after injection is stopped, nodalization was further refined compared to the one used in the benchmark. These refinements mainly consisted of varying a number of vertical subdivision layers at the top part of PAD vessel and in the upper connecting pipe. The presented nodalization scheme provided helium concentrations and stable layer duration closest to the experiment results of all the schemes investigated by the paper authors.
Facility walls are simulated as structures transferring heat to the environment with dimensions corresponding to the geometrical values. The layer configurations of all structures are simulated (no averaging between different materials). Structures with oil heaters attached have corresponding layers of oil and steel added to them. No circulation of heating oil was simulated. Instead, oil is treated in the same way as steel or other materials composing a given wall. Heat is then injected or removed from the oil according to the data tables presented in the specification report. Therefore, the operation of the THAI heating and PAD cooling mantles is simulated using the heat injections, which are defined using tables provided in the benchmark report. The operation of electrical heaters is simulated dynamically, by automatically controlling their heating power according to the calculated surface temperature of a corresponding structure.
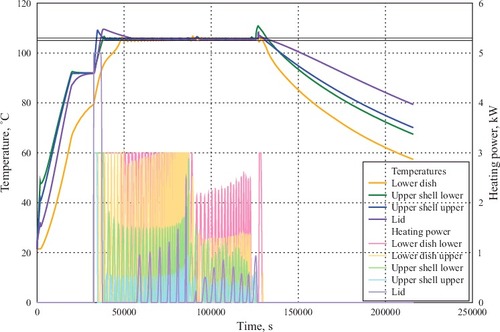
The results of the automatic electrical heating power control and the temperatures of the corresponding structures are presented in . The target temperature of the structures was 105.5 °C, in the interval between 105 and 106 °C is marked by the black solid horizontal lines. When activated, the heaters operate with maximal power until the target temperatures of the corresponding structures are reached. Then the code automatically modifies their power according to the target structure temperature until they are deactivated.
Figure 4. Electrical heating power control.
4. Results of the simulation
presents evolution of the facility pressure and lower steam injection. Initially, pressure increases due to the steam injected into the facility until it reaches 2 bar value at ∼20,000 s. The increase obtained from the calculations agrees well with the experimental results. After the pressure stabilization phase, pressure decreases due to heat losses from the facility. Lower heat losses were obtained in the calculations than observed in the experiment, resulting in the over-prediction of pressure during the intermediate phase. The difference between the calculated and experimental pressure values increases during the pressure stabilization phase and reaches almost 0.1 bar (6% of the experimental value). Pressure increases again when steam injection is reactivated, reaching 2.5 bar value. This increase corresponds well between the numerical and experimental results. Pressure further increases when helium injection is started. This increase is accurately calculated as well. However, in the calculations the duration of a stable helium layer at the top of the facility is under-predicted, resulting in the discrepancies for pressure – calculated pressure peak duration is shorter. During the cooldown phase, heat losses are under-predicted again, resulting in overestimation of pressure in the facility. However, during this phase, the difference between the calculated and experimental pressure values increases significantly slower than during the intermediate phase and after 180,000 s even stops to increase.
Figure 5. Pressure and lower steam injection evolution.
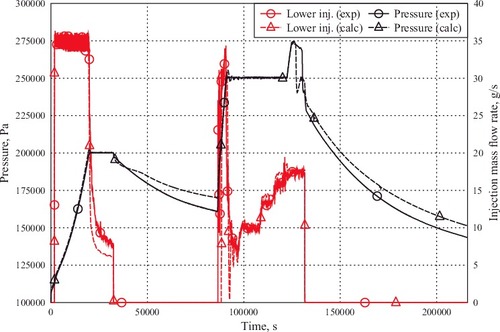
Steam injection was automatically controlled to maintain stable target pressure (2 bar during the first pressure stabilization phase and 2.5 bar during the second pressure stabilization and sequential cooling phases). Initially, until the pressure of 2 bar is reached, the steam is injected with the maximal specified rate. When the target pressure was reached, the code automatically decreased the injected mass flow rate to keep the pressure constant until the injection was turned off.
Lower steam injection mass flow rate required to keep stable 2 bar pressure was obtained in the calculations than in the experiment indicating under-predicted total condensation rate in the facility. This is supported by the deficit of collected water, presented in . During the steam heating phase, less steam is condensed on the facility structures, resulting in a slower heat-up of the walls and higher steam contents.
Figure 6. Difference between calculated and experimental total collected water.
When the lower steam injection was reactivated with the target pressure of 2.5 bar, steam was injected with the maximal specified rate, which was automatically decreased after reaching target pressure. Three step-like increases of injection mass flow rate starting at ∼100,000 s are calculated by the code when different PAD vessel cooling jackets are activated. During this phase, calculated steam injection rates required to keep constant pressure corresponded well to the experimental values. Total condensation rate () was still mostly under-predicted, leading to a conclusion that steam amount in the facility was increasing and cooling jackets must have had greater impact on gas temperature than in the experiment.
When helium injection was started, the dynamic steam injection regulation was disabled and the mass flow rate stayed constant from that moment until the injection was stopped. It is important to obtain the value of this rate close to the experimental, because it not only impacts the pressurization of the facility during the helium injection, but also the strength of the convective flow in the facility, which in turn influences stable helium layer duration.
The discrepancies between calculated and experimental values of pressure were caused by two main issues: by an underestimation of heat losses during the cooling of the vessel and by a premature breakup of stable helium layer after the helium injection.
Heat losses are underestimated due to unknown values of effective thermal conductivity of the insulation material. The mineral wool effective thermal conductivity of 0.111 W/m K was specified for the benchmark, which resulted in significant underestimation of heat losses by most of the benchmark participants during the blind phase. For the open calculations, it was suggested to use different effective mineral wool thermal conductivities for different parts of the facility: 0.111 W/m K for THAI vessel, 0.13 W/m K for PAD vessel, and 0.4 W/m K for the connecting pipes. While this allowed most participants to obtain heat losses closer to the experimental values, they were still too low. In the calculations presented in this paper, the following rock wool thermal conductivity values were used:
0.125 W/m K for THAI vessel walls except for the vessel bottom shell, where support standpipes are connected to the vessel wall. For this wall, 0.25 W/m K conductivity was used.
0.225 W/m K for PAD vessel walls
0.4 W/m K for the lower connecting pipe
0.25 W/m K for the upper connecting pipe
An underestimation of stable helium layer duration leads to a shorter duration of pressure peak during and after the helium injection. However, the pressure peak value obtained from the calculations differs by less than 0.01 bar from the experiment result. The onset of helium layer breakup is advanced by ∼2000 s compared to the experiment (∼33% out of ∼6000 s since the start of helium injection).
presents evolution of helium concentration in the facility.
Figure 7. Helium concentration evolution.
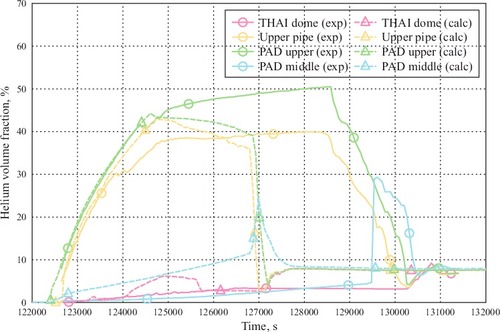
Helium is injected between the middle and upper sections of PAD vessel. In the experiment, helium flows only upwards and up to 128,000–129,000 s forms a stable layer above the PAD middle section including the upper connection, but does not flow into the THAI vessel dome. This behaviour is obtained in the calculations as well, however, less helium stays in the upper part of PAD vessel and small amount of helium is additionally leaking into the middle PAD elevations and THAI dome.
Calculated duration of stable helium layer is shorter and ends at ∼127,000 s, ∼2000 s earlier than in the experiment. When the helium layer is disrupted, the convective flow in the facility is restored. Helium is transported from the upper connection and upper part of the PAD vessel into the middle PAD elevations, where a concentration peak is observed at ∼129,500 s. Helium is mixed following the main convective loop and flows to the lower connection and then into the THAI vessel. Same behaviour is repeated in the calculations, but the helium mixing occurs a lot faster. Overall, maximal helium concentration is underestimated by ∼7% due to different distributions in the facility atmosphere (the same mass of helium was injected as in the experiment).
presents evolution of gas temperatures in the selected control volumes of the THAI vessel.
Figure 8. Gas temperature evolution in the THAI vessel.
Initially, temperature in the facility rises due to injected steam. Steam heating of the zones is calculated well. During the pressure stabilization phase, temperatures lower by a pair degrees are obtained in the calculations, confirming higher steam contents in the facility.
During the intermediate phase temperature is over-predicted in the upper part of the vessel and a temperature discrepancy appears in the lower plenum. Here at ∼50,000 s a step-like increase of temperature is obtained in the calculations. This temperature rise was caused by a momentarily increased flow of hotter gas from the vessel part above the lower plenum. Calculated temperature stays higher by 3–4 °C until steam injection is resumed.
During the sequential cooling phase, calculated gas temperature in the sump reacts to the activations of PAD cooling jackets, showing that this volume participates in the gas mixing with the lower part of the PAD vessel more than with the rest of THAI vessel. During the cooldown phase, the slopes of temperature decrease demonstrate underestimated heat losses in the upper part of the facility.
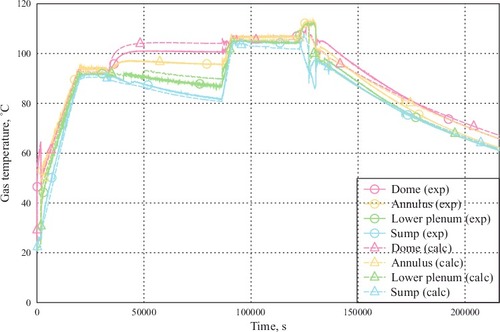
presents evolution of gas temperatures in the selected control volumes of the PAD vessel and connecting pipes.
Figure 9. Gas temperature evolution in the PAD vessel and connecting pipes.
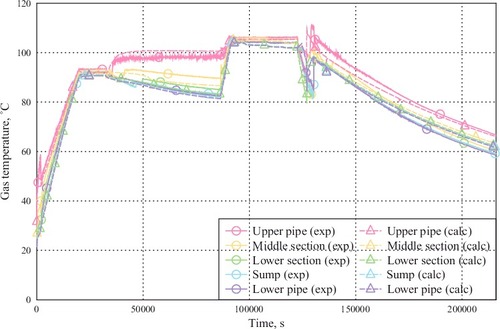
Temperature behaviour during the steam heating phase is similar to the THAI vessel case. During the intermediate phase, there occurs an opposite discrepancy to the one in the THAI vessel at the middle and lower PAD sections. Temperatures in them become under-predicted by 2–3 °C due to missing step-like temperature increases caused by the momentarily increased flow of gas from neighbouring hotter regions. During the sequential cooling phase, calculations show decreases of gas temperature in the lower part of the vessel corresponding to the activation of cooling jackets. The decreases are more pronounced in the calculations, the temperature is lower by less than 2 °C. During the cooldown phase, the slopes of temperature decrease show underestimated heat losses in all volumes except upper pipe.
presents an evolution of the selected THAI vessel wall temperatures.
Figure 10. Wall temperature evolution in the THAI vessel.
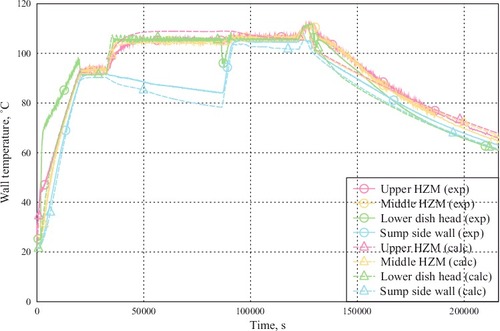
The results for the wall temperatures are similar to the gas temperatures, except that the calculated heat-up of the lower dish head structure is significantly slower than observed in the experiment when the lower steam injection is started. The lower dish head structure is situated below the lower injection point. Slower increase of its temperature during the lower steam injection phase indicates the underestimation of the downwards directed flow of the injected steam. After steam injection is stopped, sump side walls are cooling faster than in the experiment, even though gas temperatures stay similar.
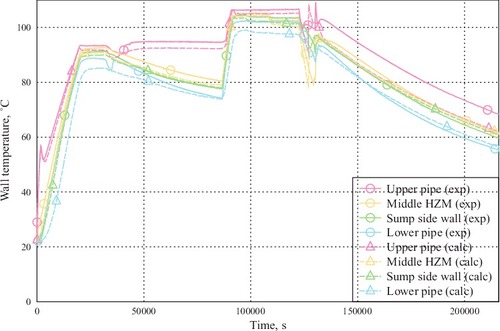
presents evolution of the selected PAD vessel and connecting pipes wall temperatures. The calculated heat-up of the lower connection structure lags behind the experimental result, suggesting delayed inflow of hot gasses after the start of steam injection. The temperature of the upper connection is under-predicted during whole calculation, even though gas temperatures correspond to the experimental values or even exceed them.
Figure 11. Wall temperature evolution in the PAD vessel and connecting pipes.
5. Conclusions
A post-benchmark simulation of the THAI+ test facility TH27 experiment was performed using a severe accident ASTEC code. The simulation of experiment TH27 is valuable for the code validation since experiment conditions correspond to those typical in the containment of a nuclear power plant under accident. It was the first test performed in the expanded THAI+ facility. This allowed the test to be used in a double-blind and blind international benchmark. The authors of the paper participated in this benchmark and performed calculations using ASTEC code. Calculations were continued post-benchmark and results of post-benchmark work were presented in this paper.
| (1) | Calculated pressure results showed good agreement with the experimental values, except in the intermediate and cooldown phases, when pressure decrease rate was under-predicted. The pressure evolution in these phases is determined by the heat losses to the environment, which were underestimated due to unknown actual effective heat transfer coefficient of the facility thermal insulation. Peak pressure value was reproduced well, difference from the experiment is less than 0.01 bar. | ||||
| (2) | Simulation of the injected helium distribution displayed some deficiencies. During the injection phase, helium leaked to the locations where it was not measured in the experiment. The maximal helium concentration was under-predicted by ∼7%. Duration of the stable helium layer, which is disrupted by re-established convective flow, was shorter by approximately 33% (2000 s). The discrepancies are caused by the over-prediction of gas mixing, which is characteristic to the lumped-parameter codes. In this case, authors were not able to sufficiently compensate for this deficiency using applied nodalization features. | ||||
| (3) | Evolution of gas and structures temperatures was predicted qualitatively. Main quantitative differences were caused by the unknown actual effective properties of the facilities thermal insulation and under-prediction of condensation rates. | ||||
The main sources of the discrepancies between the calculations and experiment results have been identified to be in precise thermal conductivity of the facility walls and deficiencies in light gas stratification modelling. To simulate heat losses correctly, the boundary conditions have to be specified very accurately, or, if possible, some facility heat-up/cooldown sequence data have to be provided to calibrate parameters related to heat losses in the model. For the simulation of stratified atmosphere to be accurate, a sufficiently fine vertical subdivision is required in the stratified region. If gas is injected in jet/plume configuration, corresponding nodalization features are required, mainly, the plume-shaped injection zones. As the presented case shows, applied features are not always sufficient to completely compensate deficiencies and further research is required.
Acknowledgments
The TH-27 double-blind benchmark was funded by the German Federal Ministry of Economic Affairs and Energy under grant number 1501455 on the basis of a decision by the German Bundestag.
The participation of the Lithuanian Energy Institute in THAI+ benchmark was funded by state budget of Lithuania through the long-term institutional research program ‘Development of future energy technologies, investigation of their safety and reliability.’
The authors would like to acknowledge M. Freitag and THAI experimental team for the benchmark management and quality of the experimental results and benchmark participants A. Bleyer, T. Janda, T. Jankowski, S. Kelm, I. Kljenak, P. Kostka, A. Mansour and S. Schwarz for their valuable comments and discussions.
Disclosure statement
No potential conflict of interest was reported by the authors.
Related Research Data
References
- IAEA. Defence in depth in nuclear safety. Vienna, Austria: IAEA; 1996. ( INSAG series; no. 10).
- Karwat H. International standard problem ISP-23: rupture of a large-diameter pipe within the HDR containment. Vols. 1 and 2. Paris: CSNI, OECD NEA; 1989. ( Tech. rep., CSNI; CSNI Report; no. 160).
- Karwat H. International standard problem ISP-29: distribution of hydrogen within the HDR containment under severe accident conditions. Vols. 1 and 2. Paris: CSNI, OECD NEA; 1993. ( Tech. rep., CSNI; CSNI Report; no. 160).
- OECD NEA. Final comparison report on ISP-35: NUPEC hydrogen mixing and distribution test (TEST M-7-1). Paris: CSNI, OECD NEA; 1995. ( Comparison Report, CSNI Report NEA/CSNI/R(94)29)
- Firnhaber M, Kanzleiter TF, Schwarz S, et al. International standard problem ISP37: VANAM M3. A multicompartment aerosol depletion test with hygroscopic aerosol material. Paris: CSNI, OECD NEA; 1996. ( Comparison Report, CSNI Report NEA/CSNI/R(96)26, GRS-137, Paris).
- Allelein H-J, Fischer K, Vendel J, et al. ISP-47, international standard problem on containment thermal-hydraulics: final report. Paris: CSNI, OECD NEA; 2007. ( CSNI Report NEA/CSNI/R(2007)10, Paris).
- Schwarz S, Fischer K, Bentaib A et al, . Benchmark on hydrogen distribution in a containment based on the OECD-NEA THAI HM-2 experiment. Proceedings of the 13th International Topical Meeting on Nuclear Reactor Thermal Hydraulics (NURETH-13); 2009 Sep 27 - Oct 2; Kanazawa City, Ishikawa Prefecture, Japan, Tokyo (Japan), Atomic Energy Society of Japan; 2009. Available from: http:// cat.inist.fr/?aModele=afficheN&cpsidt=24505350
- Duspiva J. Post test calculation of OECD THAI HM-2 experiment with MELCOR 1.8.6 code. Proceedings of the 13th International Topical Meeting on Nuclear Reactor Thermal Hydraulics (NURETH-13); 2009 Sep 27 - Oct 2; Kanazawa City, Ishikawa Prefecture, Japan, Tokyo (Japan), Atomic Energy Society of Japan; 2009.
- Bentaib A, Bleyer A, Schwarz S. ASTEC validation on PANDA SETH. Proceedings of the 13th International Topical Meeting on Nuclear Reactor Thermal Hydraulics (NURETH-13); 2009 Sep 27 - Oct 2; Kanazawa City, Ishikawa Prefecture, Japan, Tokyo (Japan), Atomic Energy Society of Japan; 2009. p. 1–8.
- Burkhardt J, Schwarz S, Koch MK. Analysis of the nodalisation influence on simulating atmospheric stratifications in the experiment THAI TH13 with the containment code system COCOSYS. Nucl Eng Technol. 2009;41(9):1135–1142.
- Freitag M. Extension of the THAI test facility by installation of the second vessel PAD. Eschborn: Becker Technologies GmbH; 2016. ( Technical Report; no. 1501455-THAIPLUS-TR).
- Freitag M, Kljenak I, Jankowski T, et al. Benchmark exercise TH27 on natural convection with steam injection and condensation inside the extended THAI facility. Proceedings of the 8th European Review Meeting on Severe Accident Research -ERMSAR-2017; 2017 May 16 - 18; Warsaw, Poland: National Centre for Nuclear Research. 2017.
- Freitag M. Comparison report for commissioning test of the two vessel configuration test TH-27. Eschborn: Becker Technologies GmbH; 2016. ( Comparison Report; no. 1501455-VB/CR-TH27).
- Chatelard P, Belon S, Bosland L, et al. Main modelling features of the ASTEC V2.1 major version. Ann Nucl Energy. 2016;93:83–93. https://doi.org/https://doi.org/10.1016/j.anucene.2015.12.026
- Povilaitis M, Urbonavičius E, Rimkevičius S. Validation of special nodalisation features for lumped-parameter injection modelling based on MISTRA facility tests from ISP-47 and SARNET. Nucl Eng Des. 2014;278:86–96. doi:https://doi.org/10.1016/j.nucengdes.2014.07.011. http:// linkinghub.elsevier.com/retrieve/pii/S0029549314004087
- Schwarz S. Simulation of free jets and buoyant plumes. Paper presented at: COCOSYS User Forum; 2004 July 15; GRS; Berlin (Germany).