
 ?Mathematical formulae have been encoded as MathML and are displayed in this HTML version using MathJax in order to improve their display. Uncheck the box to turn MathJax off. This feature requires Javascript. Click on a formula to zoom.
ABSTRACT
Sensitivity analysis and uncertainty quantification using Wilks’ formula and Monte Carlo for Unprotected Loss of Flow (ULOF) and Unprotected Transient OverPower (UTOP) accidents of prototype Gen-IV sodium-cooled fast reactor were performed. Multi-dimensional analysis for reactor safety for liquid metal reactors code calculations were conducted while simultaneously varying the values of all uncertain parameters according to their distribution using parallel computing platform integrated for uncertainty and sensitivity analysis to obtain uncertainty bands for Figures of Merit (FOM) – coolant, fuel centerline, and cladding temperature at the hottest fuel rod. To specify the uncertainty range of the parameters for each accident scenario, literature survey and expert judgments were consulted. By the sensitivity analysis, the importance ranking of 25 parameters in model identification and ranking table based on phenomena identification and ranking table was identified. Through Monte Carlo calculation, 95% upper limit and 95% confidence level were obtained, and about 2% and 5% under-prediction (risk) of FOM of ULOF and UTOP accidents using Wilks’ formula were confirmed, respectively.
1. Introduction
The safety requirements and licensing of commercial nuclear power plants have been based on a conservative approach since nuclear safety regulations have been developed by U.S. Nuclear Regulatory Commission (USNRC) 10 CFR [Citation1–3]. However, by the 1980s, the large database of experimental and analytical research related to the conservative approach of safety analysis was somewhat misdirected and sometimes even gave non-conservative results [Citation4]. Therefore, by the 1990s, the Code Scaling Applicability and Uncertainty (CSAU) and Phenomena Identification and Ranking Table (PIRT) methodology started to be used to obtain the safety analysis based on the Best Estimate plus Uncertainty (BEPU). Since the 1990s, safety analysis using conservative methods or the BEPU approach has been optionally utilized in the licensing process for nuclear power plants [Citation4,Citation5]. In South Korea, those approaches have also been applied to safety analysis for licensing regarding Large Break Loss of Coolant Accident (LBLOCA) since the 2000s [Citation6].
Several uncertainty methods have been developed to estimate safety margins to justify reactor operation. Within the uncertainty methods considered, uncertainties are evaluated using either CSAU and Gesellschaft fur Anlagen-und Reaktorsicherheit (GRS) methods through uncertainty methods study or Uncertainty Methodology on Accuracy Extrapolation (UMAE), Code with Internal Assessment of Uncertainty (CIAU) through the best estimate methods – uncertainty and sensitivity evaluation program, and so on [Citation5,Citation7–10]. In the CSAU and GRS approaches, the results of propagation of input parameters with specified ranges are considered to determine the uncertainty for accident scenarios of nuclear power plants. In the UMAE and CIAU approaches, uncertainty is obtained by comparing calculation results with significant experimental data.
CSAU was used for application to small break loss of coolant accident and LBLOCA of Pressurized Water Reactor (PWR) using best estimate codes like RELAP5/MOD3, Transient Reactor Analysis Code, and so on [Citation11,Citation12]. Also, CSAU was referred to another methodology to calculate LBLOCA of PWR [Citation13].
A tolerance limit evaluation approach, which is GRS, Wilks’ formula has been widely used to determine the number of calculations from a limited number of code simulations to obtain the uncertainty bands [Citation14]. Wilks’ formula consists of the number of code runs, tolerance, and confidence level. For example, 59, 93, and 124 samples are required in the case of the first, second, and third Wilks’ formula, respectively [Citation15–17].
In the case of Gen-IV reactors, the statistical estimation of uncertainty for super-safe, small, and simple (4S) reactor was performed [Citation18]. Through seven steps, the statistical analyses were conducted in order to estimate the effect of the uncertainties in the sensitive parameters on the major metrics in ULOF and UTOP accidents.
In this research, the CSAU and GRS approaches were used for the uncertainty quantification of the Prototype Gen-IV Sodium-cooled Fast Reactor (PGSFR).
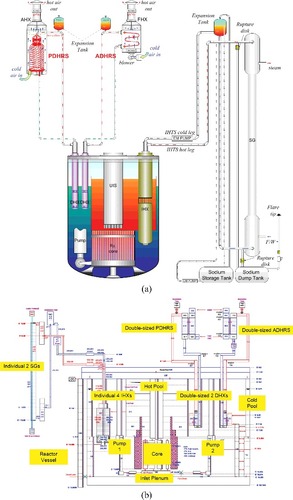
The schematic and nodalization of PGSFR, which is a 150 MWe pool-type Sodium-cooled Fast Reactor (SFR) using U–TRU–Zr metal fuel, are being designed by Korea Atomic Energy Research Institute (KAERI) as shown in [Citation19]. The heat transport systems of the PGSFR consist of the primary heat transport system, intermediate heat transport system with four Intermediate Heat Exchangers (IHX), two system generators, and a power conversion system. The Decay Heat Removal Systems (DHRS) of the PGSFR comprise the Active Decay Heat Removal Systems (ADHRS) and Passive Decay Heat Removal Systems (PDHRS).
Figure 1. Schematic of PGSFR.
Sensitivity analyses and uncertainty quantification for Unprotected Loss of Flow (ULOF) and Unprotected Transient over Power (UTOP) were carried out using Monte Carlo (MC) and compared with the 95% confidence level determined by Wilks’ formula using Multi-dimensional Analysis for Reactor Safety (MARS) for Liquid Metal Reactors, MARS-LMR [Citation20,Citation21].
2. Procedure of statistical process of PGSFR
The statistical process comprised the following steps prior to the sensitivity analysis and uncertainty quantification.
2.1. Specification of scenario
There are several design extension condition (DEC) events of the PGSFR, such as ULOF, UTOP, unprotected loss of heat sink, large partial subassembly blockage, large steam generator tube rupture, large sodium leak, station black out, and so on. Based on PIRT for DEC scenarios and expert discussion, ULOF and UTOP accidents were selected as accident scenarios of the PGSFR.
ULOF is initiated by the loss of core cooling capability due to pumping failure of the primary pumps. When pumping failure occurs, the reactor coolant circulation is stopped by the active equipment after the period of pump coastdown. Instead, natural convection due to the difference in the density generated by temperature gradients between the core and the coolant occurs. UTOP is initiated by a possible malfunction of the reactivity controller due to withdrawal of the control rods, and the core power is rapidly increased by a positive reactivity insertion [Citation19]. This research was assumed to be initiated by reactivity insertion (0.3$) due to control rod withdrawal.
2.2. Figures of merit (FOM)
To ensure the safety of SFR, phase change of sodium is very important. Therefore, the thermal margin of vaporization for coolant temperature at the hottest fuel rod was selected as Figures of Merit (FOM) of PGSFR. The fuel centerline and cladding temperature were also included as an aspect to the safety of fuel. Because the consideration for the fuel centerline, cladding, and coolant temperature is not limited to certain scenario, those can be applied to both ULOF and UTOP accidents.
2.3. Selection of physical models and uncertainty range related to phenomena
PIRT was set up to identify and list important phenomena as shown in [Citation22]. PIRT contains phenomena, importance of phenomena, and the knowledge level for each scenario. As shown in , L, M, H mean low, medium, and high, respectively. When any of the information for physical models is not available from an experimental database or when it is lacking, expert judgment should be considered [Citation8]. Based on the PIRT, Model Identification and Ranking Table (MIRT) of ULOF and UTOP accidents of PGSFR were also developed as shown in and [Citation23]. The phenomena and related model can be divided into four categories based on MIRT. The first category is related to reactor core such as fuel rod heat transfer, reactivity feedbacks, and core pressure drop. The second category includes primary pumps and heat transfer of the internal structure. The primary pumps work under transient conditions during UTOP accident, unlike the case of ULOF accident. Therefore, in the case of UTOP accident, only pump heat generation is considered. However, reactivity insertion is additionally considered during UTOP accident. The third category includes heat transfer of the shell and tube-side in IHX and pressure drop. The final category considers heat transfer of steam generators. The uncertainty band related to the reactivity model such as sodium density, reactivity insertion, core radial and fuel axial expansion reactivity coefficient, control and shutdown rod worth, and Doppler effect are based on the BFS-73-1 critical experiment at the BFS-1 facility at the Institute of Physics and Power Engineering in Russia [Citation24]. The modified-Schad and Aoki correlations are used as the heat transfer model of the core and tube-side including the primary loop [Citation25,Citation26]. The heat transfer model of the shell-side of heat exchanger is Graber–Reiger correlation [Citation27]. The uncertainty band of the fuel thermal conductivity is from the SCDAP/RELAP5/MOD3.3 code manual [Citation28]. The pressure drop of the core is the simplified Cheng and Todreas model [Citation29,Citation30]. The uncertainty bands of the wall roughness of IHX shell-side and spacer grid form loss are determined from Organisation for Economic Co-operation and Development (OECD) report [Citation31]. Except for the uncertainty bands from literature survey, those of other parameters are based on expert judgment.
Table 1. Phenomena identification and ranking table (PIRT)
Table 2. Model identification and ranking table (MIRT) of ULOF accident
Table 3. Model identification and ranking table (MIRT) of UTOP accident
3. Sensitivity analysis
3.1. Relative sensitivity coefficient
The sensitivity analysis considered 25 uncertain parameters, as shown in and . The results of the sensitivity analysis indicate the magnitude of the relative sensitivity coefficient (Sr), which is defined as(1)
(1) where r0 and p0 indicate each FOM value and each uncertain parameter for the nominal case, respectively. Here, 0 means the original value before the uncertainty range is applied. When the relative sensitivity coefficient has a positive sign, the perturbed values of the input parameters and the simulation results have the same direction, i.e. an increase of the values of uncertainty tends to increase the FOM and vice versa. Therefore, the parameter having the higher value of relative sensitivity coefficient has the more influence to change the FOM.
3.2. ULOF
shows the relative sensitivity coefficient of FOM for 25 parameters in ULOF accident. The minimum and maximum values of the relative sensitivity coefficient mean the results applying to the minimum and maximum uncertainty values, respectively. The dominant parameters are the Above Core Load Pad (ACLP) strain coefficient (M5), core radial expansion reactivity coefficient (M6), and pump coastdown curve (M16) as an aspect to the magnitude of the relative sensitivity coefficient. The most dominant parameter having the largest absolute value is M16 as a cause of ULOF accident.
3.3. UTOP
also indicates the relative sensitivity coefficient of FOM for 25 parameters in UTOP accident. The dominant parameters, the ACLP strain coefficient (M6 in ) and core radial expansion reactivity coefficient (M7 in ) are common to ULOF accident. The most dominant parameter of UTOP accident is reactivity insertion (M3) compared to other parameters.
4. Uncertainty quantification method
Server and client PC systems with the aid of the Parallel computing Platform IntegRated for Uncertainty and Sensitivity analysis (PAPIRUS) [Citation32] were an environment for the MC calculation. The calculations were performed with 18 client PCs (3.50 GHz i7 CPU, Window 7), and 3000 input files with random sampling were generated using the PAPIRUS. The values of the input parameters were simultaneously varied by random sampling according to probability density functions. MC calculations were performed two times for each accident scenario considering all uncertain parameters. The calculation times for ULOF and UTOP accidents were about seven and ten days, respectively.
4.1. ULOF
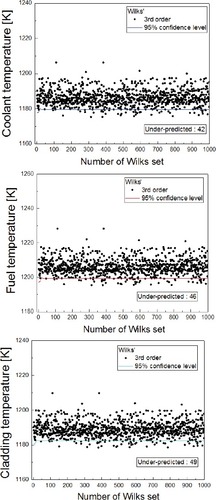
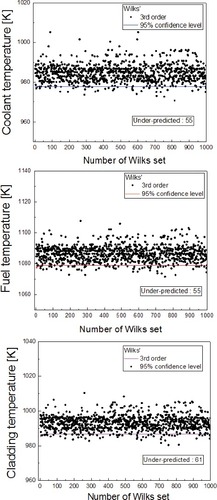
compares the FOM distributions of the nominal case and those obtained by uncertainty methods, using MC and Wilks’ formula. The results using MC method were obtained from 3000 input files having different perturbed values for each parameter in MIRT. Among the results from 3000 input files, 151st as a maximum value and 2899th as a minimum value of FOM are the 95% confidence level for every time-step as shown in . In this case, it used the value of third Wilks’ formula. The primary pump failure occurred at 10 s and after 5 s, DHRS were operated. Therefore, the fuel centerline, cladding, and coolant temperature increase because of loss of primary flow. After 40 s, the temperature decreases because of the operation of ADHRS and PDHRS and negative reactivity feedbacks. The saturation temperature of sodium was calculated by MARS-LMR. In this paper, only minimum saturation temperature was used to calculate the thermal margin. The criteria for the fuel and cladding temperature were obtained from SFR reactor design division of KAERI. It confirmed that the value of the Wilks’ formula was higher than that obtained by MC calculation, and each maximum FOM value was lower than the minimum saturation temperature although the difference was very small. shows the trends of the 95% upper limit of FOM during MC histories of ULOF and UTOP accidents. For example, the first data-points of this figure (number of MC histories = 100) show a 95% upper limit from 1st to 100th cases, and the second data-points (number of MC histories = 200) show the 95% upper limit value up to 200th case and so on. After the 2000th case, it was confirmed that the 95% upper limit of FOM converged on a certain value. only includes values of the third-order obtained using the Wilks’ formula. Each point means the third maximum value among 124 samples (=input files) having different perturbations of parameters. The calculation results obtained by Wilks’ formula compared with the MC for ULOF accident indicate having 2% under-prediction value, as shown in . Each value in means the number of lower values of FOM calculated by the first, second, and third Wilks’ formula compared to the MC calculation. The number of lower values calculated by the third Wilks’ formula also can be confirmed as shown in . The Wilks’ formula predicts the lower maximum value of each FOM and therefore, the thermal margin will be increased in the case of getting 2% under-predicted value of FOM compared to other cases. The results are not good as an aspect to the safety of PGSFR.
Figure 2. Comparison of FOM distribution between the nominal case and uncertainty quantification methods in ULOF accident.
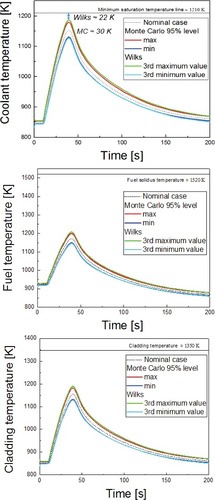
Figure 3. Trends of 95% upper limit of FOM during Monte Carlo histories in (a) ULOF and (b) UTOP accident.
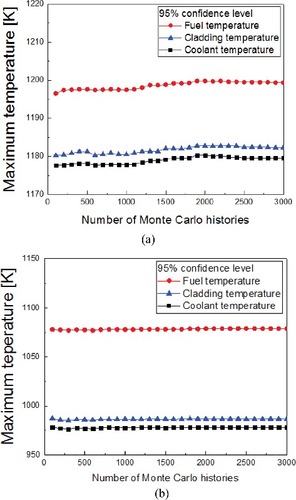
Figure 4. Comparison of 95% upper FOM with value of third-order Wilks’ formula in ULOF accident.
4.2. UTOP
The FOM of UTOP accident have a different temperature range compared to that of ULOF accident. The thermal margin is bigger than that of ULOF accident, as shown in . Because of the insertion of positive reactivity at 10 s, and after 5 s, DHRS are operated, those of FOM increase but, the primary pumps still operate. Therefore, the maximum values of FOM of UTOP accident are lower than those of ULOF accident. compares the maximum FOM obtained by MC calculation and Wilks’ formula considering all parameters in MIRT. compares the 95% upper FOM with the values obtained by third-order Wilks’ formula. The calculation results using first, second, and third-order Wilks’ formula for UTOP accident indicate about maximum 5% under-prediction as an aspect of the thermal margin, as shown in .
Figure 5. Trends of 95% upper limit of FOM during Monte Carlo histories in UTOP accident.
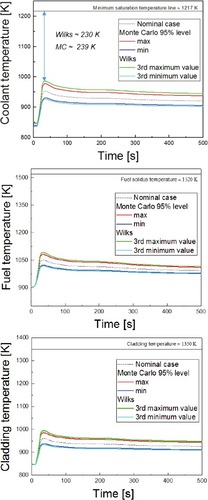
Table 4. Comparison of maximum temperature between Monte Carlo and Wilks’ formula of ULOF and UTOP accident
Table 5. Number of Wilks’ formula cases with under-predicted 95th percentile FOM of ULOF and UTOP accident
Figure 6. Comparison of 95% upper FOM with value of third-order Wilks’ formula in UTOP accident.
5. Conclusion
Sensitivity analyses and uncertainty quantification for ULOF and UTOP accidents of the PGSFR were carried out by MC calculation, and the results were compared with FOM determined by the Wilks’ formula using the PAPIRUS. Before the sensitivity analyses and uncertainty quantification were carried out, the accident scenarios, FOM, and uncertain parameters of each accident based on PIRT and MIRT were selected. The total number of PCs including the server was 19, and about 80 cores were used during the MC calculation. The sensitivity analysis confirmed the ranking of parameters, and the dominant parameters were identified for each accident scenario. In ULOF and UTOP accidents, the most dominant parameters causing each type of accident were the pump coastdown curve (M16) and reactivity insertion (M3), respectively. In the MC calculation, 3000 cases with random sampling were considered. Based on the comparison of the 95% upper limit of MC and the 95% confidence level of Wilks’ formula, the under-predicted results obtained by third Wilks’ formula indicated about 2% and 5% risk as an aspect of the thermal margin in ULOF and UTOP accidents, respectively. Therefore, the MC calculation can provide a reliable 95% limit value if users have sufficient computational capability or time. These results can be applied as a reference in designing the PGSFR.
Acknowledgments
This research was supported by the National Research Foundation of Korea (NRF) grant funded by the Korea government (Ministry of Science and ICT) [grant number NRF-2015M2A8A4046778], [grant number NRF-2017M2B2B1072555].
Disclosure statement
No potential conflict of interest was reported by the authors.
| Nomenclature | ||
| ACLP | = | Above Core Load Pad |
| ADHRS | = | Active Decay Heat Removal Systems |
| BEMUSE | = | Best Estimate Methods – Uncertainty and Sensitivity Evaluation |
| BEPU | = | Best Estimate Plus Uncertainty |
| CIAU | = | Code with Internal Assessment of Uncertainty |
| CRDL | = | Control Rod Driving Line |
| CSAU | = | Code Scaling Applicability and Uncertainty |
| DEC | = | Design Extension Condition |
| DHRS | = | Decay Heat Removal Systems |
| FOM | = | Figures of Merit |
| GP | = | Grid Plate |
| GRS | = | Gesellschaft fur Anlagen-und Reaktorsicherheit |
| IHTS | = | Intermediate Heat Transport Systems |
| IHX | = | Intermediate Heat Exchangers |
| IPPE | = | Institute of Physics and Power Engineering |
| MIRT | = | Model Identification and Ranking Table |
| LBLOCA | = | Large Break Loss of Coolant Accident |
| PAPIRUS | = | PArallel computing Platform IntegRated for Uncertainty and Sensitivity analysis |
| PDFs | = | Probability Density Functions |
| PGSFR | = | Prototype Gen-IV Sodium-cooled Fast Reactor |
| PHTS | = | Primary Heat Transfer Systems |
| PIRT | = | Phenomena Identification and Ranking Table |
| RV | = | Reactor Vessel |
| SBLOCA | = | Small Break Loss of Coolant Accident |
| SBO | = | Station Black Out |
| SFR | = | Sodium-cooled Fast Reactor |
| SG | = | Steam Generator |
| SGS | = | Steam Generator Systems |
| SGTR | = | Steam Generator Tube Rupture |
| TRAC | = | Transient Reactor Analysis Code |
| ULOF | = | Unprotected Loss of Flow |
| ULOHS | = | Unprotected Loss of Heat Sink |
| UMAE | = | Uncertainty Methodology on Accuracy Extrapolation |
| UMS | = | Uncertainty Methods Study |
| UTOP | = | Unprotected Transient OverPower |
Additional information
Funding
References
- U.S. Nuclear Regulatory Commission. USNRC CFR Title 10, U.S., USNRC. 2011;1. Section 1.11, Protect public health and safety.
- U.S. Nuclear Regulatory Commission. USNRC CFR Title 10, U.S., USNRC. 2011. Part 50, Domestic licensing of production and utilization facilities.
- U.S. Nuclear Regulatory Commission. USNRC 10 CFR Title 10, U.S., USNRC. 2011. Part 100, Reactor site criteria.
- Wilson GE. Historical insights in the development of best estimate plus uncertainty safety analysis. Ann Nucl Energy. 2013;52:2–9.
- Perez M, Reventos F, Batet L, et al. Uncertainty and sensitivity analysis of a LBLOCA in a PWR nuclear powr plant: results of the phase V of the BEMUSE programme. Nucl Eng Des. 2011;241:4206–4222.
- Young SB, Byung-Gil H, Ae-ju C, et al. Experience in KINS on best estimate calculation with uncertainty evaluation, Paris, Francer: Nuclear Energy Agency; 2013. ( Report no. NEA/CSNI/R(2013)8/PART2).
- D'Auria F, Bousbia-Salah A, Petruzzi A, et al. State of the art in using best estimate calculation tools in nuclear technology. Nucl Eng Technol. 2006;38:11–31.
- Glaeser H. GRS analysis for CSNI uncertainty methods study (UMS), Paris, France: Nuclear Energy Agency; 1998. ( Report no. OECD NEA/CSNI/R(97)35 Vol. 1).
- Glaeser H. GRS method for uncertainty and sensitivity evaluation of code results and applications. Sci Technol Nucl Ins. 2008;2008:1–7. Article ID 798901.
- Glaeser H, Nuclear Energy Agency. Summary of existing uncertainty methods. OECD/CSNI Workshop on Best Estimate Methods and Uncertainty Evaluations; 17 Dec. 2013; Paris, France.
- Ortiz MG, Ghan LS. Uncertainty analysis of minimum vessel liquid inventory during a small-break LOCA in a B&W plant – an application of the CSAU methodology using the RELAP5/MOD3 computer code, Idaho Falls, U.S.: Idaho National Engineering Laboratory; 1992. ( Report no. NUREG/CR-5818, EGG-2665).
- Boyack BE. Quantifying reactor safety margins part 1: an overview of the code scaling, applicability, and uncertainty evaluation methodology. Nucl Eng Des. 1990;119:1–15.
- Kwang-Won S, Dong Gu K, Byung Gil H, et al. Audit calculations of LBLOCA for Ulchin unit 1,2 power uprate, Daejeon, Republic of Korea: Korea Institute of Nuclear Safety; 2013. ( Report no. KINS/RR-1043).
- In SH, Deog YO, In GK. Generic application of Wilks’ tolerance limit evaluation approach to nuclear safety, Paris, France: Nuclear Energy Agency; 2013. ( Report no. NEA/CSNI/R(2013)8/PART2).
- Wilks SS. Determination of sample sizes for setting tolerance limits. Ann Math Stat. 1941;12:91–96.
- Wilks SS. Statistical prediction with special reference to the problem of tolerance limits. Ann Math Stat. 1942;13:400–409.
- Seung WL, Bub DC, Young-Seok B, et al. Analysis of uncertainty quantification method by comparing Monte-Carlo method and Wilks’ formula. Nucl Eng Technol. 2014;46:481–488.
- Horie H, Miyagi K, Nakahara K, et al. Safety performance of the 4S reactor on the ATWS events – statistical estimation of uncertainty. Prog Nucl Energy. 2008;50:179–184.
- Chiwoong C, Kwiseok H, Hae-Yong J. Analyses of UTOP events for the design of control rod stop system in PGSFR using MARS-LMR. Ann Nucl Energy. 2016;96:422–431.
- Bub-Dong C, Jae-Jun J, Moon-Kyu H, Won Jae L, Young Jin L, Seung Wook L, Kyung-Doo K, Sung-won B. MARS code manual volume IV: Developmental Assessment Report. Daejeon, Republic of Korea: Korea Atomic Energy Research Institute; 2009. ( Report no. KAERI/TR-3042/2005).
- Kwi-Seok H, Hae-Young J, Young-Min K, et al. Liquid metal properties using a soft-sphere model. Proceeding of Korean Nuclear Society; 2006 May 25–26; Chuncheon(Republic of Korea).
- Seok JK, Jae SS, Doo HK. PIRT support and best-estimate MARS-LMR input development for SFR, Daejeon, Republic of Korea: Korea Atomic Energy Research Institute; 2016. ( Report no. KAERI/TR-6468/2016).
- Jaeseok H, Sarah K, Sung WB, et al. Uncertainty and sensitivity analysis for PGSFR under DEC scenario, Daejeon, Republic of Korea: Korea Atomic Energy Research Institute; 2016. ( Report no. KAERI/TR-6467/2016).
- Hoon S, Young-In K, Sang-Ji K, et al. Analysis of BFS-73-1 experiment, Daejeon, Republic of Korea: Korea Atomic Energy Research Institute; 1998. ( Report no. KAERI/TR-1133/98).
- Kazimi MS, Carelli MD. Heat transfer correlation for analysis of CRBRP assemblies. Westinghouse Electric Corporation; 1976. ( Report no. CRBRP-ARD-0034).
- Aoki S. Current liquid-metal heat transfer research in Japan. Prog Heat Mass Transfer. 1973;7:569–587.
- Graber H, Rieger M. Experimental study of heat transfer to liquid metals flowing in-line through tube bundles. Prog Heat Mass Transfer. 1973;7:151–166.
- Siefken LJ, Coryell EW, Harvego EA, et al. SCDAP/RELAP5/MOD3.3 code manual, Idaho Falls, U.S.: Idaho National Engineering and Environmental Laboratory; 2001. ( Report no. NUREG/CR-6150, Vol. 4, Rev. 2).
- Cheng SK, Todreas NE. Hydrodynamic models and correlations for bare and wire-wrapped hexagonal rod bundles – bundle friction factors, subchannel friction factors and mixing parameters. Nucl Eng Des. 1986;92:227–251.
- Chen SK, Todreas NE, Nguyen NT. Evaluation of existing correlations for the prediction of pressure drop in wire-wrapped hexagonal array pin bundles. Nucl Eng Des. 2014;267:109–131.
- Glaeser H, Hofer E, Kloos M, et al. Report of the uncertainty methods study for advanced best estimate thermal hydraulic code applications, Paris, France: Nuclear Energy Agency; 1998, (Report no. OECD NEA/CSNI/R(97)35 Vol. 2).
- Jaeseok H, Kyung DK. PAPIRUS, a parallel computing framework for sensitivity analysis, uncertainty propagation, and estimation of parameter distribution. Nucl Eng Des. 2015;292:237–247.