
 ?Mathematical formulae have been encoded as MathML and are displayed in this HTML version using MathJax in order to improve their display. Uncheck the box to turn MathJax off. This feature requires Javascript. Click on a formula to zoom.
ABSTRACT
A function to give the total neutron production cross section, angular distribution, and energy spectrum via the 9Be + p reaction has been created by fitting experimental data to characterize compact neutron sources with thick Be targets bombarded by protons with energy below 12 MeV. To examine the suitability of the function, calculations of the angle-dependent neutron energy spectra produced in thick Be targets with 4- and 12-MeV protons using the function were compared with corresponding experiments and calculations using the nuclear data libraries of ENDF/B-VII.0 and JENDL4.0/HE. The function was in better agreement with the experiments than the calculations using the libraries except for at backward angles. The 115In(n,n’)115mIn reaction rates calculated using GEANT4 with source neutrons given by both the function and ENDF/B-VII.0 were compared with that measured at the RIKEN Accelerator-Driven Compact Neutron Source to evaluate the neutron spectrum above 1 MeV. The function slightly overestimated the measurement by 14% and the calculation with ENDF/B-VII.0 underestimated by 35%. It was concluded that the function can be applied in compact neutron source designs.
1. Introduction
Neutrons are utilized for various applications such as in condensed-matter science and nondestructive inspection, owing to their wide energy range from cold to fast neutrons. To meet the increasing demand for neutron use for above applications, the RIKEN Accelerator-Driven Compact Neutron Source (RANS) [Citation1,Citation2] has been constructed and is in operation since 2013. At RANS, neutrons with energy less than about 5 MeV are generated by injecting protons with energy of 7 MeV into a 300-μm-thick beryllium (Be) target.
Neutron source characteristics, such as the neutron yield, angular distribution, and energy spectrum in the 9Be + p reaction (p–Be) with a thick Be target, are essential information for any experiment using not only RANS but also other compact neutron sources employing the same reaction. In particular, the neutron flux spectrum is the key information for the source characteristics in all experiments.
To simulate the neutron spectrum of p–Be, several codes such as MCNP [Citation3], PHITS [Citation4], and GEANT4 [Citation5] have been used [Citation6–8]. However, they are not necessarily suitable for reproducing the experimental data for p–Be at low energies such as less than 20 MeV [Citation9]. This is because the available physical models, such as the intranuclear cascade model [Citation10,Citation11], implemented in the simulation codes focus on high-energy particles. For low-energy protons, nuclear data libraries such as ENDF [Citation12], JENDL [Citation13], and TENDL [Citation14] have been used with these simulation codes. However, there are differences among the simulated results using different nuclear data libraries [Citation15].
When RANS was designed, the source neutron [Citation16,Citation17] of p–Be was obtained by interpolating the existing neutron spectrum of 11 MeV obtained experimentally [Citation9] because there were no appropriate experimental data or reliable nuclear data for a thick Be target with 7-MeV proton injection. However, this treatment for the source determination includes an uncertainty owing to the interpolation as well as the omission of relevant reaction data.
To provide a more reliable neutron source characteristic for RANS, we have newly derived a function for neutron production based on available experimental data that is dedicated to the p–Be reaction with thin Be targets [Citation7,Citation18–22], and we implemented this function in the GEANT4 code to model the source neutron. The calculated neutron energy spectra (ECS) at several angles from thick Be targets with 4- and 12-MeV protons were compared with those of ENDF and JENDL and the experimental data [Citation8,Citation23]. In addition, to examine the feasibility of the function, a comparison was performed for the 115In(n,n’)115mIn reaction rate, which has relatively flat responses [Citation13] to neutrons above 1 MeV; the reaction rate was measured at a position near the RANS neutron target by the activation method. The measured reaction rate was compared with that calculated by the GEANT code with the ENDF nuclear data library, which modeled structures of RANS components including its target, moderator, shielding, and neutron beam line.
In this paper, we describe the derivation of the function and the results of its evaluation through comparisons of ECS at several angles with existing experimental data [Citation8,Citation23] along with nuclear data libraries. In addition, the comparison was described for the 115In(n,n’)115mIn reaction rate measured at a position close to the RANS target.
2. Method
2.1. Outline
To derive the function for neutron production by the 9Be + p reaction, the experimental data for the case of using thin Be targets [Citation7,Citation18–22] were obtained from the EXFOR [Citation24] and ENSDF [Citation25] databases. These incident proton energies (Ep) were between 2.3 and 18 MeV. For a thin-target experiment, the total cross section (TCS) (σ(Ep)) at a certain Ep is represented as
where dσ, Ω, and En are the differential cross section, solid angle, and neutron energy, respectively. According to this (definition) equation for the TCS, the angular distribution for the reaction angle (θ) in the 9Be + p reaction should be a function of Ep, and also the ECS should be a function of Ep and θ considering the kinematics and the reaction Q-value. The total neutron yields for thick-target experiments (TTY) are obtained by integrating those of thin-target experiments, that is,
, where Epi is the initial proton energy and Epf is the final proton energy after passing through the target. From this definition, we adopt three functional forms for the TCS, angular distribution, and energy spectrum as described in detail in the following sections.
2.2. Total cross section
First, the TCSs of neutron production in units of mb are fitted up to Ep = 12 MeV by the formula(1)
(1) where [a]–[d] are constants. The fitted result and parameters are shown in and the Appendix, respectively.
Figure 1. Total cross section of neutron production by p–Be. Dots are the available experimental data [Citation18,Citation19]. The solid line was obtained using the function.
![Figure 1. Total cross section of neutron production by p–Be. Dots are the available experimental data [Citation18,Citation19]. The solid line was obtained using the function.](/cms/asset/15605058-d0e4-4f2b-bc61-ab01e7b20870/tnst_a_1445566_f0001_oc.jpg)
2.3. Angular distribution
As the second step, the angular distributions (ACS(θCM)) in units of mb/sr at the center of mass of the system were derived by fitting experimental data as shown in , using the Legendre polynomial expanded up to the third order.(2)
(2) where [e]–[h] are fitting parameters obtained by interpolating between Ep = 2.56 and 18 MeV as a function of Ep, and C is a correction factor used to obtain TCS(Ep) by integrating ACS(θCM) between 0° and 180°. Along with the experimental data, the results obtained using our function and each parameter are depicted in and the Appendix, respectively.
Figure 2. Angular distribution. Dots are the available experimental data [Citation7,Citation20–22]. The solid line was obtained using the function.
![Figure 2. Angular distribution. Dots are the available experimental data [Citation7,Citation20–22]. The solid line was obtained using the function.](/cms/asset/7fac2d69-87be-43f3-9c4d-0bab0e34d833/tnst_a_1445566_f0002_oc.jpg)
2.4. Neutron energy spectrum
Third, the ECS in units of mb/sr/MeV in the laboratory system were obtained by fitting experimental data by employing a formula consisting of a continuum part and peaks of transitions from the excited states in 10B to the ground and first two excited states in 9B, as follows:
(3)
(3) where [i]–[v] are fitting parameters, which are functions of Ep, used to reproduce the energy spectrum and En is the neutron energy. This function uses the maximum outgoing neutron energy (EnMax) from the kinematic relationship between Ep and θ considering the Q-value of the 9Be + p reaction. Parameters of [o, r, u] have physical meanings of the outgoing neutron energy and are determined from kinematic relationship of 9Be(p,n)9B and the ground, the first and second excited states in 9B. Parameters of [p, s, v] have also physical meanings of the level widths in 9B. This function was produced so as to reproduce the area of each peak. The results of ECS(En) are shown in . Each parameter is given in the Appendix. These parameters except for [p], [s], and [v] are also functions of Ep.
Figure 3. Energy spectrum. Dots are the available experimental data [Citation21]. The solid line was obtained using the function.
![Figure 3. Energy spectrum. Dots are the available experimental data [Citation21]. The solid line was obtained using the function.](/cms/asset/4409b667-8fe0-47b9-acd1-43759f2cc1ca/tnst_a_1445566_f0003_oc.jpg)
As the result of the above steps, we obtained a function that gives the TCS, angular distribution, and ECS via p–Be at certain Ep and θ. We refer to this original function simply as ‘the function’ in the following sections.
To derive the neutron production with a certain thick target, a computer program with a Monte Carlo calculation was developed by incorporating the function and the energy loss in the target material calculated by the SRIM code [Citation26]. The program requires only Ep and the target thickness as input parameters. The calculation was carried out using the C++ programming language and the ROOT framework [Citation27]. In the following sections, the neutron source term obtained using this program with the function is referred as the function source (FS).
The calculation considering the secondary reaction caused by the produced neutrons via the function such as elastic scattering with the Be target and other substances is carried out by implementing the function in a Monte Carlo simulation code such as GEANT4 [Citation5], which includes the data set G4NDL4.2 (mainly ENDF/B-VI). These calculations are referred as calculation by the function (CF) in the following sections.
3. Results
3.1. First step
To evaluate the performance of the FS, the angular ECS at 0°, 20°, 40°, 60°, 80°, 110°, and 140° produced via p–Be with a thick Be target were calculated and compared with experimental data [Citation23] with Ep = 4 MeV and a 0.5-mm-thick Be target. The comparison is shown in . The ECS of the FS are in good agreement with the experimental data up to the maximum energy at all angles except below about 0.5 MeV. The discrepancy increases as the energy approaches 0 MeV and for backward angles. Because there were no experimental data points at neutron energies lower than about 1.5 MeV in the experiments [Citation7,Citation21] with Ep = 6.3, 7.4, and 10 MeV with thin Be targets for fitting, we did not treat properly zero neutron production at zero neutron energy. Thus, the FS deviated from the experimental data at neutron energies of less than about 0.5 MeV. Since the behavior of the FS is unusual, a term to reduce the deviation is introduced in the next section.
Figure 4. Results of the calculation using our function for the neutron energy spectra at angles of 0°, 20°, 40°, 60°, 80°, 110°, and 140° under the condition of Ep = 4 MeV with a 0.5-mm-thick Be target. Solid lines are the calculations using the FS. Dots are existing data [Citation23].
![Figure 4. Results of the calculation using our function for the neutron energy spectra at angles of 0°, 20°, 40°, 60°, 80°, 110°, and 140° under the condition of Ep = 4 MeV with a 0.5-mm-thick Be target. Solid lines are the calculations using the FS. Dots are existing data [Citation23].](/cms/asset/918118bb-5631-41d5-bebe-dfe5b7a24b8f/tnst_a_1445566_f0004_b.gif)
3.2. Second step
In the first step, we found abnormal values near zero energy in the angular spectra obtained by the FS. Thus, a term was introduced to reduce the deviation from the experimental data for a thick Be target at low energies of less than about 0.5 MeV as shown in , which was added to EquationEquation (3)(3)
(3) for the ECS in Section 2.4. The added term was
This term was multiplied by the continuum part of the ECS in Section 2.4 to give
(4)
(4)
The results of the FS after adding C1 are shown in as thick lines with the same experimental data [Citation23] as used in , along with the results of a calculation by PHITS ver. 2.820 using the nuclear data libraries of ENDF/B-VII.0 and JENDL4.0/HE, indicated by dashed lines and thin solid lines, respectively. As can be seen from the results for the FS, the deviation has been resolved at low energies of less than 0.5 MeV for forward angles, although the spectra for backward angles are not yet resolved and the FS tends to overestimate the spectra at energies of less than about 1 MeV. Because the total neutron production is maintained even when C1 is added, the overestimation of the spectra has not yet been resolved. Therefore, we need more experimental data to resolve the deviation.
Figure 5. Results of the calculation using our function for the neutron energy spectra at angles of 0°, 20°, 40°, 60°, 80°, 110°, and 140° under the condition of Ep = 4 MeV with a 0.5-mm-thick Be target. The thick solid lines show the calculations with the function. Dots are existing data [Citation23]. Dashed lines were obtained using ENDF/B-VII.0. Thin solid lines were obtained using JENDL4.0/HE.
![Figure 5. Results of the calculation using our function for the neutron energy spectra at angles of 0°, 20°, 40°, 60°, 80°, 110°, and 140° under the condition of Ep = 4 MeV with a 0.5-mm-thick Be target. The thick solid lines show the calculations with the function. Dots are existing data [Citation23]. Dashed lines were obtained using ENDF/B-VII.0. Thin solid lines were obtained using JENDL4.0/HE.](/cms/asset/9f0adffa-7e7f-4a01-a1cf-d3e1c51f6299/tnst_a_1445566_f0005_oc.jpg)
The calculations using ENDF/B-VII.0 tend to underestimate the yields below around 1 MeV except for 140°, for which the spectrum is in good agreement, and they tend to overestimate the yields above about 1 MeV at forward angles of 0°, 20°, and 40°. The calculations with JENDL4.0/HE tend to overestimate the yields above about 1 MeV at 0° and 20°, and tend to underestimate the yields at below about 0.5 MeV except for at 140°, for which the spectrum is in good agreement.
To validate the CF at higher incident proton energies, experimentally obtained ECS at angles of 0°, 15°, 30°, 60°, 90°, and 120° in the case of a thick target [Citation8] with Ep = 12 MeV and a 2-mm-thick Be target were compared with the results of the calculation using the CF, ENDF/B-VII.0, and JENDL4.0/HE as shown in . The CF well reproduced the experimental values at energies of above 1.5 MeV, although the CF overestimated the spectra at 0° and 15° and underestimated the spectrum at 120°. The calculation with ENDF tends to overestimate the spectra above energies of about 3 MeV except for at 120°. That with JENDL tends to underestimate the entire spectra except at 90°. Both the ENDF and JENDL calculations give lower yields than the CF below 1.5 MeV, similar to the results for the 4-MeV data shown in . Although a comparison could not be made for energies lower than 1.5 MeV owing to the lack of experimental data, the CF appears to more closely reproduce the spectra than ENDF and JENDL at 12 MeV.
Figure 6. Results of the calculations using our function, ENDF/B-VII.0, and JENDL4.0/HE for neutron energy spectra at angles of 0°, 15°, 30°, 60°, 90°, and 120° under the condition of Ep = 12 MeV with a 2-mm-thick Be target. Solid lines show the calculations using the function. Dots are recent experimental data [Citation8]. Dashed lines were obtained using ENDF/B-VII.0. Thin solid lines were obtained using JENDL4.0/HE.
![Figure 6. Results of the calculations using our function, ENDF/B-VII.0, and JENDL4.0/HE for neutron energy spectra at angles of 0°, 15°, 30°, 60°, 90°, and 120° under the condition of Ep = 12 MeV with a 2-mm-thick Be target. Solid lines show the calculations using the function. Dots are recent experimental data [Citation8]. Dashed lines were obtained using ENDF/B-VII.0. Thin solid lines were obtained using JENDL4.0/HE.](/cms/asset/c1d52e67-b21c-4964-9a0f-b9d0b5b00e75/tnst_a_1445566_f0006_oc.jpg)
According to these results, the function is effective for simulating the neutron spectrum produced by p–Be with a thick target in an accelerator-driven compact neutron source.
4. Comparison of the 115In(n,n’)115mIn reaction rate obtained using the function and by experiment
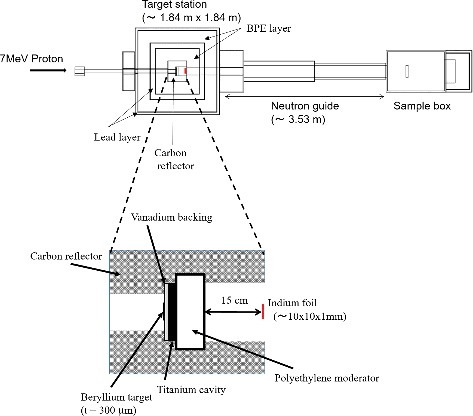
Since the 115In(n,n’)115mIn reaction rate, which is denoted as In5n, has a threshold energy of about 1 MeV and its cross section is relatively flat at fast neutron energies of more than 1 MeV [Citation13], we considered that this reaction is suitable for evaluating the neutron field at RANS, whose maximum neutron energy is about 5 MeV. Thus, we measured the reaction rate of In5n to compare it at energies of above 1 MeV with the results of the CF and the measurement at RANS [Citation1,Citation2,Citation9,Citation10]. RANS consists of a proton accelerator with energy of 7 MeV, a target station including a Be target system with shields of polyethylene with boron (BPE) and lead, a neutron guide, and a sample box as shown in (please see References [Citation1,Citation2,Citation9,Citation10] for details of RANS). An indium foil was placed 15 cm away from a 4-cm-thick polyethylene moderator downstream of the Be target as shown in . From this measurement, the reaction rate of In5n was obtained to be 2.55 ± 0.20 × 10⁻¹⁷ [1/s/100 μA], which was normalized by the proton beam current of 100 μA.
Figure 7. Schematic cross-sectional view of RANS downstream of the proton accelerator and enlarged view around the Be target.
The function was implemented in the Monte Carlo simulation code GEANT4 to model the p–Be source neutron (this method is the same as for the CF outlined in Section 2) for comparison with the reaction rate of In5n measured at RANS. The CF was applied to the modeled structures of RANS components including the target, moderator, shielding, and neutron guide, as shown in . The reactions such as elastic scattering and capture involved with these substances were calculated by using the data set of G4NDL4.2 (mainly ENDF/B-VI) in GEANT4. From the reaction rate of the CF, the C/E ratio of the reaction rates for the measurement and the CF was 1.14(7) as shown in . The CF well reproduced the measured reaction rate, although it overestimated it by 14%. (It is considered possible to increase the experimental reaction rate of In5n by optimizing the beam conditions of RANS. Then the C/E ratio may approach 1.)
Table 1. Comparison of the reaction rate of In5n. The C/E ratio is the calculated result divided by the experimental value
The reaction rate calculated with ENDF/B-VII.0 by GEANT4 was also compared with that measured under the same conditions as the CF. The C/E ratio was 0.65(4) as shown in . The calculation with ENDF/B-VII.0 underestimated the reaction rate by 35% and had a difference of about 50% from the results of the CF. It is clearly shown that the neutron yield below energies of about 1 MeV in the calculated neutron spectrum, shown in and for the results of ENDF, are smaller than those for the CF.
To compare the reaction rate with our original source neutron (denoted as OS) derived by interpolating the existing neutron spectra for Ep = 11 MeV [Citation9], as mentioned in Section 1, the calculated neutron flux spectra at a distance of 5 m from the moderator using the CF and OS are shown in .
Figure 8. Neutron flux spectra at a distance of 5 m from the moderator. The thick solid line indicates the spectrum obtained using the source neutron of CF. The thin solid line shows that obtained using our original source neutron [Citation16,Citation17]. The dotted line indicates the cross section of the 115In(n,n’)115mIn reaction.
![Figure 8. Neutron flux spectra at a distance of 5 m from the moderator. The thick solid line indicates the spectrum obtained using the source neutron of CF. The thin solid line shows that obtained using our original source neutron [Citation16,Citation17]. The dotted line indicates the cross section of the 115In(n,n’)115mIn reaction.](/cms/asset/7122e064-265a-4a41-b0b7-64aee675a00d/tnst_a_1445566_f0008_oc.jpg)
The thick solid line and thin solid line show the spectra calculated using the CF and OS, respectively. The cross section for In5n [Citation13] is shown by the dotted line. The reaction rate obtained using the OS [Citation16,Citation17] was half of that obtained using the CF. The results indicate that the OS underestimated the neutron flux by about 50% for the production of neutrons at energies above 1 MeV at RANS.
From the results, it is concluded that the source neutron of RANS has been improved by predicting the measured reaction rate at RANS within 14% and that the function is valid provided it is used as the p–Be source neutron for proton energies of less than Ep = 12 MeV. Therefore, we believe that the function is feasible for designing compact neutron sources using p–Be with incident proton energy less than 12 MeV.
5. Summary
A function was created to calculate the neutron spectrum of a compact neutron source such as RANS [Citation1,Citation2] using p–Be with energy less than Ep = 12 MeV. The neutron spectra calculated using the function well reproduced those of existing data [Citation8,Citation23] with Ep = 4 and 12 MeV using thick Be targets. To evaluate the use of the function to model the p–Be source neutron, the reaction rate at energies of above 1 MeV calculated by implementing the function in the GEANT4 [Citation5] code was compared with the 115In(n,n’)115mIn reaction rate measured at RANS. The reaction rate calculated using the CF and the measured value were consistent within 14%. It is concluded that the function can be used to model the p–Be source neutron and can also be used as neutron production data as well as the nuclear data libraries ENDF/B-VII.0 and JENDL4.0/HE.
In future, the neutron flux at RANS including the neutron transport under various setups with and without the moderator, the neutron guide, and so forth, will be evaluated experimentally, for example, by using the 197Au(n,γ)198Au reaction for lower neutron energies than those in this study.
Acknowledgments
This work was partially supported by Cross-ministerial Strategic Innovation Promotion Program (SIP), ‘Infrastructure maintenance, renovation and management’ (Funding agency: JST) and was partially supported by the Photon and Quantum Basic Research Coordinated Development Program from the Ministry of Education, Culture, Sports, Science and Technology, Japan. The authors thank the developers of PHITS at Japan Atomic Energy Agency for their support in the calculation using PHITS and the Nuclear Data Group, Nuclear Science and Engineering Center, Japan Atomic Energy Agency in the discussion for the nuclear data.
Disclosure statement
No potential conflict of interest was reported by the authors.
Additional information
Funding
Related Research Data
References
- Otake Y, Seki Y, Wakabayashi Y, et al. Research and development of a non-destructive inspection technique with a compact neutron source. J Dis Res. 2017;12(3):585–592.
- Yamagata Y, Hirota K, Ju J, et al. Development of a neutron generating target for compact neutron sources using low energy proton beams. J Radioanal Nucl Chem. 2015;305(3):787–794.
- Chadwick MB, Young PG, Chiba S, et al. Cross-section evaluations to 150 MeV for accelerator-driven systems and implementation in MCNPX. Nucl Sci Eng. 1999;131(3):293–328.
- Sato T, Niita K, Matsuda N, et al. Particle and heavy ion transport code system PHITS, version 2.52. J Nucl Sci Technol. 2013;50(9):913–923.
- Allison J, Amako K, Apostolakis J, et al. Geant4 developments and applications. IEEE Trans Nucl Sci. 2006;53(1):270–278.
- Shin JW, Bak S, Ham C, et al. Neutron spectra produced by 30, 35 and 40 MeV proton beams at KIRAMS MC-50 cyclotron with a thick beryllium target. Nucl Instrum Meth A. 2015;797:304–310.
- Iwamoto Y, Sakamoto Y, Matsuda N, et al. Measurements of double-differential neutron-production cross-sections for the 9Be(p,xn) and 9Be(d,xn) reactions at 10 MeV. Nucl Instrum Meth A. 2009;598(3):687–695.
- Hagiwara M, Sanami T, Iwamoto Y, et al. Measurement of neutron and gamma-ray yields on thick targets bombarded with 12 MeV protons. Proceedings of the 2011 Symposium on Nuclear Data: JAEA-Conf 2012-001; 2011 Nov 16–17; Tokai,Japan : Japan Atomic Energy Agency; 2012. p. 111–116.
- Kamada S, Itoga T, Unno Y, et al. Measurement of energy-angular neutron distribution for 7Li, 9Be(p,xn) reaction at EP = 70 MeV and 11 MeV. J Korean Phys Soc. 2011;59(2):1676–1680.
- Boudard A, Cugnon J, David JC, et al. New potentialities of the Liège intranuclear cascade model for reactions induced by nucleons and light charged particles. Phys Rev C. 2013;87:014606.
- Bertini HW. Intranuclear-cascade calculation of the secondary nucleon spectra from nucleon-nucleus interactions in the energy range 340–2900 MeV and comparisons with experiment. Phys Rev. 1969;188:1711–1730.
- Chadwick MB, Obloznisky P, Herman M, et al. ENDF/B-VII.0: next generation evaluated nuclear data library for nuclear science and technology. Nucl Data Sheets. 2006;107(12):2931–3060.
- Japanese Evaluated Nuclear Data Library [internet]: Japan Atomic Energy Agency; c1995-2018 [Modified 2018 Feb 27]. Available from: http://wwwndc.jaea.go.jp/
- Koning A, Rochman D. Modern nuclear data evaluation with the TALYS code system. Nucl Data Sheets. 2012;113(12):2841–2934.
- Kunieda S, Iwamoto O, Iwamoto N, et al. Overview of JENDL-4.0/HE and benchmark calculations. Proceedings of the 2015 Symposium on Nuclear Data: JAEA-Conf 2016-004; 2015 Nov 19–20; Tokai, Japan : Japan Atomic Energy Agency; 2016. p. 111–116.
- Ikeda Y, Taketani A, Takamura M, et al. Prospect for application of compact accelerator-based neutron source to neutron engineering diffraction. Nucl Inst Meth A. 2016;833:61–67.
- Taketani A, Yamada M, Ikeda Y, et al. Visualization of water in corroded region of painted steels at a compact neutron source. ISIJ Int. 2017;57(1):155–161.
- Gibbons JH, Macklin RL. Total neutron yields from light elements under proton and alpha bombardment. Phys Rev. 1959;114(2):571–580.
- Bair JK, Jones CM. Willard HB. Neutrons from the proton bombardment of Li6, Li7, Be9, B11 and O18. Nucl Phys. 1964;53:209–218.
- Marion JB. Excited states in B10. Phys Rev. 1956;103(3):713–717.
- Bauer RW, Anderson JD, Wong C. A search for an excited state of B9 near 1.7 MeV. Nucl Phys. 1964;56:117–128.
- Verbinski VV, Burrus R. Direct and compound-nucleus neutrons from 14-18-MeV protons on 9Be, 14 N, 27Al, 56Fe, 115In, 181Ta, and 208 Pb and from 33-MeV bremsstrahlung on 27Al, 206 Pb, 208 Pb, and 209Bi. Phys Rev. 1969;177(4):1671–1686.
- Howard WB, Grimes SM, Massey TN, et al. Measurement of the thick-target 9Be(p,n) neutron energy spectra. Nucl Sci Eng. 2001;138:145–160. E
- Experimental Nuclear Reaction Data (EXFOR) [internet]: NNDC, Brrookhaven National Laboratory; [Updated 2018 Feb 28]. Available from: http://www.nndc.bnl.gov/exfor/exfor.htm
- ENSDF: Evaluated Nuclear Structure Data File Search and Retrieval [internet]: NNDC, Brookhaven National Laboratory; [Updated 2018 Feb 5]. Available from: http://www.nndc.bnl.gov/ensdf/
- Ziegler JF, Biersack J, Littmark U. The stopping and range of ions in solids. New York: Pergamon Press; 1985.
- ROOT a Data Analysis Framework [internet]: CERN; c2014-2018. Available from: https://root.cern.ch
Appendix
The parameters in Sections 2.1–2.3 related to Ep are as follows.
For total cross section ‘TCS’, their parameters are:
[a] = 195.6, [b] = 0.4587, [c] = 0.0842, [d] = 1.1455
For angular distribution ‘ACS’, their parameters of [e]–[h] are:
[e] = (0.08375 − 0.01227 × Ep + 0.000595 × Ep2)
[f] =
[g] =
[h] =
For energy spectrum ‘ECS’, their parameters of [i]–[v] are:
[m]&[u] : EnMax
[o] : EnMax at second excitation state.
[r] : EnMax at first excitation state.
[p]&[s]&[v] : ‘Gaussian width’
Gaussian Peak Area =
In this function, we use the constant numbers of [p] = 0.5, [s]&[v] = 0.07.
EnMax is the maximum outgoing neutron energy from kinematics between Ep and θ considering Q-value of 9Be + p reaction. Ep EnMax
For [m]&[o]&[r]&[u], if the values in become < 0, please convert these parameters to 0.
Ma : Proton Mass ( = 1.00783), Mb:Neutron Mass ( = 1.00866),
MA : 9Be Mass ( = 9.01218), MB:9B Mass ( = 9.01333)
Q : 9Be(p,n)9B reaction Q-value ( = -1.8505 MeV)
Ex : Energy of excited state in 9B (first:2.36 MeV, second:2.79 MeV)
Ex10B : Excitation energy of 10B(compound nucleus) =
(MeV)